2020
The majority of integral membrane proteins in an eukaryotic cell are made of one or more \(\alpha\)-helices and are first inserted co-translationally via the Sec61 translocon into the endoplasmic reticulum (ER) membrane, assembled there, and then dispatched, via the golgi apparatus and vesicles, to their final destinations. Bacteria use the SecYEG translocon, which is a homolog of Sec61, to insert membrane proteins into their plasma membrane. There are also translocons specific to chroloplasts (TIC-TOC), mitochondria (TIM-TOM) and peroxisomes (PEX), but this essay will focus on the Sec61 translocon.
1 Targeting the Protein to the ER Membrane: SRP and the Sec61 Translocon
The common co-translationally inserted membrane proteins are targeted to the Sec61 translocon on the ER membrane via the cytosolic signal recognition particle (SRP) and the SRP receptor near the translocon.
SRP is a ribonucleoprotein particle made up of 6 proteins bound to a 300-nucleotide RNA acting as a scaffold. The M and Alu domains of SRP are critical for its functions. The M domain contains a cleft whose inner surface is lined by methionine and other hydrophobic side chains. This cleft binds to a hydrophobic segment of the nascent peptide as soon as it emerges from the exit tunnel. Meanwhile, the Alu domain blocks the elongation factor 2 (eEF2) binding site on the ribosome, pausing translation.
Usually it is the first hydrophobic segment that is recognised by SRP. This segment can either be a pure ER-targeting signal sequence or be the first TM helix itself (see next section). Recognition by SRP not only serves to target the ribosome-nascent protein to the ER but also prevents exposure of the hydrophobic segment to the aqueous environment.
SRP and SRP receptor each has a GTP binding site. When their GTP-bound forms associate with each other, they form two GTPase active sites. The GTPase activity is inhibited by signal peptide binding. Once the nascent chain has left SRP and enters the translocon, the two GTP molecules are hydrolysed, causing dissociation of SRP and its receptor. GTP replaces GDP on both proteins, and they are ready to initiate another round of ER targeting.
The Sec61 translocon is made up of 3 subunits: Sec61\(\alpha\), an integral membrane protein composed of two 5-helix bundles that constitutes the central channel and two smaller proteins, Sec61\(\beta\) and Sec61\(\gamma\). The central channel through Sec61\(\alpha\) is sealed by a plug made of a helical peptide that only opens during traslocation. The channel can also open laterally by hinging apart the two 5-helix bundles to expose a hydrophobic binding pocket for signal sequences and/or TM helices of the nascent peptide. The verticle opening allows elongation of the nascent peptide chain through the central pore, and the lateral opening allows attachment of signal sequences and exit of TM helices into the membrane (Figure 1.1).
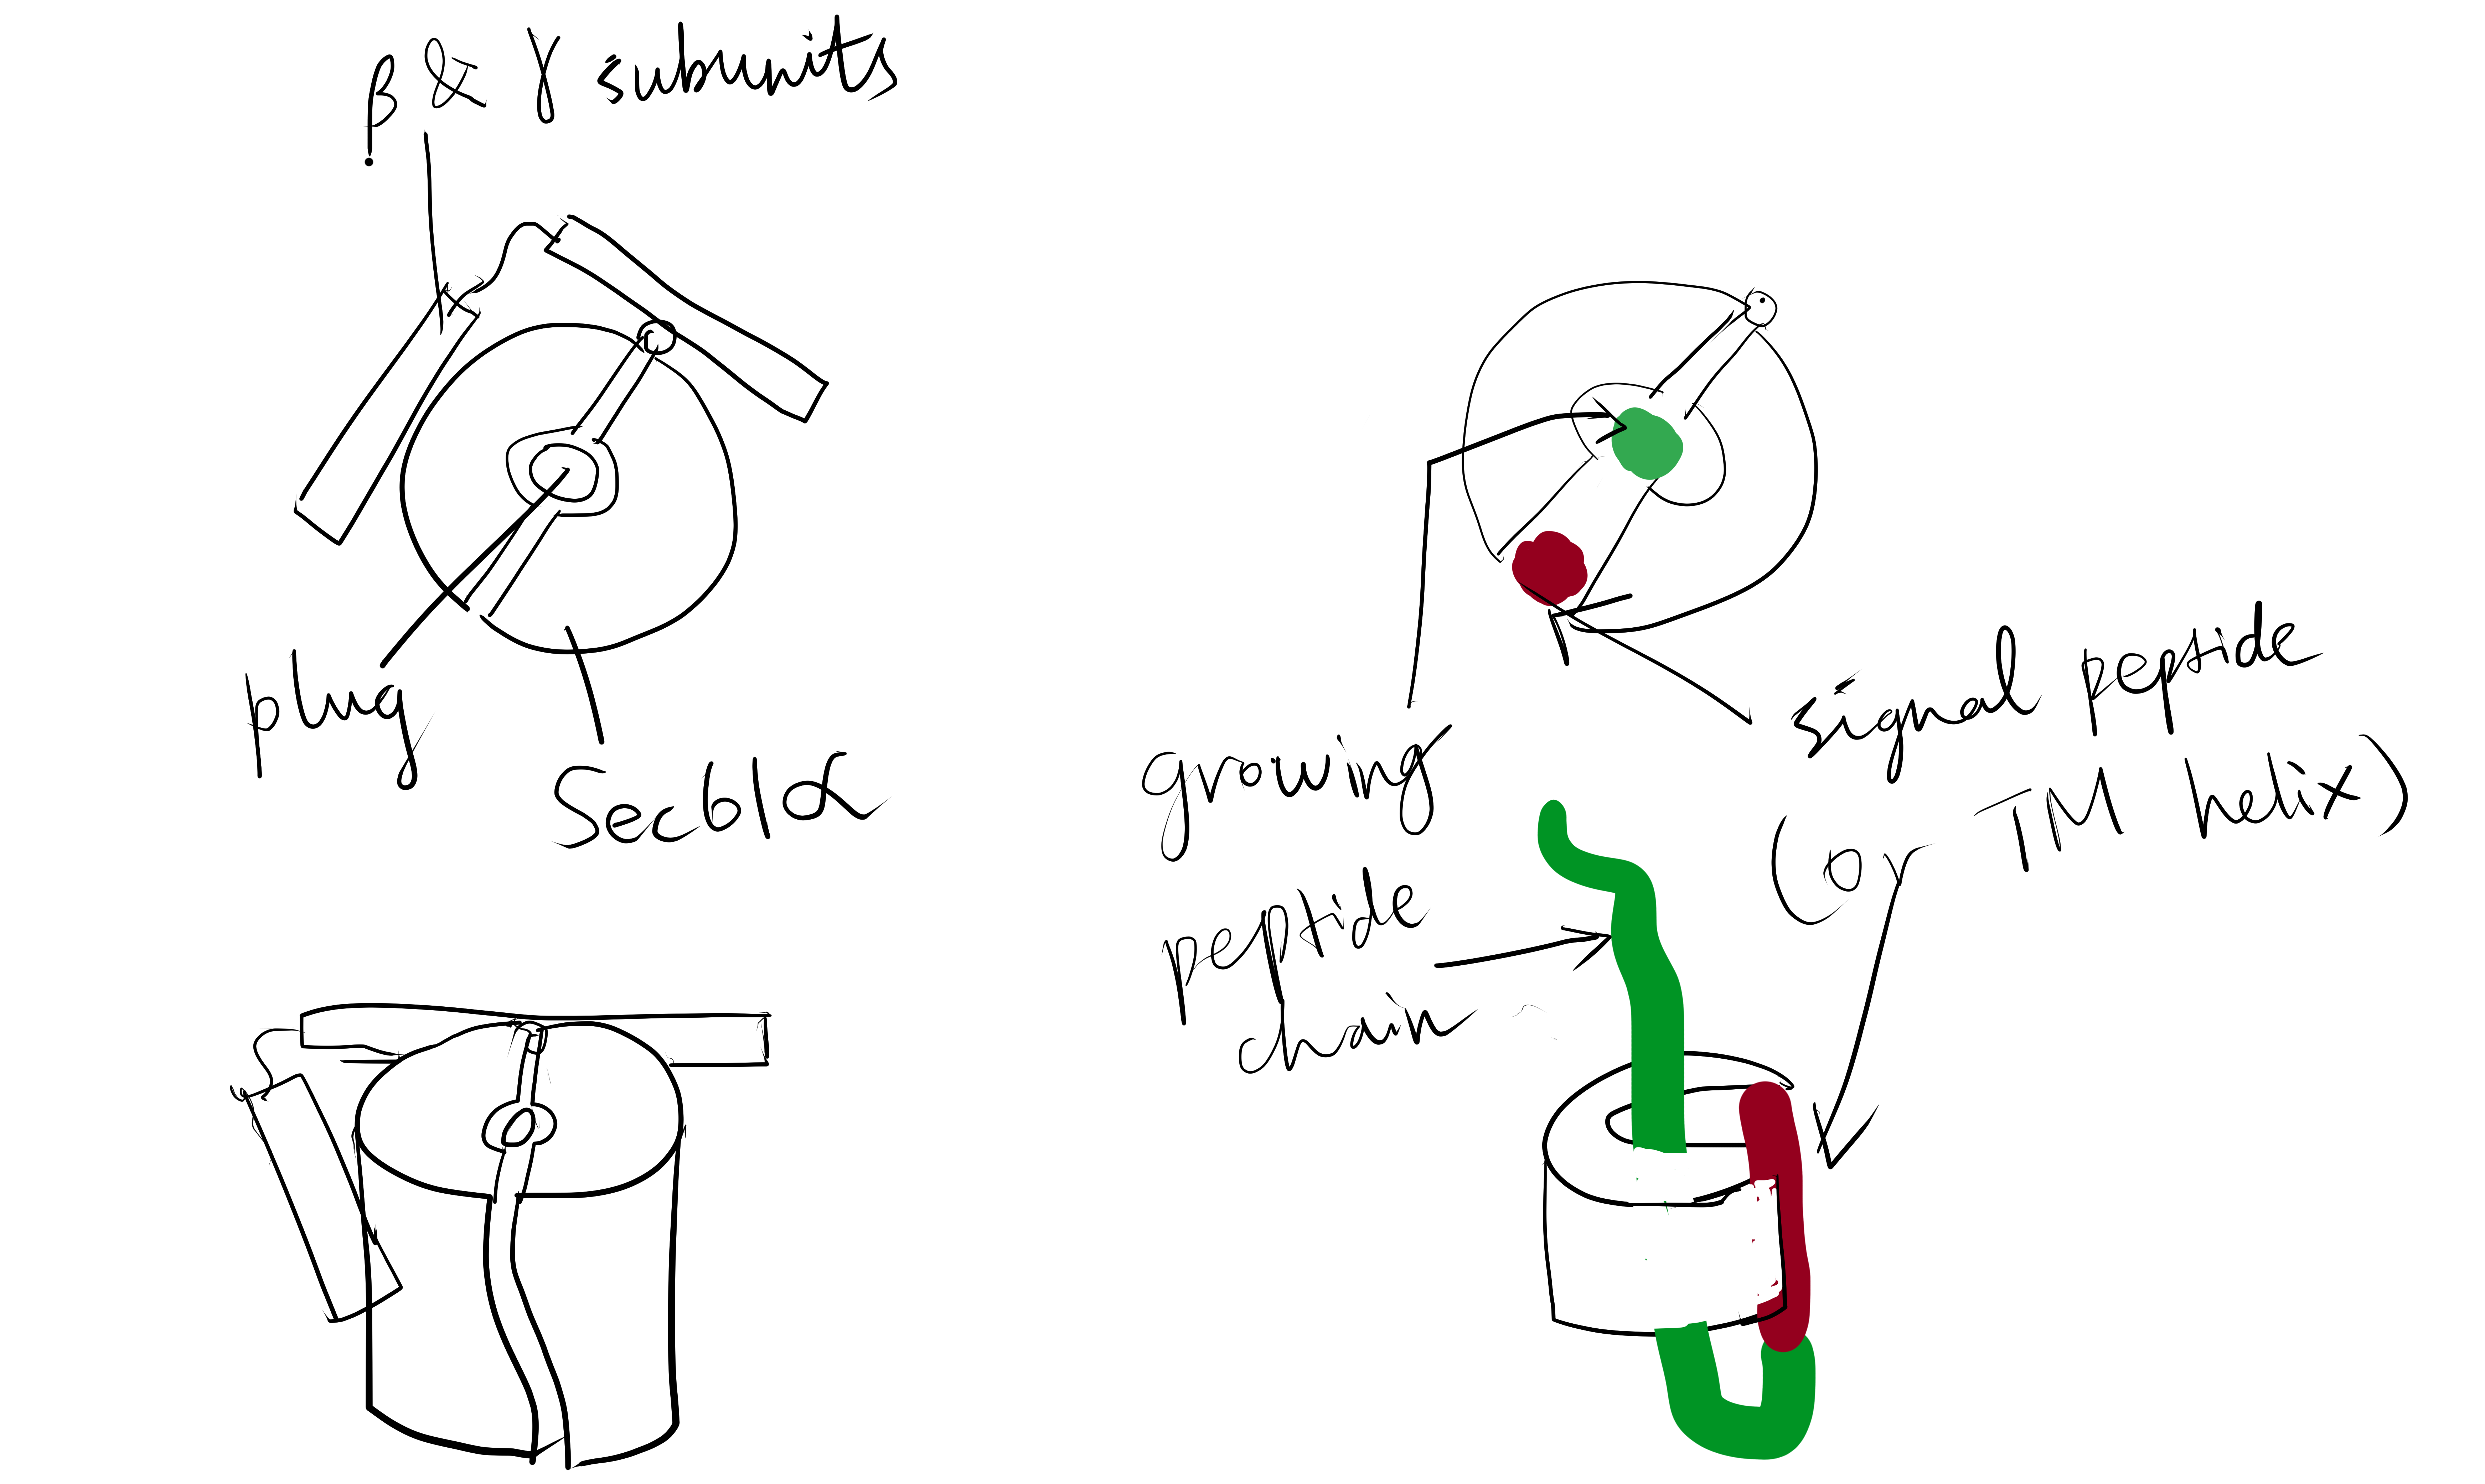
Figure 1.1: The structure and mode of action of the Sec61 translocon. Left: the closed conformation. Right: the open conformation.
2 Single-Pass Proteins
A single-pass membrane protein use a single 20-25 residue long \(\alpha\)-helix made mainly of hydrophobic amino acids to traverse the membrane. The \(\alpha\)-helical structure satisfies hydrogen bonding between main chain carbonyl and amino groups and exposes hydrophobic side chains, which form favourable hydrophobic interactions with the aliphatic core of the membrane bilayer. Co-translational insertion of this helix is a natural strategy to minimise unfavourable interation between the hydrophobic helix and the aqueous cytosolic environment and between the hydrophilic regions of the peptide surrounding the helix and the hydrophobic core of the bilayer.
Single-pass proteins are classified into three types according to the mechanism by which they are inserted. All of them are described in the following sections.
2.1 Type I Proteins
Type I membrane proteins, like soluble proteins to be translocated into the ER lumen, contain an N-terminal ER-targeting signal sequence to be cleaved. The signal sequence is recognised by SRP, causing the ribosome-nascent peptide complex to be targeted to the Sec61 translocon. Sec61\(\alpha\) opens the lateral gate, and the signal peptide fits into the exposed hydrophobic bindng pocket. The sequence following the signal peptide displaces the plug and inserts into the central channel, resulting in the conformation shown in Figure 2.1. Signal peptidase cleaves off the signal peptide once it recognises a specific sequence on the C-terminal end of the signal peptide. After cleavage, translation continues and the newly synthesised sequence is threaded through the channel and enters the ER lumen, until another hydrophobic segment is encountered. This segment is the TM helix of the nascent protein, and it acts as a stop-transfer signal (or “stop-transfer anchor sequence”) by triggering the lateral opening of Sec61\(\alpha\) and thus allowing this helix to move into the membrane. The C-terminus continues to be synthesised and loops out on the cytosolic side of the membrane. Eventually, the hydrophic N- and C- termini are on the luminal and the cytosolic face, respectively.

Figure 2.1: Insertion of type I membrane proteins.
2.2 Type II and III Proteins
Type II and III proteins do not contain a cleavable signal sequence, and they have opposite orientations: the N-terminus is on the cytosolic and the luminal face in type II and type III proteins, respectively.
Type II and III proteins use the sequence of their TM helix as an ER-targeting signal (“start-transfer singal”, or “signal anchor sequence”), and the targeting is also mediated by SRP and SRP receptor. The distribution of positively charged residues around the helix dictates its orientation: the positively charged residues tend to remain on the cytosolic side of the membrane, thus in type II proteins where the N-terminal side has more positively charged residues, the helix adopts the orientation with the N-terminus facing the cytosolic side; and in type III proteins where the C-terminal side has more positively charged residues the opposite orientation is adopted (
Figure 2.2 ).
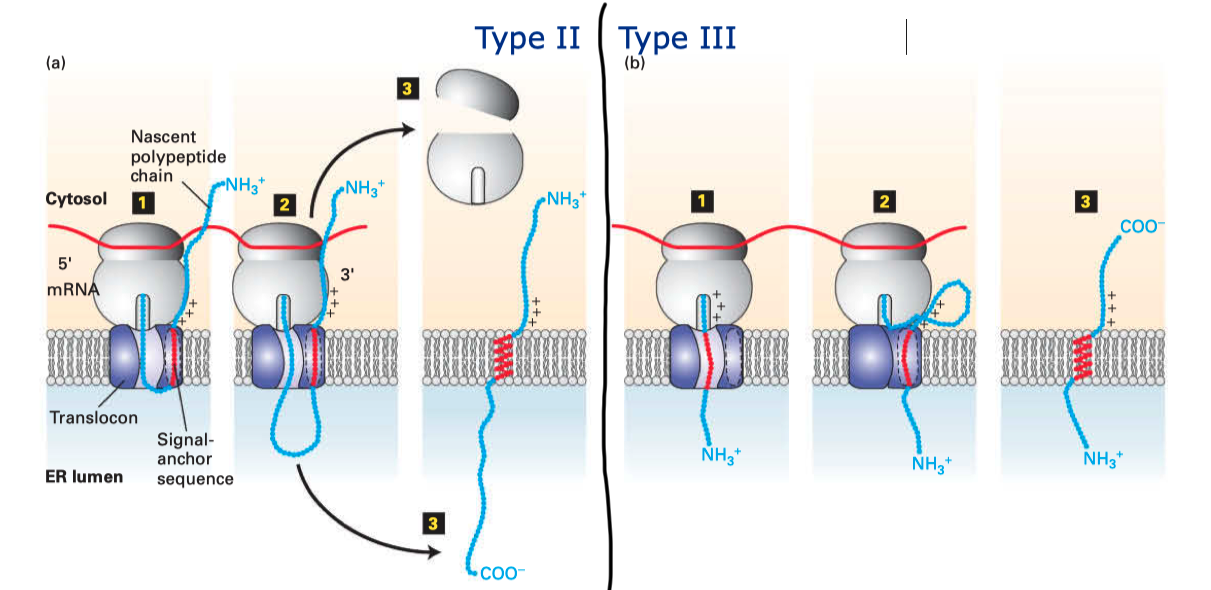
Figure 2.2: Insertion of type II and III membrane proteins. In type II proteins, the orientation of the signal anchor sequence in the hydrophibic binding pocket of the laterally opened Sec61\(\alpha\) results in the opening of the pore in the vertical direction (in the same way as type I proteins, but the signal peptide is not cleaved off), allowing the remaining C-terminal portion of the polypeptide to thread through the pore and enter the ER lumen. In type III proteins, the orientation of the signal anchor sequence causes the channel to close, and the C-terminal portion is synthesised in the cytosol.
3 Multi-Pass Proteins
Multi-pass membrane proteins (a.k.a. type IV proteins) contain more than one TM \(\alpha\) helices and traverse the membrane multiple times. Since the adjacent helices are in opposite orientations, insertion of multipass membrane proteins can be viewed as an alternation of insertion of a type I helix and insertion of a type II helix, which is dictated by the TM helix sequences that alternatingly act as start-transfer signals (signal anchor sequences) and stop-transfer signals (stop-transfer anchor sequences).
In multipass proteins with N-terminus in the cytosol (type IV-A), the TM helix sequence that first emerges from the ribosome (the one closest to the N-terminus) functions in the same way as the start transfer sequence (signal-anchor sequence) of the type II protein, which interacts with SRP to target the protein to the translocon, opens the translocon channel, and allow growing polypeptide chain to pass through the channel. Unlike type II proteins, as the chain grows, the translocon will encounter another hydrophobic TM helix sequence, which then functions as the stop-transfer signal (stop-transfer anchor sequence) in the same way as in type I proteins: the channel is closed, and this helix is moved via the lateral gate to the bilayer, and the nascent chain continues to grow into the cytosol. If a third TM helix sequence is encountered, it will function as another type II-like start-transfer signal, but this time the insertion does not depend on SRP and SRP receptor. This cycle continues until translation completes.
The insertion of multipass proteins with N-terminus in the ER lumen (type IV-B) occurs in a similar manner. The only difference is the first TM helix sequence, which now functions in the same way as the start-transfer sequence of the type III protein, resulting in a closed translocon and the growing peptide to be synthesised in the cytosol. Then, the second, third, fourth TM helix sequences functions in the same way as the first, second, and third TM helix sequences in a type IV-A protein and so on.

Figure 3.1: Multipass membrane proteins have multiple TM helices which alternatingly function as start-transfer signals (signal-anchor sequences, SA) and stop-transfer signals (stop-transfer anchor sequences, STA). The distribution of charge usually follows the same rule as in type II and III proteins, so that in the final conformation, the cytosolic side has more positively charged residues overall.
4 Insertases
Some membrane proteins are inserted into the lipid bilayer via Sec-independent mechanisms, which are mediated by factors generally termed ‘insertases’. The bacterial (YidC), mitochondrial (Oxa1), and chrloroplast (Alb3) insertases are evolutionarily related, whereas the ER membrane contains 3 seemingly unrelated insertases: Get1/2 complex, the ER membrane-protein complex (EMC), and TMCO1.
4.1 Insertion of Tail-anchored Proteins by the Get system
Tail-anchored proteins also use an \(\alpha\)-helix to traverse the membrane, but this helix is located near the C-terminus. Because there are only few, if any, residues succeeding the C-terminal helix, translation terminates while the helix have not yet emerged from the exit tunnel, so recognition by SRP is not possible, and its insertion into ER membrane depends on a post-translational pathway involving Get1, Get2, and Get3 proteins.
In this pathway, the protein is completely synthesised and released into the cytosol. ATP-bound Get3 binds to the hydrophobic C-terminal tail of the protein (facilitated by some other proteins), and then docks onto the dimeric Get1/Get2 receptor on the ER membrane. Accompanying the hydrolysis of ATP by Get3, the Get1/Get2 complex facilitates the insertion of the tail into the ER membrane. Finally, ATP displaces ADP and Get3 is released back to the cytosol.
4.2 The Roles of YidC
YidC contains 5 TM helices arranged to form a partially hydrophilic groove that is open towards both the lipid bilayer and the cytosol (Figure 4.1). Cross-linking experiments suggest that this groove operates as a binding site for TM helices (of the protein to be inserted). YidC alone can mediate insertion of a small subset of small (single- or double-pass) proteins in either co-translationally or post-translationally, and it is also suggested that YidC may act as a chaperone in conjunction with the Sec translocon. Specifically, it may shield the hydrophilic surface of TM helice that line polar cavities/channels in the final structure.
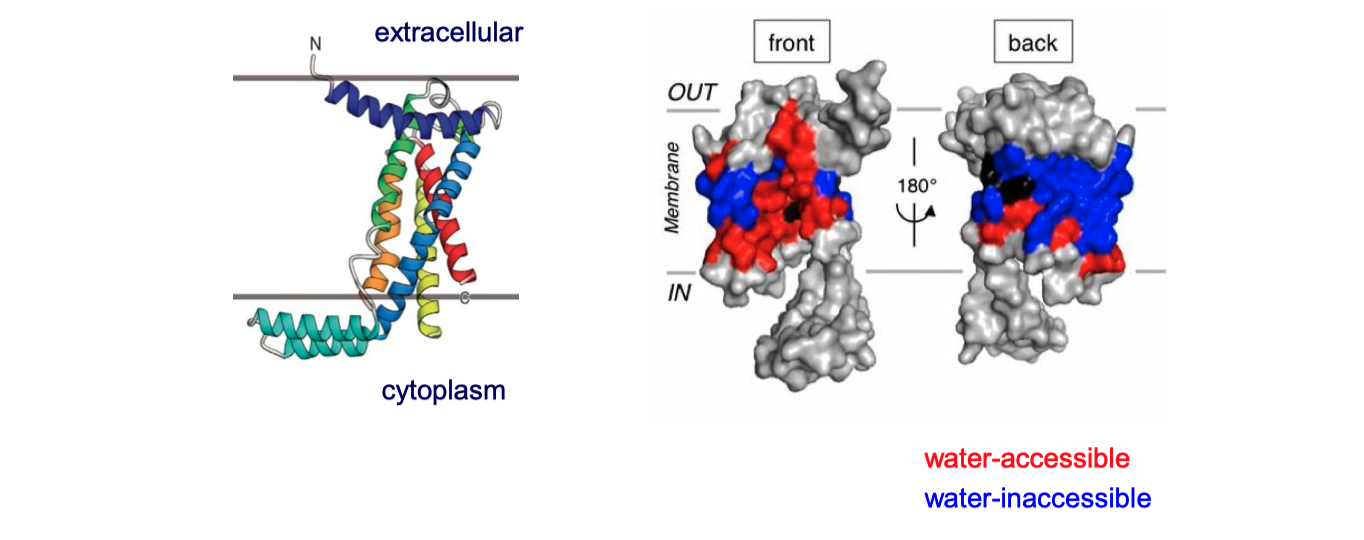
Figure 4.1: The structure of Bacillus halodurans Yidc.
5 \(\beta\)-barrel Proteins
In Gram-negative bacteria, intergral OM (outer membrane) \(\beta\)-barrel proteins (OMPs) are translocated in an unfolded form across the IM (inner membrane), ferried to the OM via periplasmic chaperones, and integrated into the OM by the \(\beta\)-barrel assembly machine (Bam) multiprotein complex.
In mitochondria, the precursors of nucleus-encoded \(\beta\)-barrel proteins are transferred from the TOM complex, with the help of chaperones, to the SAM (sorting and assembly machinery) complex. The SAM complex, being homologous to the Bam complex, mediates the assembly and insertion of \(\beta\)-barrel proteins in a similar manner (Figure 5.1).
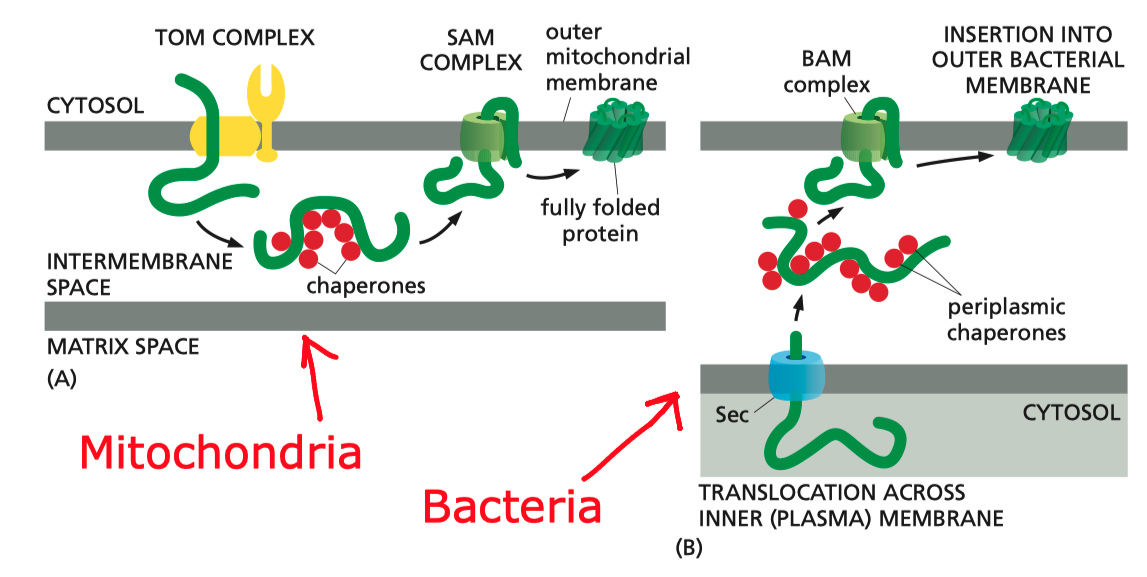
Figure 5.1: Insertion of \(\beta\)-barrel proteins into bacterial or mitochondrial outer membrane.
The exact mechanism of assembly and insertion is not fully understood, but a recent proposed mechanism is shown in Figure 5.2 (Ricci and Silhavy 2019).
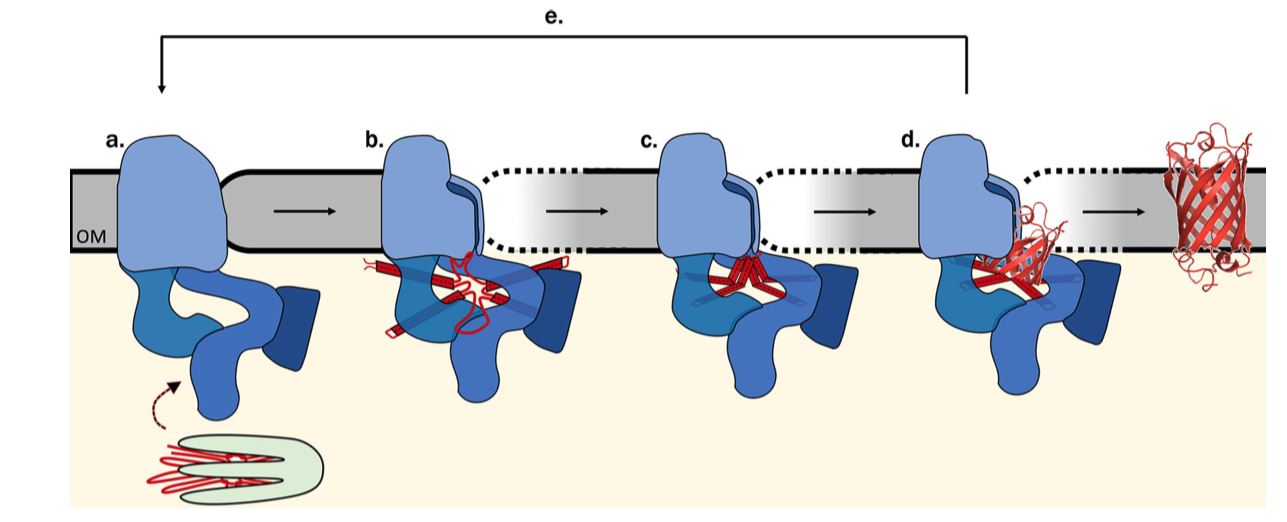
Figure 5.2: Proposed Bam-assisted assembly and insertion of \(\beta\)-barrel proteins. (a) Unfolded precursor protein (red) stablised by chaperons (green) are transferred to the Bam complex (blue). (b) The five periplasmic POTRA domains of BamA is thought to nucleate the early formation of OMP secondary structure and, together with Bam lipoproteins, form a ring that act as a scaffold for the client protein. The hydrogen bonds between the \(\beta\)-1 and \(\beta\)-16 strands of BamA are metastable, allowing transient lateral opening of the barrel through this seam. (c) The Bam complex prevents aggregation, protects the client protein from proteolysis, and lowers the kinetic barrier to OM integration to accelerate OMP folding along the native pathway, (d) Bam destabilises the membrane locally, which facilitates the insertion of the client protein into the membrane. (e) The folded client protein is released into the membrane, and the Bam complex restores to its idle state.
References
Alberts, Bruce, Alexander Johnson, Julian Lewis, David Morgan, Martin Raff, Keith Roberts, and Peter Walter. 2014. Molecular Biology of the Cell. Book. 6th ed. Garland Science.
Cymer, Florian, Gunnar von Heijne, and Stephen H. White. 2015. “Mechanisms of Integral Membrane Protein Insertion and Folding.” Journal of Molecular Biology 427 (5): 999–1022. https://doi.org/https://doi.org/10.1016/j.jmb.2014.09.014.
Guna, Alina, and Ramanujan S. Hegde. n.d. “Transmembrane Domain Recognition During Membrane Protein Biogenesis and Quality Control.” Current Biology 28 (8): R498–R511. https://doi.org/10.1016/j.cub.2018.02.004.
Lodish, Harvey F., Arnold Berk, Chris Kaiser, Monty Krieger, Anthony Bretscher, Hidde L. Ploegh, Angelika Amon, and Kelsey C Martin. 2016. Molecular Cell Biology. Book. 8th ed. New York: W.H. Freeman.
Ricci, Dante P., and Thomas J. Silhavy. 2019. “Outer Membrane Protein Insertion by the β-Barrel Assembly Machine.” In Protein Secretion in Bacteria, 91–101. American Society of Microbiology. https://www.asmscience.org/content/book/10.1128/9781683670285.chap8.
1 Introduction
Protein-DNA interactions have profound impact on the expression and regulation of genes. Many DNA-binding proteins, especially transcription factors, are able to recognise and bind to a specific short sequence of DNA, while others, typically those involved in routine tasks such as DNA damage repair (e.g. glycosylase) and DNA packaging (e.g. histone) show less specificity.
2 An Overview of Mechanisms of Protein-DNA Interactions
Binding of proteins to DNA results from the favourable interactions between short DNA sequences and the amino acid side chains of specific DNA-binding motifs in proteins. In many DNA-binding proteins, the affinity and specificity of binding is also enhanced by flexible segments outside the globular core that mediate specific and nonspecific interactions but are sometimes not included in the definition of DNA binding domains. The majority of DNA-binding domains are made of either \(\alpha\)-helices, \(\beta\)-sheets, or both. While they can be classified into different types of motifs, any one type of motif can be used in multiple ways to interact with DNA, depending on the protein and the binding site.
There are multiple mechanisms by which specificity is achieved. First, specific DNA base pairs and amino acid side chains can establish shape complementarity, resulting in hydrogen bonds or favourble polar, electrostatic, or hydrophobic interactions. This is commonly referred to as direct readout or base readout. These interactions usually more frequently in the the more accessible major groove of DNA than in the minor groove. However, there is no simple one-to-one relationship between DNA and protein sequences, which means this mechanism itself is not sufficient to accout for the specificity. The second mechanism, shape readout, involves recognition of a sequence-dependent DNA shape, for example an overall bend, a segment of narrow minor groove, or a kinked base pair step.
Base readout and shape readout can be further devided into different modes. These mechanisms rarely exists in isolation, and protein-DNA recognition uses a continuum of mechanisms that depend on the structural features and flexibility of both DNA and protein.
3 Thermodynamics of Protein-DNA Binding
All protein-DNA complexes can gain favourable \(\Delta H\) from direct protein-DNA recognition interactions and favourable \(\Delta S\) from water release. However, in systems with strongly distorted DNA, the loss of favourable interaction due to the molecular strain of base pair destacking is so large so that the net \(\Delta H\) becomes unfavourable. This is compensated by a more positive \(\Delta S\) as the strained interface experiences less immobilisation (Figure 3.1).
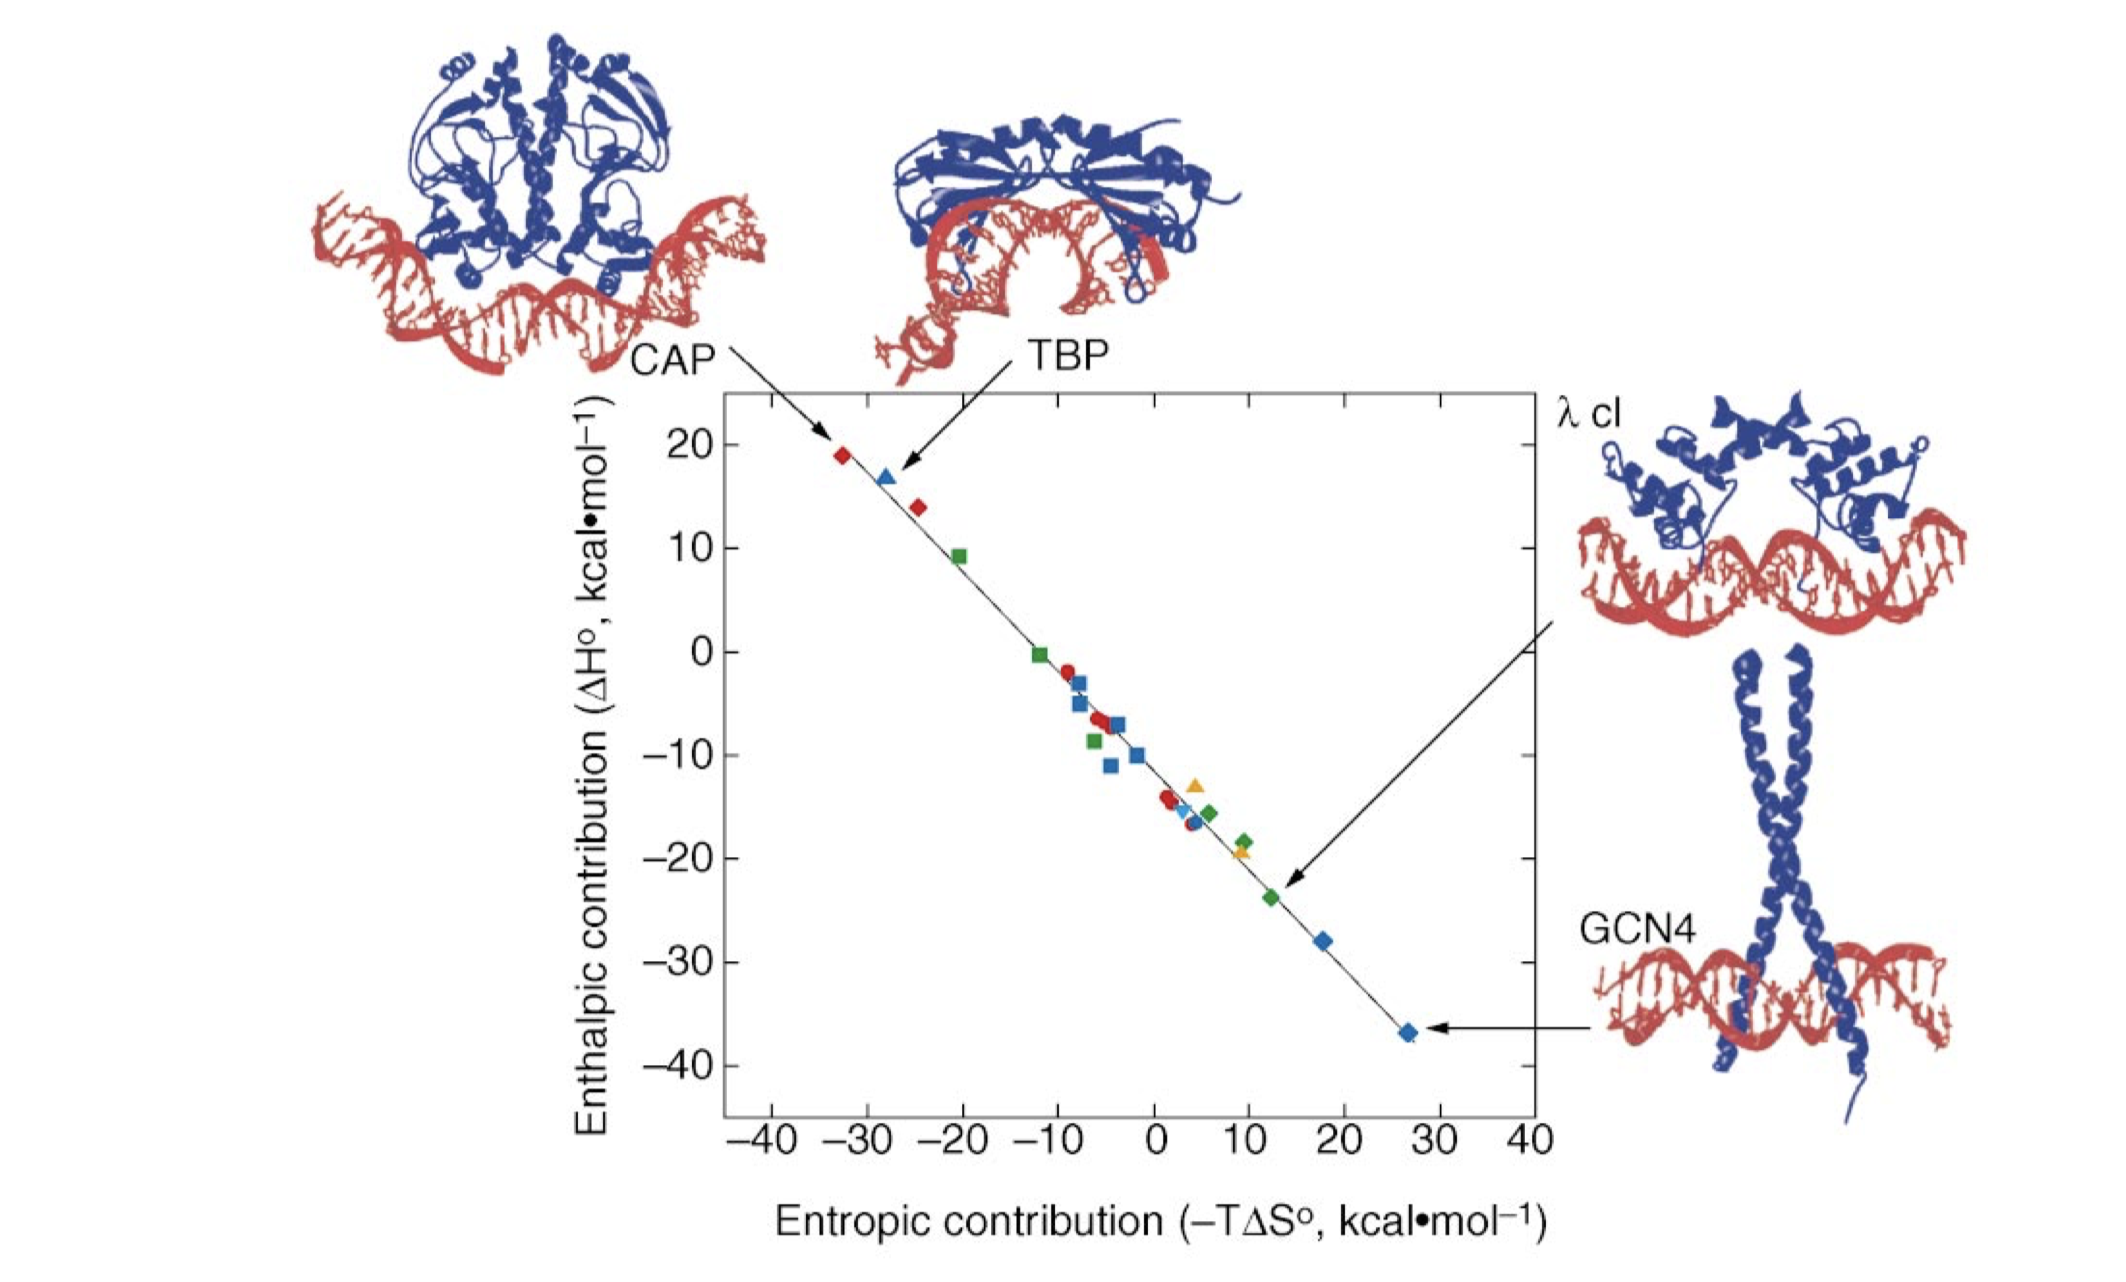
Figure 3.1: The relative enthalphic and entropic contributions to binding free energy (\(\Delta G_\text{free}\)) of a few site-specific DNA-binding proteins with similar \(\Delta G_\text{free}\) (about -11.7 kcal/mol). Taken from Jen-Jacobson, Engler, and Jacobson (2000)
4 Base Readout in the Major Groove
The major groove is an ideal site for forming specific interactions between DNA bases and amino acid side chains because the four possible base pairs have a unique pattern of hydrogen bond donors and acceptors (and the 5-methyl of thymine) in the major groove. Proteins can also form hydrogen bonds with bases in the minor groove, but this contributes much less to the specificity (because the hydrogen bonding pattern cannot distinguish between AT from TA or CG from GC) (4.1). Many DNA-binding motifs, including HTH, zinc finger and Leucine zipper, forms hydrogen bonds in the major groove.
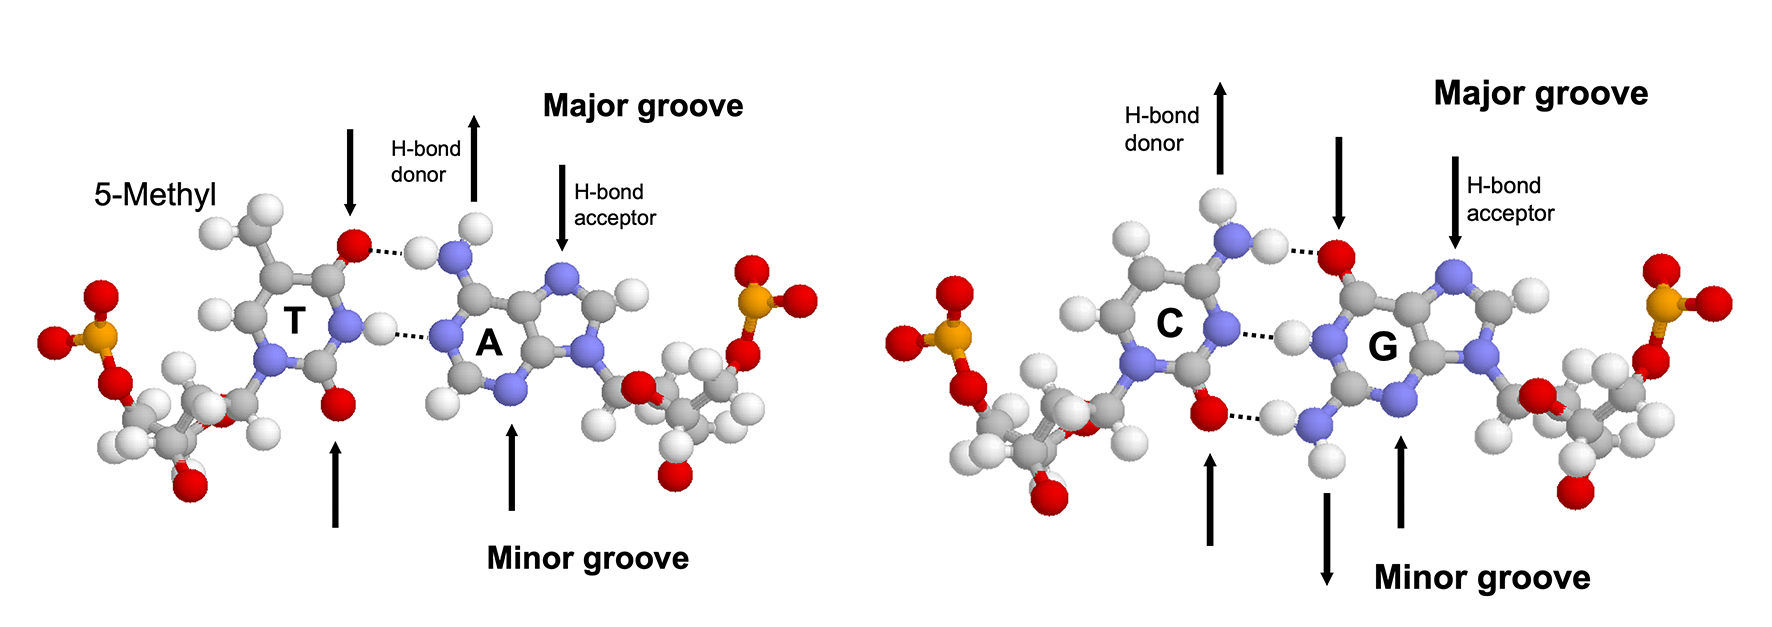
Figure 4.1: Hydrogen bonding patterns in the major and minor groove of AT and CG base pairs.
Specificity not only depends on the number of contacts formed but also on the uniqueness of the hydrogen bonding geometry. Bidentate hydrogen bonds (2 H-bonds with different donors and receptors, which can be formed, for example, between the two NH/NH2 groups and the O and N of guanine) have the highest degree of specificity followed by bifurcated hydrogen bonds (two H-bonds share one donor) and single hydrogen bonds.
Water molecules can be found at some protein-DNA binding sites. While water molecules can allow flexibility and mediate non-specific binding, they are also present in many specific protein-DNA compelxes, such as Trp repressor-DNA, where their positions are highly ordered and serve to bridge the hydrogen bonds.
5 Shape Readout
In physiological conditions, most DNA exists in its B form with well-defined geometries. However, due to the subtle differences between the chemical properties of the four bases, the DNA shape varies in a sequence-dependent manner, and this structural variation is important for protein-DNA recognition.
The B-DNA conformation is largely stabilised by the stacking energy between adjacent base pairs. Thus regions with weak stacking energy, which were found to be AT-AT and AT-TA stacks, have a stronger deformability (i.e. propensity to deviate from the B-DNA conformation). Specifically, DNA sequences of at least four consecutive A-T base pairs without an intervening TpA step are called “A-tracts”, which not only improves deformability but also has implications on electrostatic potentials, which are described in Section 5.1
The following table summarises the relationship between several sequence elements and their impact on the structural property of DNA:
| Sequence Element | Structural Property |
|---|---|
| A-tract | narrow minor groove, bending, rigid for \(\ge\) bp |
| TATA box | high deformability |
| YpR step (especially TpA) | compresses major groove, high deformability, ‘hinge’ step, kinking |
| RpY step | compresses minor groove, low deformability |
5.1 Minor Groove Narrowing
Rohs et al. (2009) reported that the binding of arginine residues to narrow (\(< 5\) angstroms) minor grooves is a common mode of protein-DNA recognition (Figure 5.1). These narrow groove are usually associates with A-tracts, which estabilish a connection between DNA sequence and shape. Arginines often insert into the minor groove as part of short sequence motifs that vary among different proteins, e.g. Arg-Gln-Arg in the Hox protein SCR, Arg-Lys-Lys-Arg in POU homeodomains, thus providing specificity.
The narrowing results in a more negative electrostatic potential in the minor groove, which promotes the binding of positively charged arginine. The preference of arginine over lysine can be explained by the greater energetic cost of removing a charged lysine from water due to lysine’s smaller radius of the charged group (or greater charge density) compared to arginine.
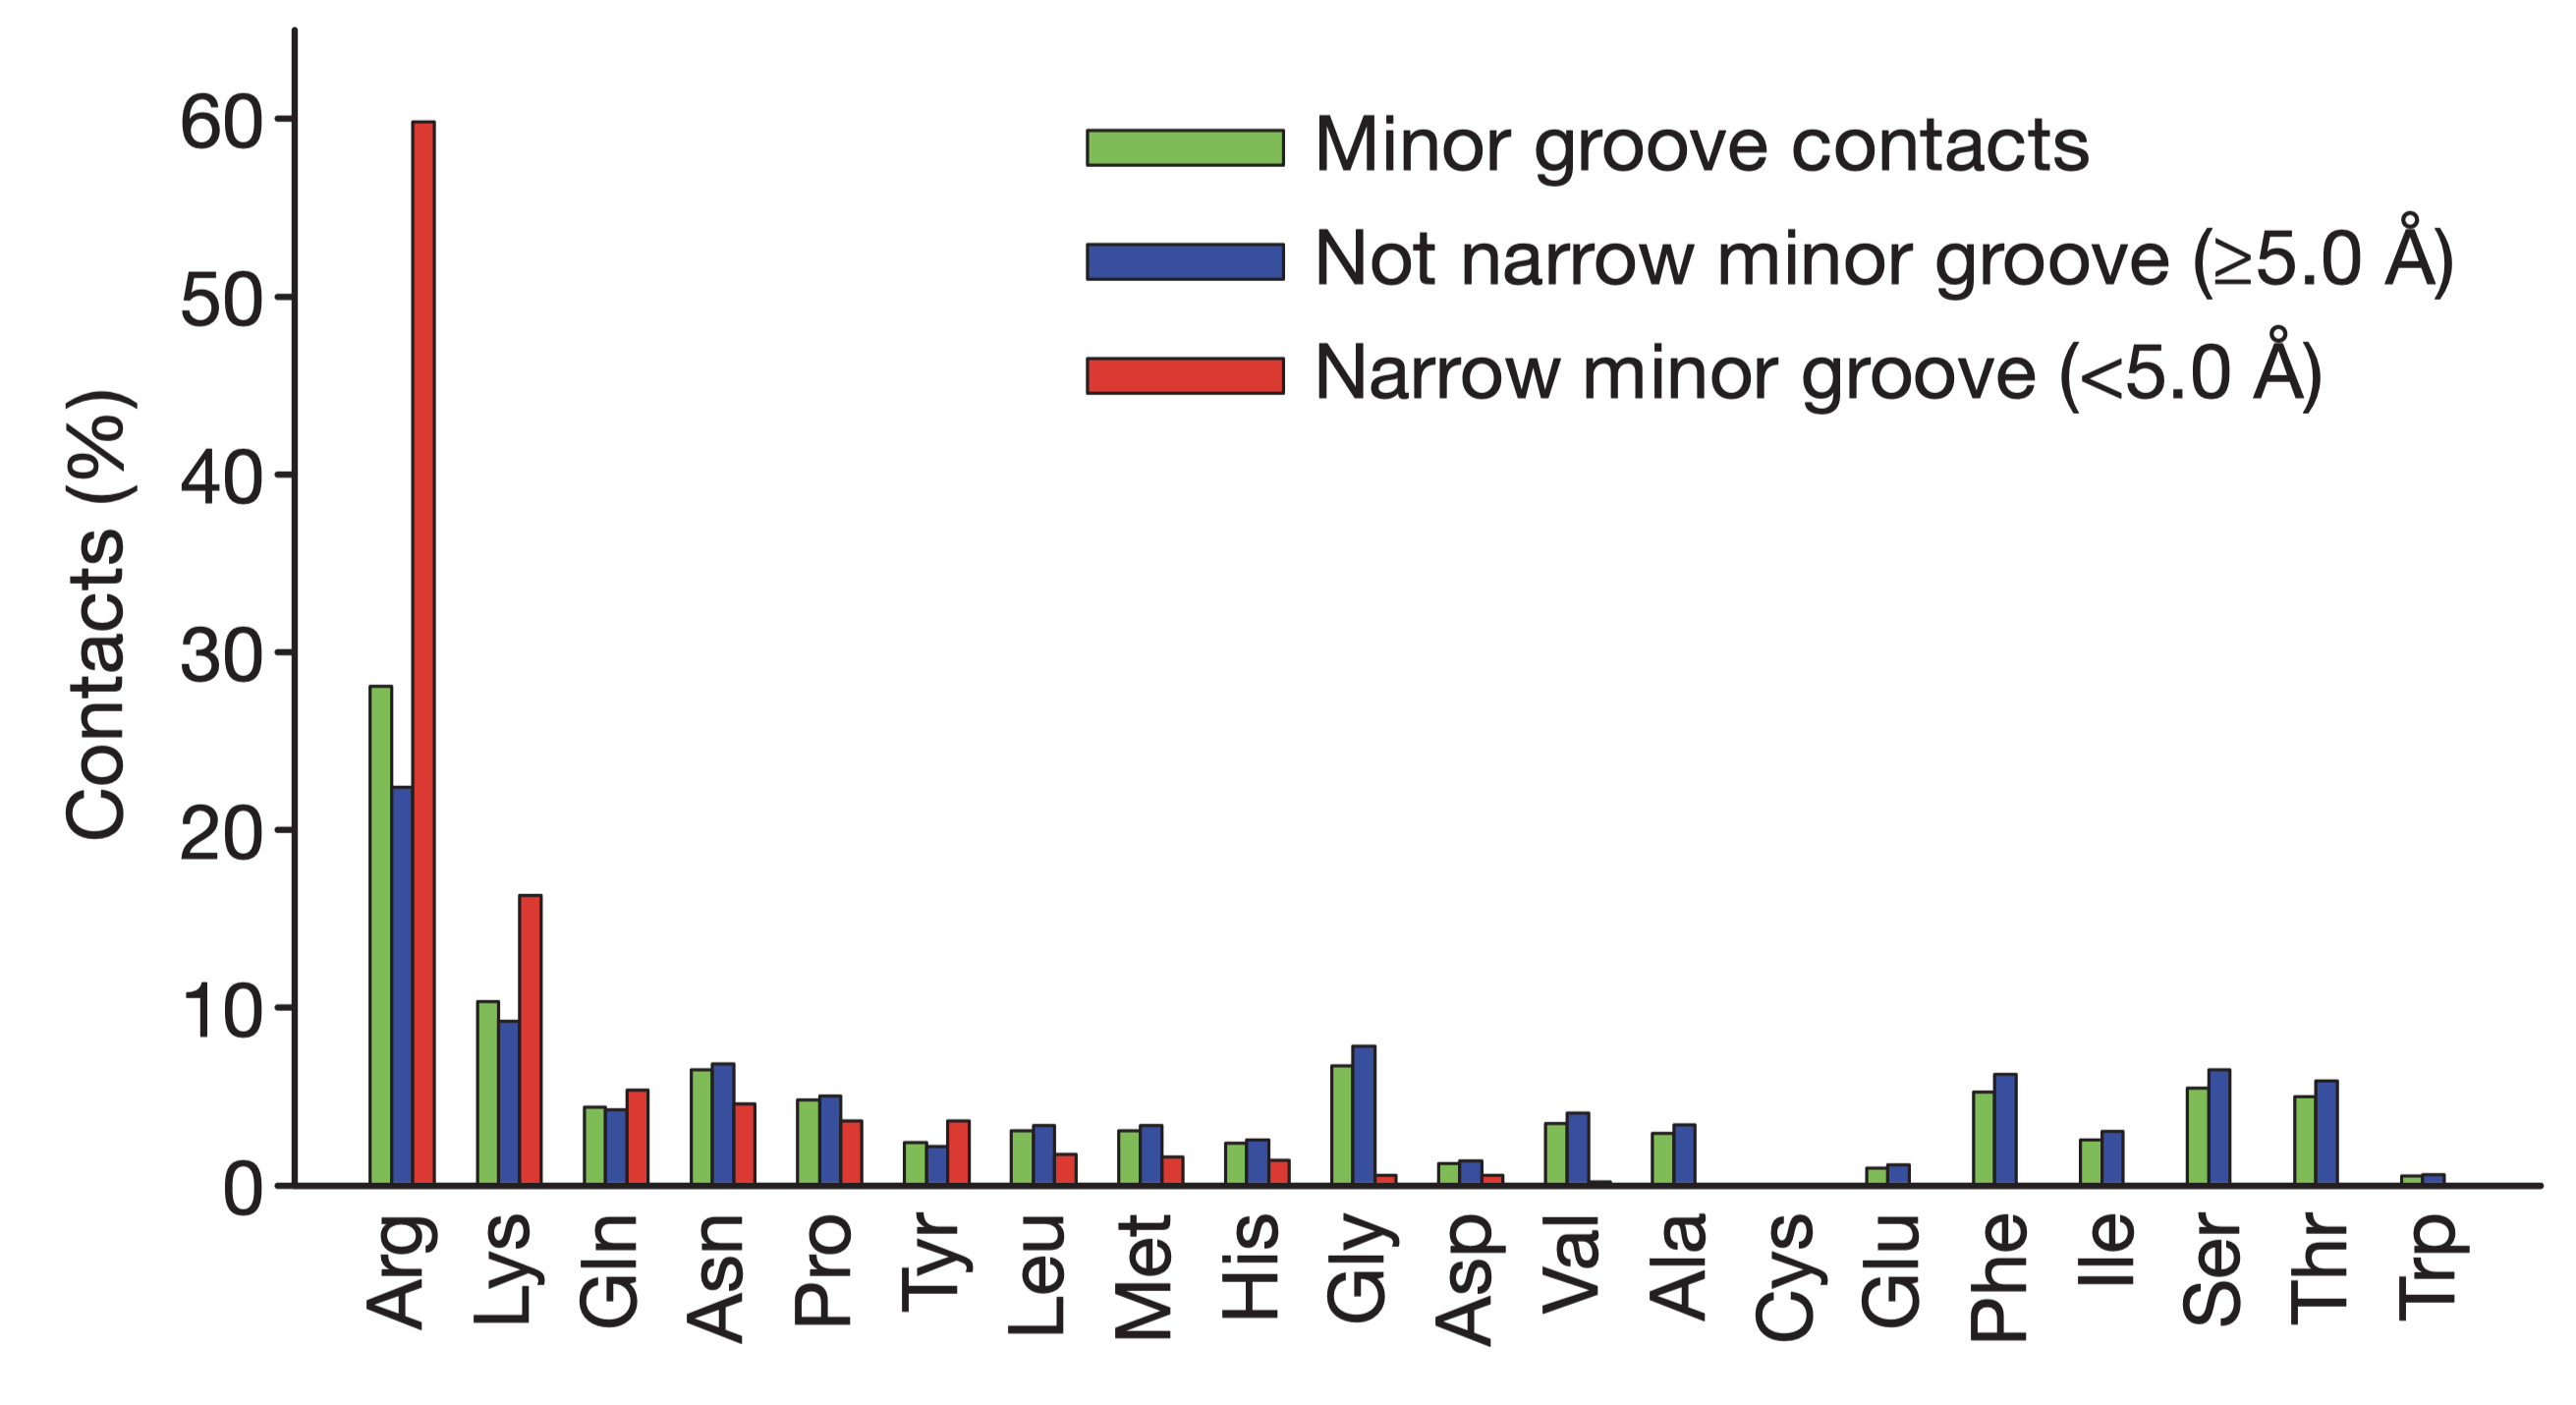
Figure 5.1: Amino acid frequencies in minor grooves. Taken from Rohs et al. (2009)
5.2 Kinks
YpR steps (especially TpA steps) have a strong tendency to form kinks that disrupt the linearity of the double helix. They can contribute to binding specificity by optimising protein-DNA contacts. The binding site of the catabolite activator protein (CAP), for example, shows dramatic kinks at two CpA steps, which along with two additional smaller kinks cause an overall bending of the DNA of about 90 degrees around the protein.
6 The Nucleosome as an Example of Non-Specific Binding
Histones are the ubiquitous nuclear protein that mainly serve to compact DNA. A nucleosome is formed by 147 base pairs of DNA wrapping around a histone octamer, and adjacent nucleosomes are joined by a linker sequence (about 50 bp long in humans). Since nucleosome are so prevalent, the histone-DNA interaction is often considered as non-specific, and its association with DNA is thought to be due to the electrostatic attraction between the abundant lysine and arginine residues on the surface of histoens and the negatively charged phosphate backbone of DNA. However, histones have preferred DNA regions to bind to.
Nucleosomes are often formed in regions enriched with A-tracts for two reasons. First, A-tracts offer high deformability, which is required to bend DNA and wrap it around histone octamers. Second, histones are enriched with arginine residues, which recognise and penetrateinto the narrow minor grooves formed by A-tracts, thus providing important stabilising interaction (Section 5.1).
7 (Question 2)
7.1 (a) bHLH Motif
The basic helix-loop-helix (bHLH) motif consists of two \(\alpha\)-helices separated by a loop. One of the helices (usually the longer one) contain basic residues (arginine and lysine) that bind to the major groove of DNA. The flexible loop and the other helix are involved in dimerisation. Many bHTH proteins occur as heterodimers (e.g. Myc/MAX), and their activity is hightly regulated by the dimerisation of subunits.
7.2 (b) Leucine Zipper
The leucine zipper motif consists of a dimer of \(\alpha\)-helices. The dimerisation is driven by interactions between the hydrophobic side chains that cover their inner surfaces. Specifically, each helix has a periodic repetition of leucine residues at every seventh position. Since every turn in an \(\alpha\)-helix contains 3.6 amino acids—two turns contain 7.2, which is slightly more than 7, the helices coil around one another in a left-handed sense. The N-terminal DNA-binding domains of each helix protrudes into the major groove of DNA, which together recognise a 8-bp long sequence.
7.3 (c) Zinc Finger
The zinc finger contains a short \(\alpha\)-helix, a two-stranded antiparallel \(\beta\)-sheet, and a Zn2+ ion coordinated by cysteine and histine residues. The zinc ion serves to stabilise the overall structure, while the helix make contact with DNA’s major groove. A typical zinc finger protein, e.g. Zif268, contains a chain of 3 zinc-finger modules that coil in a right-handed sense, so as to follow the curve within the major groove. Each finger recognises 3 base pairs, and thus a protein with 3 zinc finger domains recognise a continuous sequence of 9 base pairs.
7.4 (d) TATA box binding protein
TATA box binding proteins (TBP) use a ten-stranded \(\beta\)-sheet to recognise DNA by binding in the minor groove. Insertion of the concave \(\beta\)-sheet into the groove requires substantial DNA distortion. The flexibility intrinsic to TpA steps (Section 5) in the TATA sequence faciliates formation of kinks when TBP binds. In addition, yeast TBP-TATA structure shows that the kinks in the first and last base pair step (TATATAAA) are stabilised through intercalations with phenylalanine residues.
References
Calladine, Chris R., Horace Drew, Ben Luisi, and Andrew Travers. 2004. Understanding Dna-the Molecule and How It Works. 3rd ed. Academic Press. http://gen.lib.rus.ec/book/index.php?md5=c6b8d89cd8868255bc9ebd4cf51e1917.
Jen-Jacobson, Linda, Lisa E. Engler, and Lewis A. Jacobson. 2000. “Structural and Thermodynamic Strategies for Site-Specific Dna Binding Proteins.” Structure 8 (10): 1015–23. https://doi.org/https://doi.org/10.1016/S0969-2126(00)00501-3.
Rohs, Remo, Sean M. West, Alona Sosinsky, Peng Liu, Richard S. Mann, and Barry Honig. 2009. “The Role of Dna Shape in Protein–Dna Recognition.” Nature 461 (7268): 1248–53. https://doi.org/10.1038/nature08473.
How and why do proteins form specific complexes with each other? How can such protein-protein interactions (PPIs) be investigated experimentally, and which problems are associated with designing small molecules to disrupt PPIs?
1 Introduction
Specific protein-protein interactions (PPIs) are critical to numerous biological processes, including cell-cell recognition, immune response, and signal transduction. An understanding of PPIs not only helps to elucidate the detailed roles and to predict the behaviour of proteins in a physiological context but also aids structure-based drug design.
2 Properties of PPI
2.1 Reversibility
Protein-protein interactions can be stable (permanent) or transient. Stable interactions are involved in the assembly of proteins made of multi-subunit complexes such as haemoglobin, which non-reversible in normal physiological conditions. Transient interactions, on the other hand, are reversible, and it is this property that make them act like molecular switches that play versatile roles in controlling cellular processes.
2.2 Properties of the Binding Interfaces
Protein-protein interaction interfaces often have a large surface area (1000-2000 Å2) and are relatively flat compared to the deep cavities that typically bind small molecules. On a binding interface, some residues, known as “hotspots”, contribute to the overall affinity more than other residues.
2.3 Roles of Water Molecules
Crystal structures frequently reveal water molecules within PPI interfaces. These water molecules play multifaceted roles in the stability of PPI, e.g. offsetting unfavourable electrostatic interactions, bridging two distant residues via H-bonds.
2.4 Kinetics and Thermodynamics
Reversible PPIs have two important parameters: affinity and specificity. While affinity ranges from as low as millimolar to as high as femtomolar, it is important that the specificity, i.e. the relative affinity of a protein to its cognate binding partner compared to non-cognate ones, is high.
Reversible PPIs can the considered as a simple balance of association and dissociation reactions, with rate constants being \(k_{\text{on}}\) and \(k_{\text{off}}\).
\[ \text{A+B}\mathrel{\mathop{\rightleftarrows}^{k_{\text{on}}}_{k_{\text{off}}}} \text{AB} \]
The affinity is usually defined by the dissociation constant:
\[ K_\text{d} = \dfrac{\text{[A][B]}}{\text{[AB]}} = \dfrac{k_{\text{off}}}{k_{\text{on}}} \]
where [A], [B], and [AB] are the concentrations of each species at equilibrium.
\(K_\text{d}\) can be converted to \(\Delta G\) and vice versa:
\[ \Delta G = -RT\ln{(K_\text{d})} \]
In addition to the simple single-step model, Keeble and Kleanthous (2005) suggested that relatively low affinity PPIs may be better modelled with a two-step induced-fit mechanism involving an unstable intermediate, where electrostatics drives the fast first step (supported by strong dependence on ionic strength) and rigid body rotation occurs in the slow second step:
\[ \text{A+B} \mathrel{\mathop{\rightleftarrows}^{k_{1}}_{k_{-1}}} \text{AB}^\text{*} \mathrel{\mathop{\rightleftarrows}^{k_{2}}_{k_{-2}}} \text{AB} \]
3 Studying PPIs
3.1 Determining Kd (and rate constants)
Many experimental methods can be used used for studying thermodynamics and kinetics of PPIs (the frequent tasks are determining \(K_\text{d}\) and rate constants). Most of them assumes the simple single-step association-dissociation model (Section 2.4). Three methods are described in this essay.
3.1.1 Surface Plasmon resonance (SPR)
Surface plasmon resonance (Figure 3.1) can be used to measure both \(K_\text{d}\) and \(k_\text{on}\) and \(k_\text{off}\) rates. How \(K_\text{d}\) can be calculated is explained in Equation (3.1).
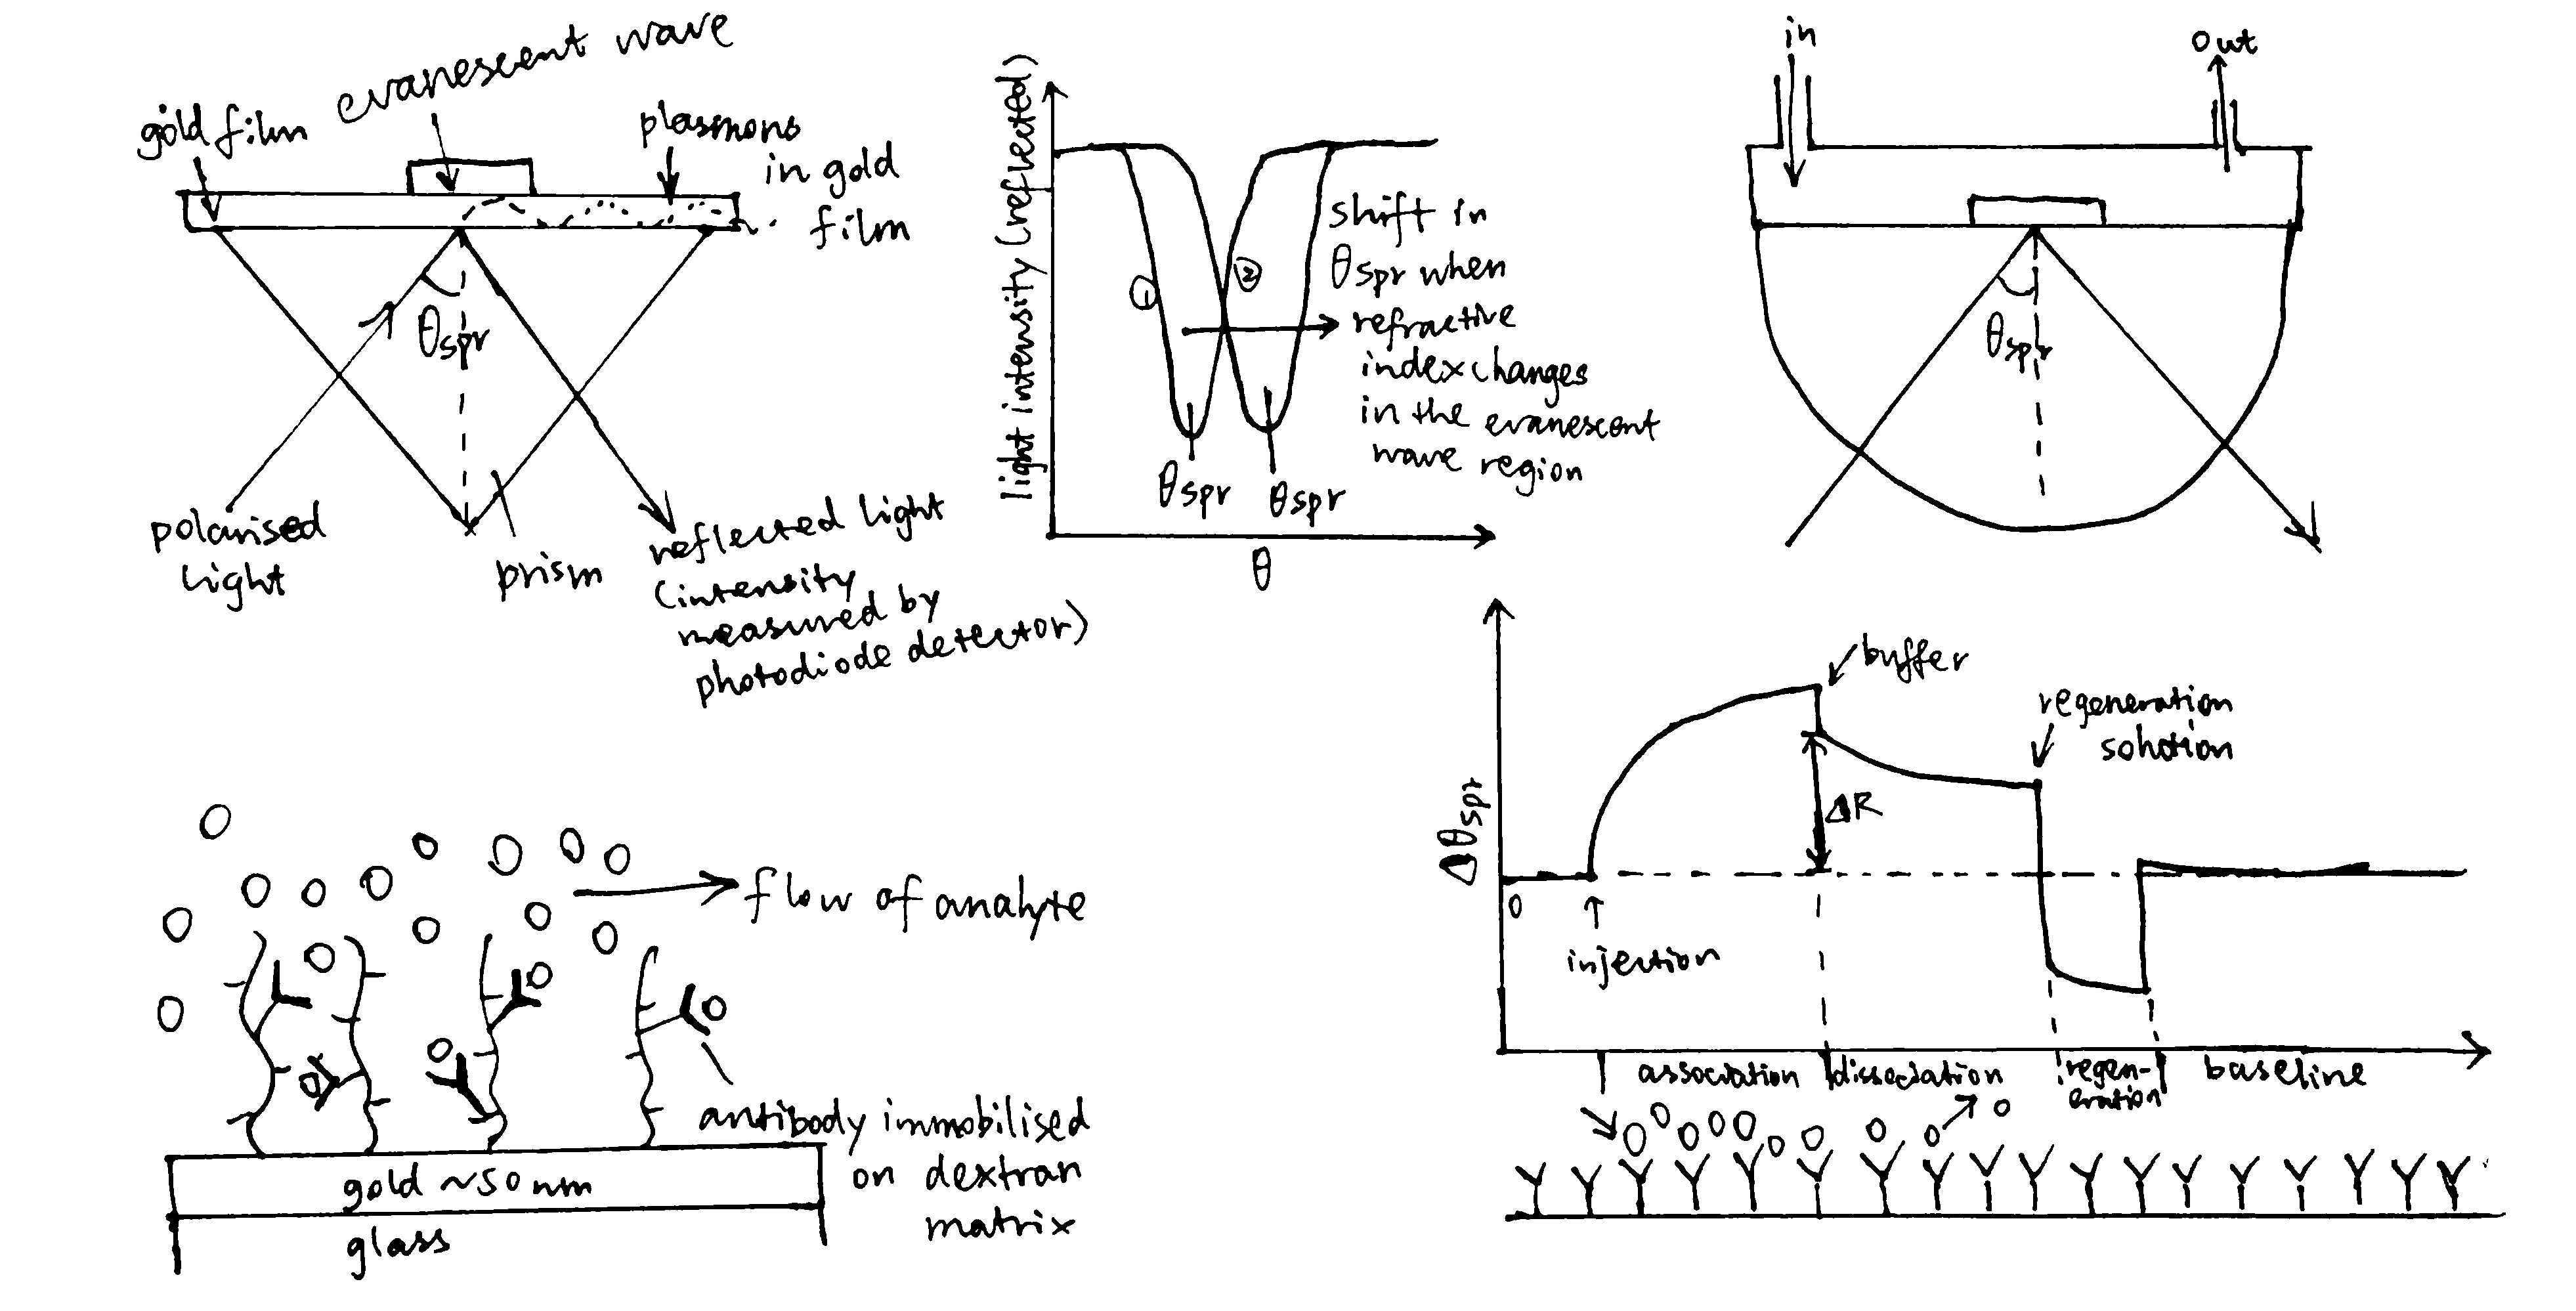
Figure 3.1: A surface plasmon is an electron oscillation generated at a surface interface between a metal and a dielectric. A plasmon resonance occurs when EM wave in visible light couples optimally with the oscillating electrons in the metal, and this results in a maximal reduction in the reflected light intensity. The resonance angle, \(\theta_\text{spr}\), is found by changing the angle of incidence of the light beam, giving a dip in a plot of intensity against angle. \(\Delta\theta_\text{spr}\) is sensitive to changes in the refractive index of the medium near the metal surface and this is a measure of the mass change at the sensor surface (in the evanescent region). In an SPR experiment, the protein acting as the “bait” is immobilised on the sensor surface, and a the analyte containing the other protein (acting as the “prey”) is passed through the cell. If binding occurs between the two proteins, \(\Delta\theta_\text{spr}\) would increase. Then, non-specific binding is washed off by buffer, and \(\Delta\theta_\text{spr}\) would decrease and \(\Delta\theta_\text{spr}\). Finally, regeneration solution is applied to remove all binding and reset \(\Delta\theta_\text{spr}\) to zero.
\[\begin{equation} \begin{split} \overbrace{k_{\text{on}}\text{[A][B]}}^\text{rate of association} & = \overbrace{k_{\text{off}}\text{[AB]}}^\text{rate of dissociation} \\ k_{\text{on}}\text{[A]([B]}_{\text{max}}-\text{[AB])} & = k_{\text{off}}\text{[AB]} \\ \text{[AB]} & = \dfrac{k_{\text{on}}\text{[A][B]}_{\text{max}}}{k_{\text{on}}\text{[A]} + k_{\text{off}}} \\ \text{[AB]} & = \dfrac{\text{[A][B]}_{\text{max}}}{\text{[A]} + K_{\text{d}}} \end{split} \tag{3.1} \end{equation}\]
In the equation, A is the protein in the analyte, whose concentration is kept constant, and B is the immobilised protein. Since the \(\Delta\theta_\text{spr} \propto \text{[AB]}\) (intensity of the signal is proportional to concentration of protein-protein complexes), we can work out \(K_\text{d}\) from our initial concentrations of A and B.
SPR was used in the early kinetic analysis of hGH binding (Wells (1996)).
3.1.2 Fluorescence anisotropy
Fluorescence anisotropy is based on the phenomenon that, if fluorophores are excited with plane polarized light and the fluorescence is observed through analyzing polarizers, the fluorescence is also polarised.
The fluorescence anisotropy is defined as \(A=\dfrac{I_\parallel - I_\bot}{I_\parallel+2_{\bot}}\), where \(I_\parallel\) and \(I_{\bot}\) are the fluorescence intensities polarised parallel and perpendicular to the direction of the excitation beam. \(A\) is a direct measure of the molecular rotation in solution and can be used to study complex formation, as a macromolecule will rotate more slowly when it is in a complex thatn when it is alone.
Fluorescence anisotropy is more accurate than SPR for measuring ultra-high affinity interactions, and were used to to study ColE DNase-Im interactions (Papadakos, Wojdyla, and Kleanthous (2012)).
3.1.3 Isothermal titration calorimetry (ITC)
ITC measures heat changes when a complex is formed at constant temperature. In ITC, an insulated reaction cell containing protein is kept at a temperature (usually 8\(^\circ\text{C}\) above the environment) which is equal to the temperature of a reference cell, and the reference cell is kept at a constant temperature by a thermostat. Then, increasing amounts of ligand is added into the chamber, and they form complexes with the protein, which can be exothermic or endothermic. The heat change is compensated by a power supply, which can be converted to \(\Delta H\) of the reaction. As more ligands are added, proteins become saturated and \(\Delta H\) approaches zero. The raw data obtained (power supplied to compensate the heat change caused by each addition of ligands) can be integrated and corrected to give a plot of \(\Delta H\) against the molar ratio of the ligand and the protein, and \(\Delta H\), Kd and stoichiometry can be inferred from the curve (Figure 3.2).

Figure 3.2: ITC data manipulation
3.2 Mechanistic Studies
The main theme of mechanistic studies is to find out the “hotspot” residues or regions that are main contributors to the affnity of PPI interfaces, and to attempt to generalise this knowledge in order to predict the affnity of any given PPI interfaces.
3.2.1 Alanine Scanning
Alanine scanning is a mutagenesis technique in which mutants are made by substituting alanine for each of the residues in a ‘reactive region’, in this case the PPI interface. By comparing the PPI affininy of each mutant to the wild type (i.e. calculating \(\Delta \Delta G\)), the contribution of each residue in binding can be assessed, and this reveals “hotspots” representing important residues.
3.2.2 Extent of Exchengeability of Amino Acids
Mutational analysis is most often restricted to alanine substitution and this does not provide an comprehensive view of the allowed amino acid space at each position. This limitation is especially significant in the analysis of PPI interfaces, which, unlike enzyme active sites, the specific orientation and chemical reactivity are less important.
Pál et al. (2006) introduced any one of the 20 natrual amino acids at all 35 hGH-hGHR binding interface positions and obtained surprising results. They verified that, the interface was highly adaptable to mutations, either from a structural or functional point of view. Whereas some of the alanine scanning hotspots showed high specificity agianst substitution, others did not, and some highly specific positions were not hotspots at all.
3.2.3 Directed Evolution
Directed evolution is an efficient approach to probe sequence and structure space in a PPI. Phage display is a specific implementation of it.
The phage display technique is summarised as follows and illustrated in Figure 3.3:
- Generate a randomised library of mutants. This can be done using error-prone PCR (ep-PCR). In PPI studies usually the randomised mutations are generated only across small sections of protein sequence that are form of the PPI interface.
- The randomised mutant DNA are ligated with a phage coat protein gene and the hybrid is then used to transduce E. coli. cells.
- The phage library is amplified by E. coli. cells, and phage particles are produced.
- The “bait” protein is immobilised, and the mixture of phage particles displaying different mutant proteins are added. Then, those with low binding affinity are washes away, and the remaining phages and collected, amplified, and used in the next round of selection.
- Repeated cycles of selection (a.k.a. “panning”) will identify the mutant proteins with the highest binding affinity to the “bait” protein. The complexes formed by these proteins with the “bait” protein can then be used for detailed mechanistic studies of PPI.
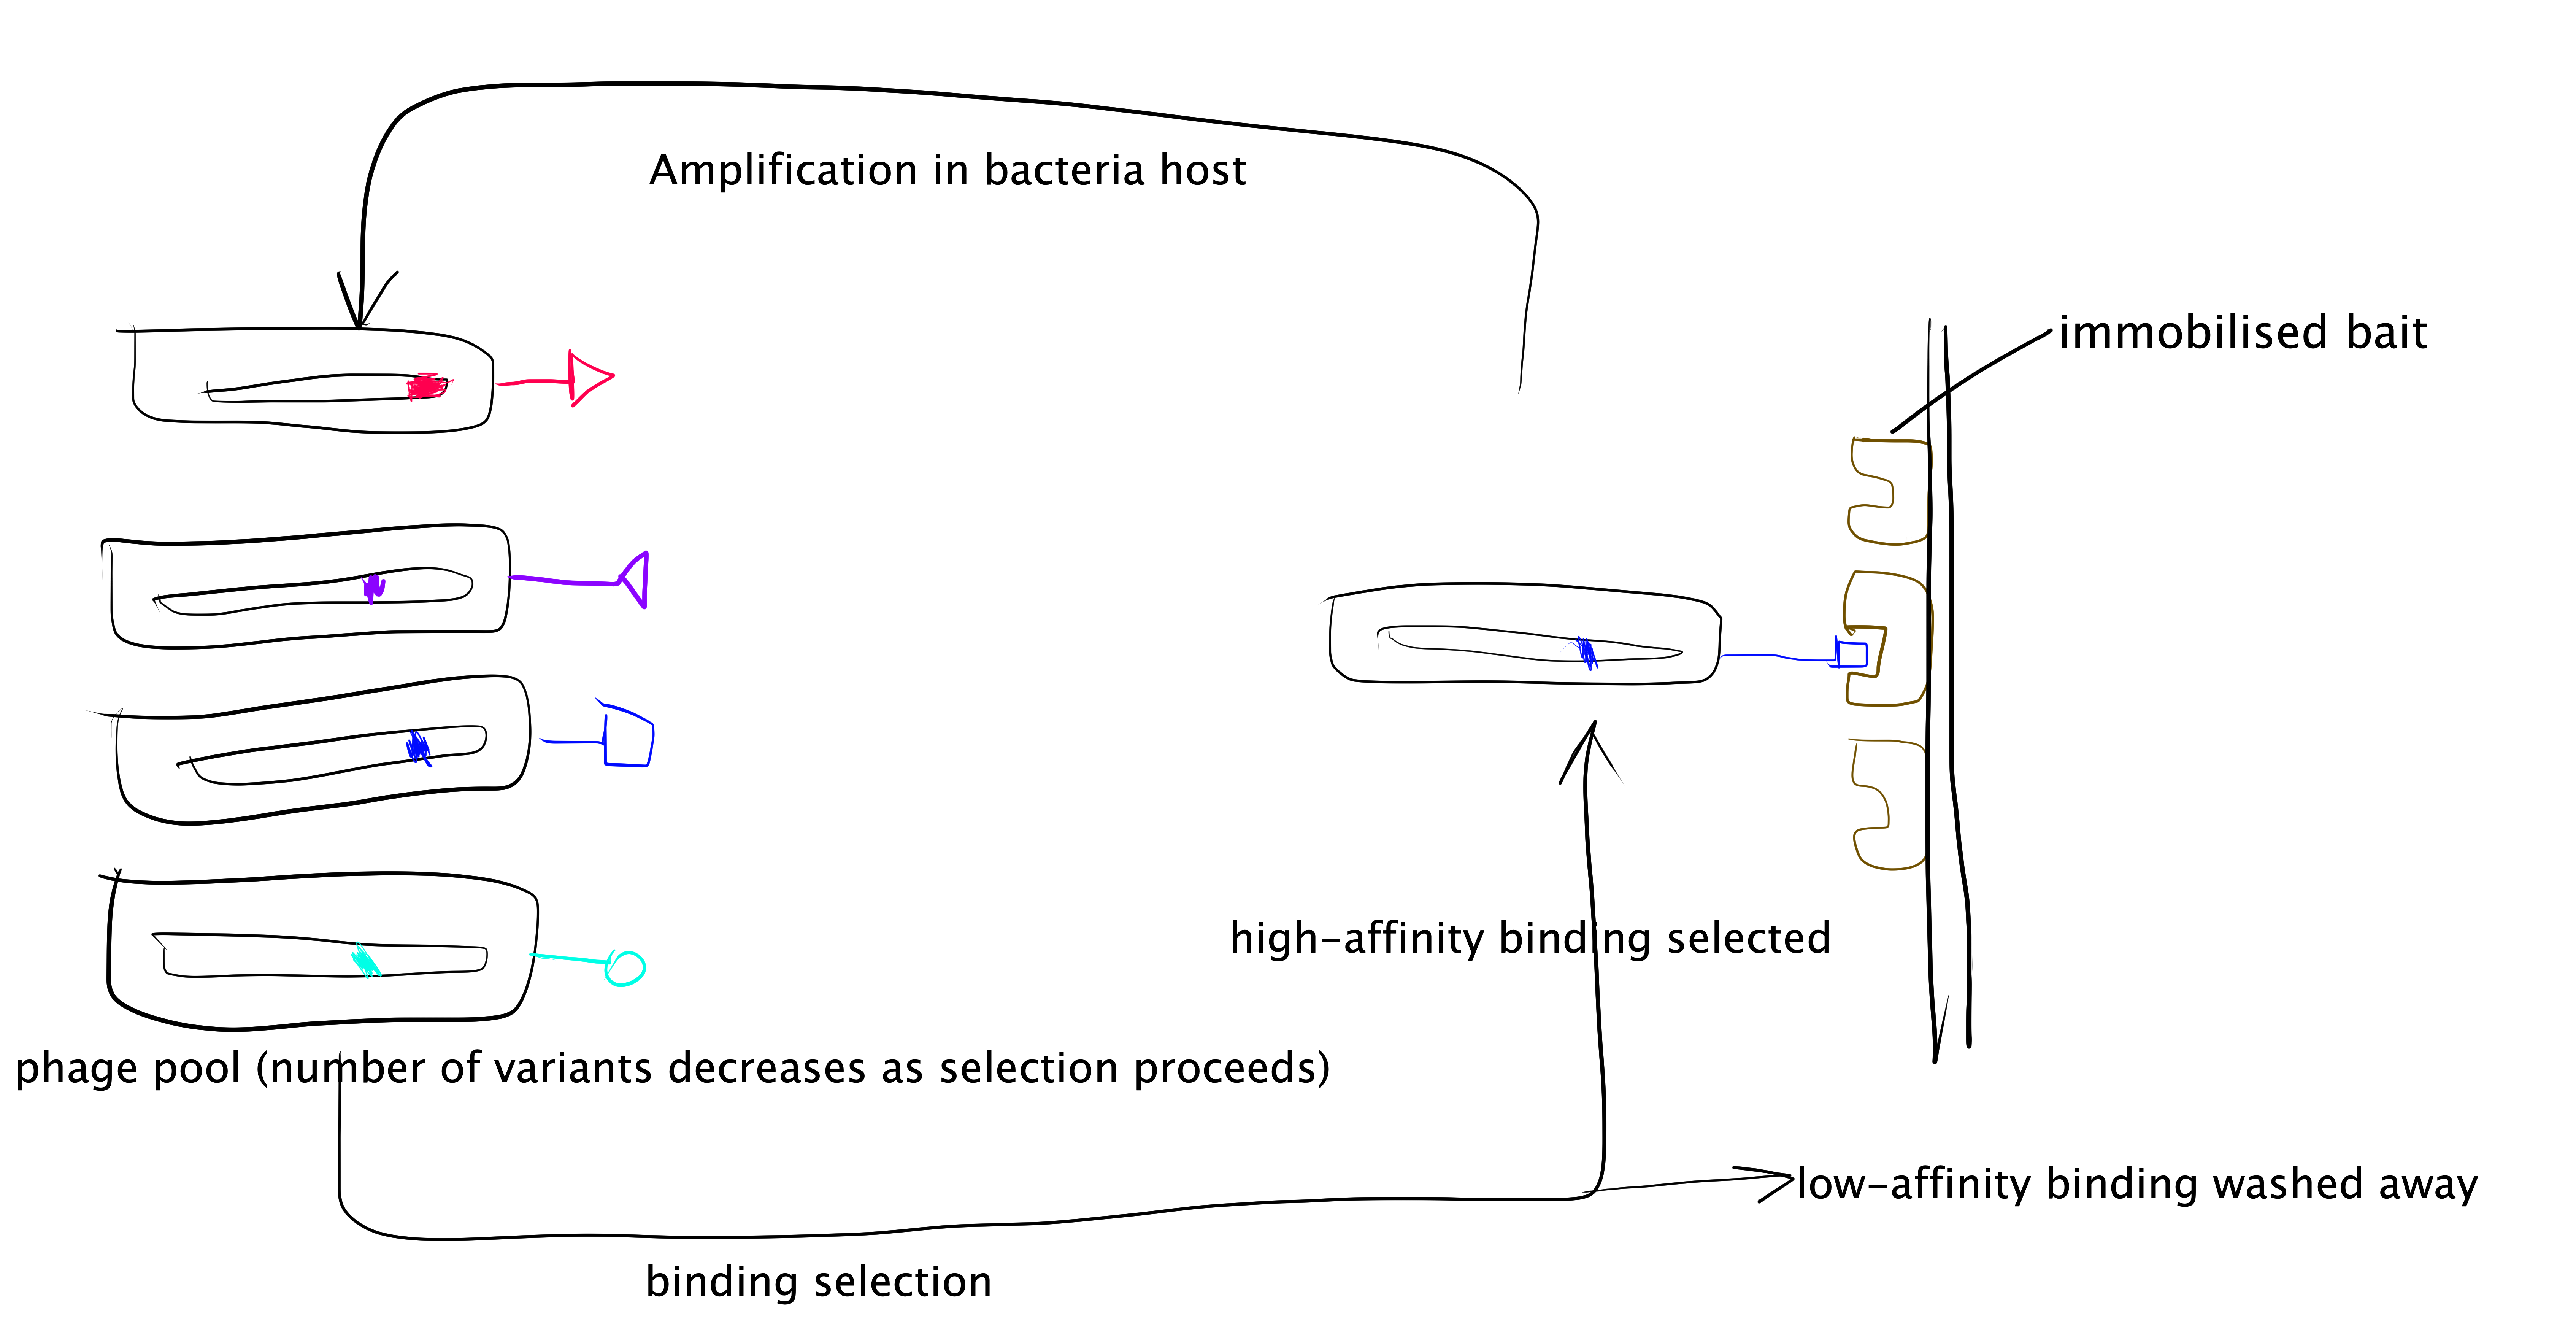
Figure 3.3: Directed evolution with phage display.
3.2.4 Computational Approaches
Computational methods can speed up the quest for high-affinity PPIs. These methods are based on rotamer libraries, which summarise the existing knowledge of the experimentally determined structures quantitatively. Rotamers are picked from the library (hotspot constraints may be applied) and grafted onto the scaffold of known structure, then the fitness is assessed using a scoring function, which unfortunately often fails to predict the actual experimental results. As the number rotamers in the library grows and algorithms improve, computational methods are expected to provide more accurate predictions.
3.2.5 Connectivity Map Reveals Modularity
Reichmann et al. (2005) analysed the TEM1–BLIP complex by drawing a connectivity map, which is build from the physical interactions between the proteins (hydrogen bonds, van der Waals interactions, etc.), and showed that the interface can be divided into 6 clusters. The change \(\Delta \Delta G\) on different clusters was found to be additive, whereas mutations within the same cluster caused complex energetic and structural consequences. Therefore, a PPI interface can be seen as a group of “hot regions”, where each region contribute relatively independently to the total binding affinity, but within each region the contributions from its component amino acids are cooperative.
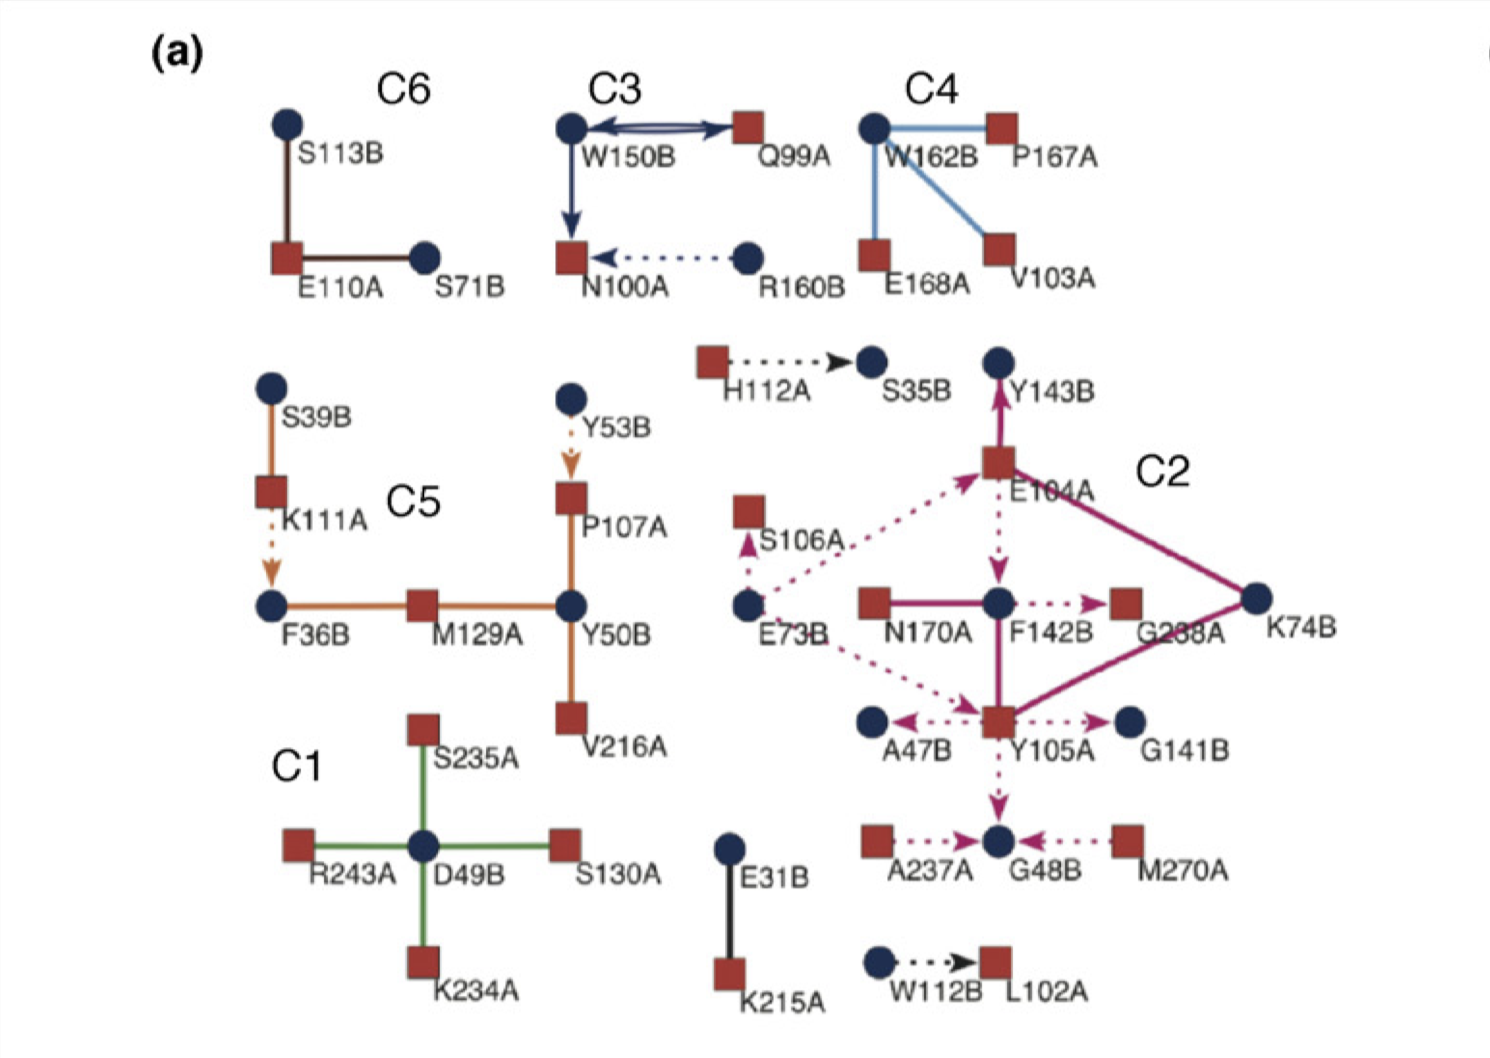
Figure 3.4: Connectivity map of the TEM1–BLIP complex.
3.2.6 X-Ray Crystallography
X-ray crystallography (XRC) studies provide structural basis for PPI interfaces, which not only facilitates the analysis of individual cases but also help to improve the scoring algorithms for computational methods.
Crystallisation tends to be difficult for low affnity PPIs due to their unstable nature. To overcome this, correctly positioned cysteines can be introduced into each of the binding partners at the interface, which could stabilise the complex, facilitating crystallisation. This technique is known as “disulfide trapping”.
4 Why Designing Small Molecule PPI Inhibitors is Difficult
PPI interfaces are usually large and flat (Section 2.2), and often tolerent to a small number of mutations (Section 3.2.2). Thus, the “druggable” targets are usually restricted to the local non-flat regions (i.e. ‘pockets’) on PPI interfaces that are enriched with “hotspot” residues. A large surface area of PPI interface, which is more tolerent to local non-favourable interactions, also makes developing inhibitors more difficult. In addition, in the case of developing non-peptide inhibitors, there is less existing knowledge on the structures of small molecules and their interactions with proteins, meaning the computational modelling is less accurate.
References
Arkin, Michelle R, Yinyan Tang, and James A Wells. 2014. “Small-Molecule Inhibitors of Protein-Protein Interactions: Progressing Toward the Reality.” Chem Biol 21 (9): 1102–14. https://doi.org/10.1016/j.chembiol.2014.09.001.
Keeble, Anthony H, and Colin Kleanthous. 2005. “The Kinetic Basis for Dual Recognition in Colicin Endonuclease-Immunity Protein Complexes.” J Mol Biol 352 (3): 656–71. https://doi.org/10.1016/j.jmb.2005.07.035.
Papadakos, Grigorios, Justyna A. Wojdyla, and Colin Kleanthous. 2012. “Nuclease Colicins and Their Immunity Proteins.” Quarterly Reviews of Biophysics 45 (1): 57–103. https://doi.org/10.1017/S0033583511000114.
Pál, Gábor, Jean-Louis K Kouadio, Dean R Artis, Anthony A Kossiakoff, and Sachdev S Sidhu. 2006. “Comprehensive and Quantitative Mapping of Energy Landscapes for Protein-Protein Interactions by Rapid Combinatorial Scanning.” J Biol Chem 281 (31): 22378–85. https://doi.org/10.1074/jbc.M603826200.
Reichmann, D, O Rahat, S Albeck, R Meged, O Dym, and G Schreiber. 2005. “The Modular Architecture of Protein-Protein Binding Interfaces.” Proc Natl Acad Sci U S A 102 (1): 57–62. https://doi.org/10.1073/pnas.0407280102.
Wells, J A. 1996. “Binding in the Growth Hormone Receptor Complex.” Proceedings of the National Academy of Sciences 93 (1): 1–6. https://doi.org/10.1073/pnas.93.1.1.
Wienken, Christoph J., Philipp Baaske, Ulrich Rothbauer, Dieter Braun, and Stefan Duhr. 2010. “Protein-Binding Assays in Biological Liquids Using Microscale Thermophoresis.” Nature Communications 1 (1): 100. https://doi.org/10.1038/ncomms1093.
1 Introduction
Many proteins that perform vital functions are membrane proteins. These include transport proteins (channels, transporters and pumps), cell adhesion molecules, and proteins that transduces energy in the electron transport chain. Despite their diverse roles, the same set of biophysical and biochemical rules govern their structural stability. Membrane proteins fall into two broad categories: 1) integeral proteins, which are embedded within a membrane and can only be isolated with detergents, and 2) peripheral proteins, which are associated with the surface of a membrane and can be removed without detergents. The focus of this essay is on how integral proteins interact with the membrane to maintain their structural stability.
2 The Biomembrane Environment
The basic structure of a biomembrane is a bilayer of amphipathic phospholipids and sphingolipids, where the polar head groups of lipids align the surfaces (each ~10 angstroms thick) and the acyl chains of lipid tails occupy the hydrophobic core (~ 30 angstroms thick). A bitopic or polytopic integral membrane protein spans the membrane entirely one or more times (Figure 2.1).
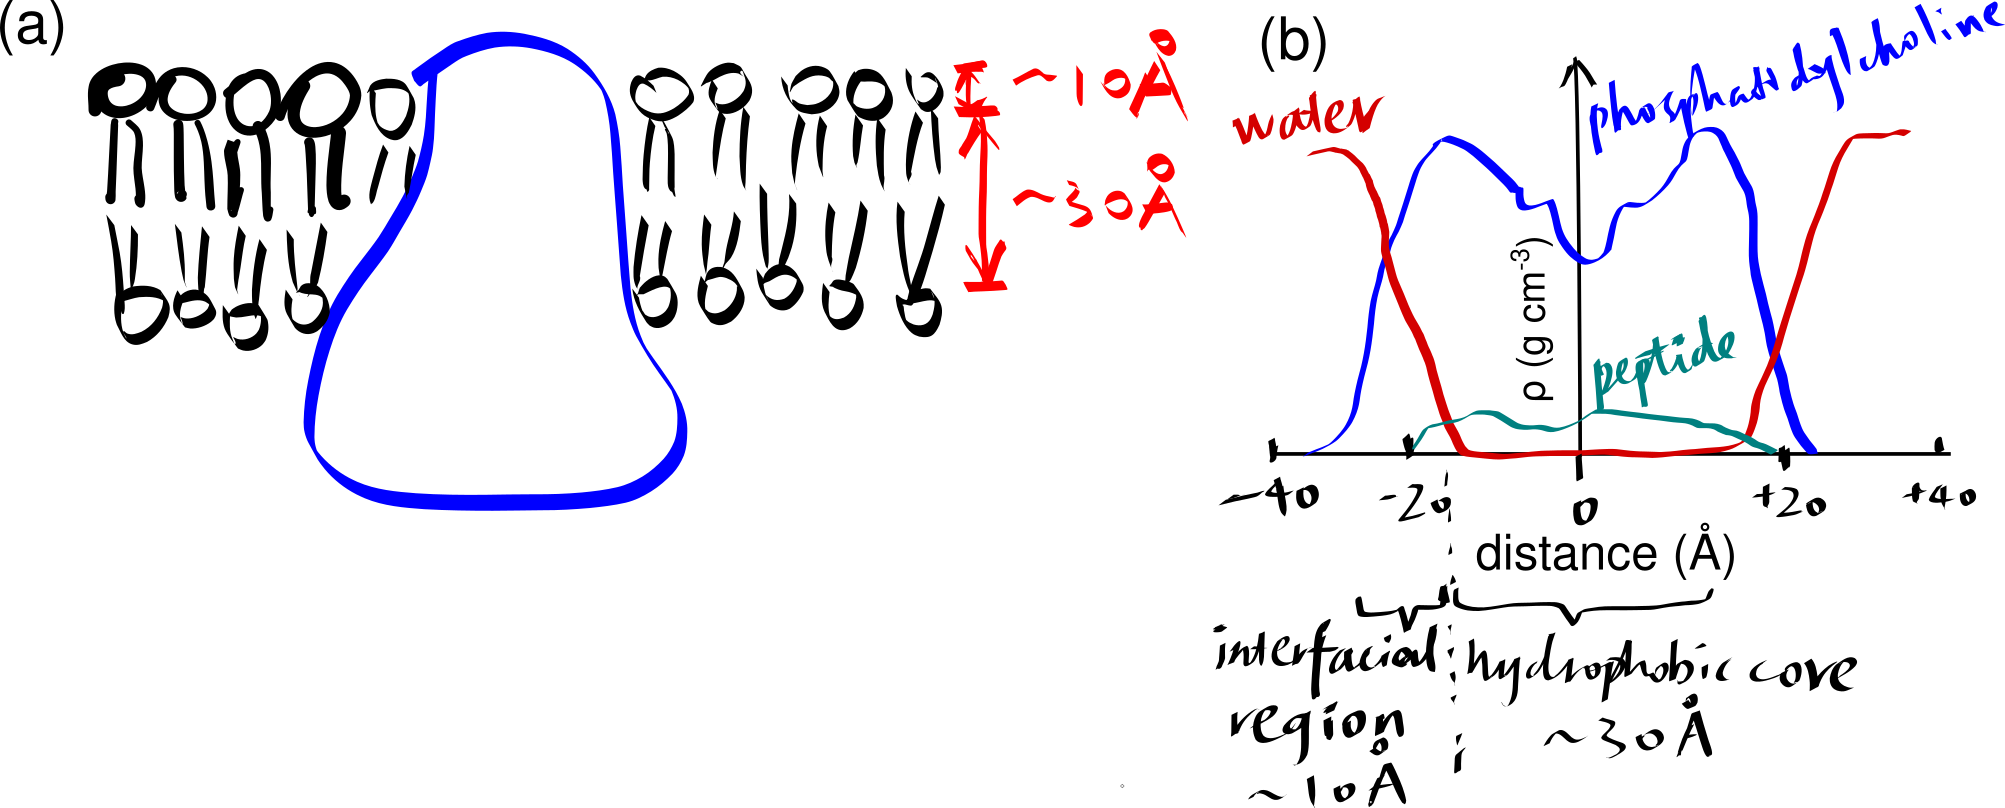
Figure 2.1: (a) a schematic showing a integral protein embedded within a biomembrane. (b)
The hydrophobic core region has a dielectric constant (\(\epsilon_{r}\)) of about 2, which is much lower than \(\epsilon_{r}\) of water (about 80), which means the same pair of charges separated by the same distance experience more electrostatic force in the membrane core than in water, according to the Coulomb’s law:
\[F = \dfrac{q_1 q_2}{4\pi \epsilon_0 \epsilon_r r^2}\]
This has several implications on acidic and basic amino acid residues. First, the carboxyl group of acidic side chains are more difficult to dissociate (i.e. p\(K_a\)s are shifted up), meaning they tend to remain in the uncharged (–COOH) form. Second, in \(\alpha\)-helical bundles, oppositely charged residues in adjacent helices associated more strongly than they do in aqueous environment. Third, this facilitates the snorkelling of lysine and arginine residues near the interface (Section 5).
3 The Thermodynamic Basis of Secondary Structure Formation
Transmembrane proteins tend to adopt a conformation that minimises the contact between their polar groups (main chain -NH, C=O, and side chains of polar residues, if any) and the hydrophobic core. This can be explained by simple thermodynamic reasoning. The water molecules in the aqueous environment outside the membrane are capable of forming relatively strong dipole-dipole interactions and hydrogen bonds (H-bonds) with polar (including charged) amino acids, while the non-polar alkyl groups that occupy the hydrophobic core of the membrane can only provide weak van der Waals interactions. Thus, if a protein adopts a conformation that exposes many polar groups, the loss of strong interactions with water will make this process very energetically unfavourable (very large \(\Delta G\)). On the contrary, if a protein with a hydrophobic surface were present in an aqueous environment, it would disrupt the dipole-dipole interactions and hydrogen bonding among water and other polar molecules. Thus, its insertion into the membrane is energetically favourable.
By forming either an \(\alpha\)-helix or a \(\beta\)-sheet (Figure 3.1), the hydrogen bonds between main chain -NH and -C=O are maximised, and this is an efficient way to shield the polar groups on the main chain from the hydrophobic core. Many transmembrane proteins, such as bacteriorhodopsin, contain multiple TM helices, which aggregates to form a \(\alpha\)-helix bundle. A \(\beta\)-sheet has to twist and coil to form a ring, called a \(\beta\)-barrel, in order to shield the main chain -NH and C=O groups on the first and last strands. \(\beta\)-barrels usually have a even number of strands so that every strand is anti-parallel to adjacent strands, there are exceptions: the voltage-dependent anion channels (VDACs) located on mitochondrial outer membrane has 19 strands, where the first strand is parallel with tha last strand, with weaker hydrogen bonding. \(\beta\)-barrels are less common than \(\alpha\)-helix bundles, and they are predominantly present on the outer membrane of Gram-negative bacteria, mitochondria, and chloroplasts.
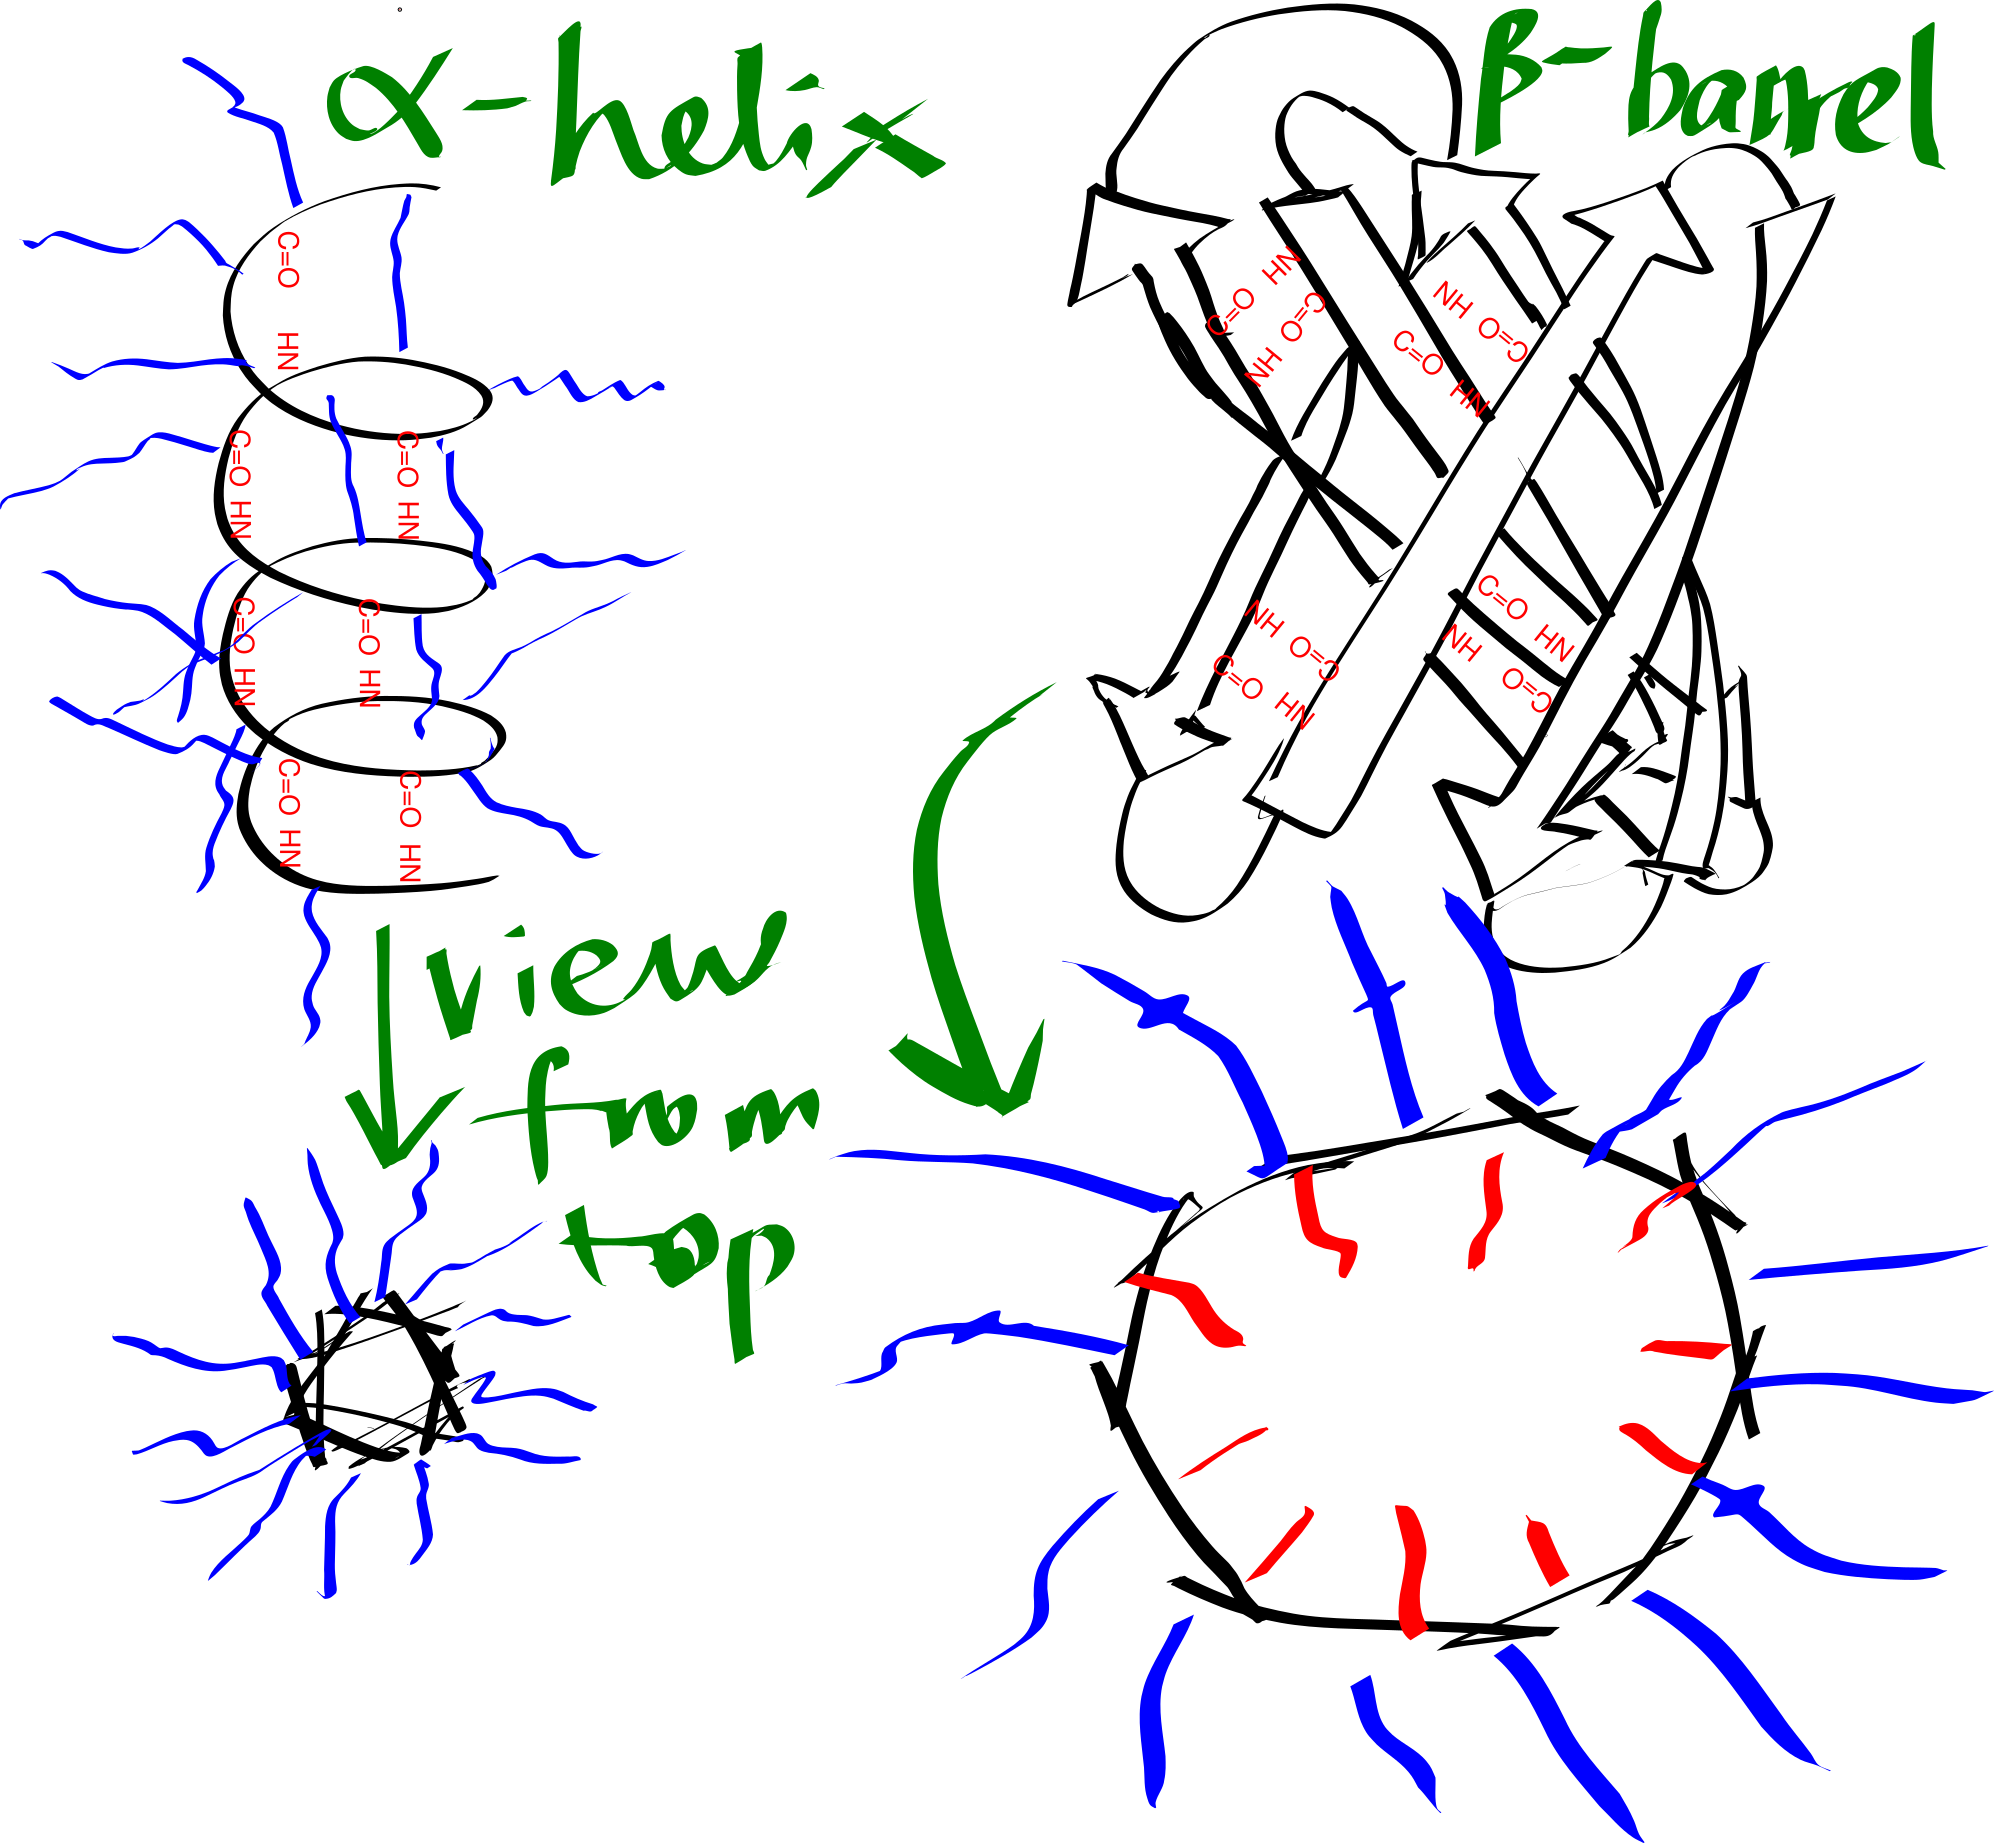
Figure 3.1: Schematic representation of an alpha helix and a beta barrel. Blue and red lines represent hydrophobic and hydrophilic side chains, respectively.
The transmembrane region of each helix in a \(\alpha\)-helical bundle is composed predominantly of hydrophobic amino acid residues (Ala, Leu, Ile, Val, Phe), which are exposed on the surface and allows favourable interaction with the hydrophobic core. By contrast, each \(\beta\)-strand of a \(\beta\)-barrel has an alternating pattern of hydrophobic and polar residues. This is because two adjacent residues in a beta strand have their side chains pointing in opposite directions, and a \(\beta\)-barrel formed in this way has an hydrophobic exterior that interacts with the hydrophobic core and an hydrophilic inner surface that is in contact with the aqueous environment.
Thus, TM helices, but not \(\beta\)-barrels, can be predicted using a hydropathy plot (Figure 3.2), in which the average hydrophobicity index of a fixed number of consecutive residues (a “window”), \(H(i)\), is plotted against the index (\(i\)) of the window, i.e.
\[H(i) = \sum_{i<j<i+k}h(a_j)/k\]
for \(1 < i < n - k\), where n is the length (number of residues) of the peptide, \(h(a_j)\) is the hydrophobicity index of the \(j\)-th amino acid residue and \(k\) is the window size.
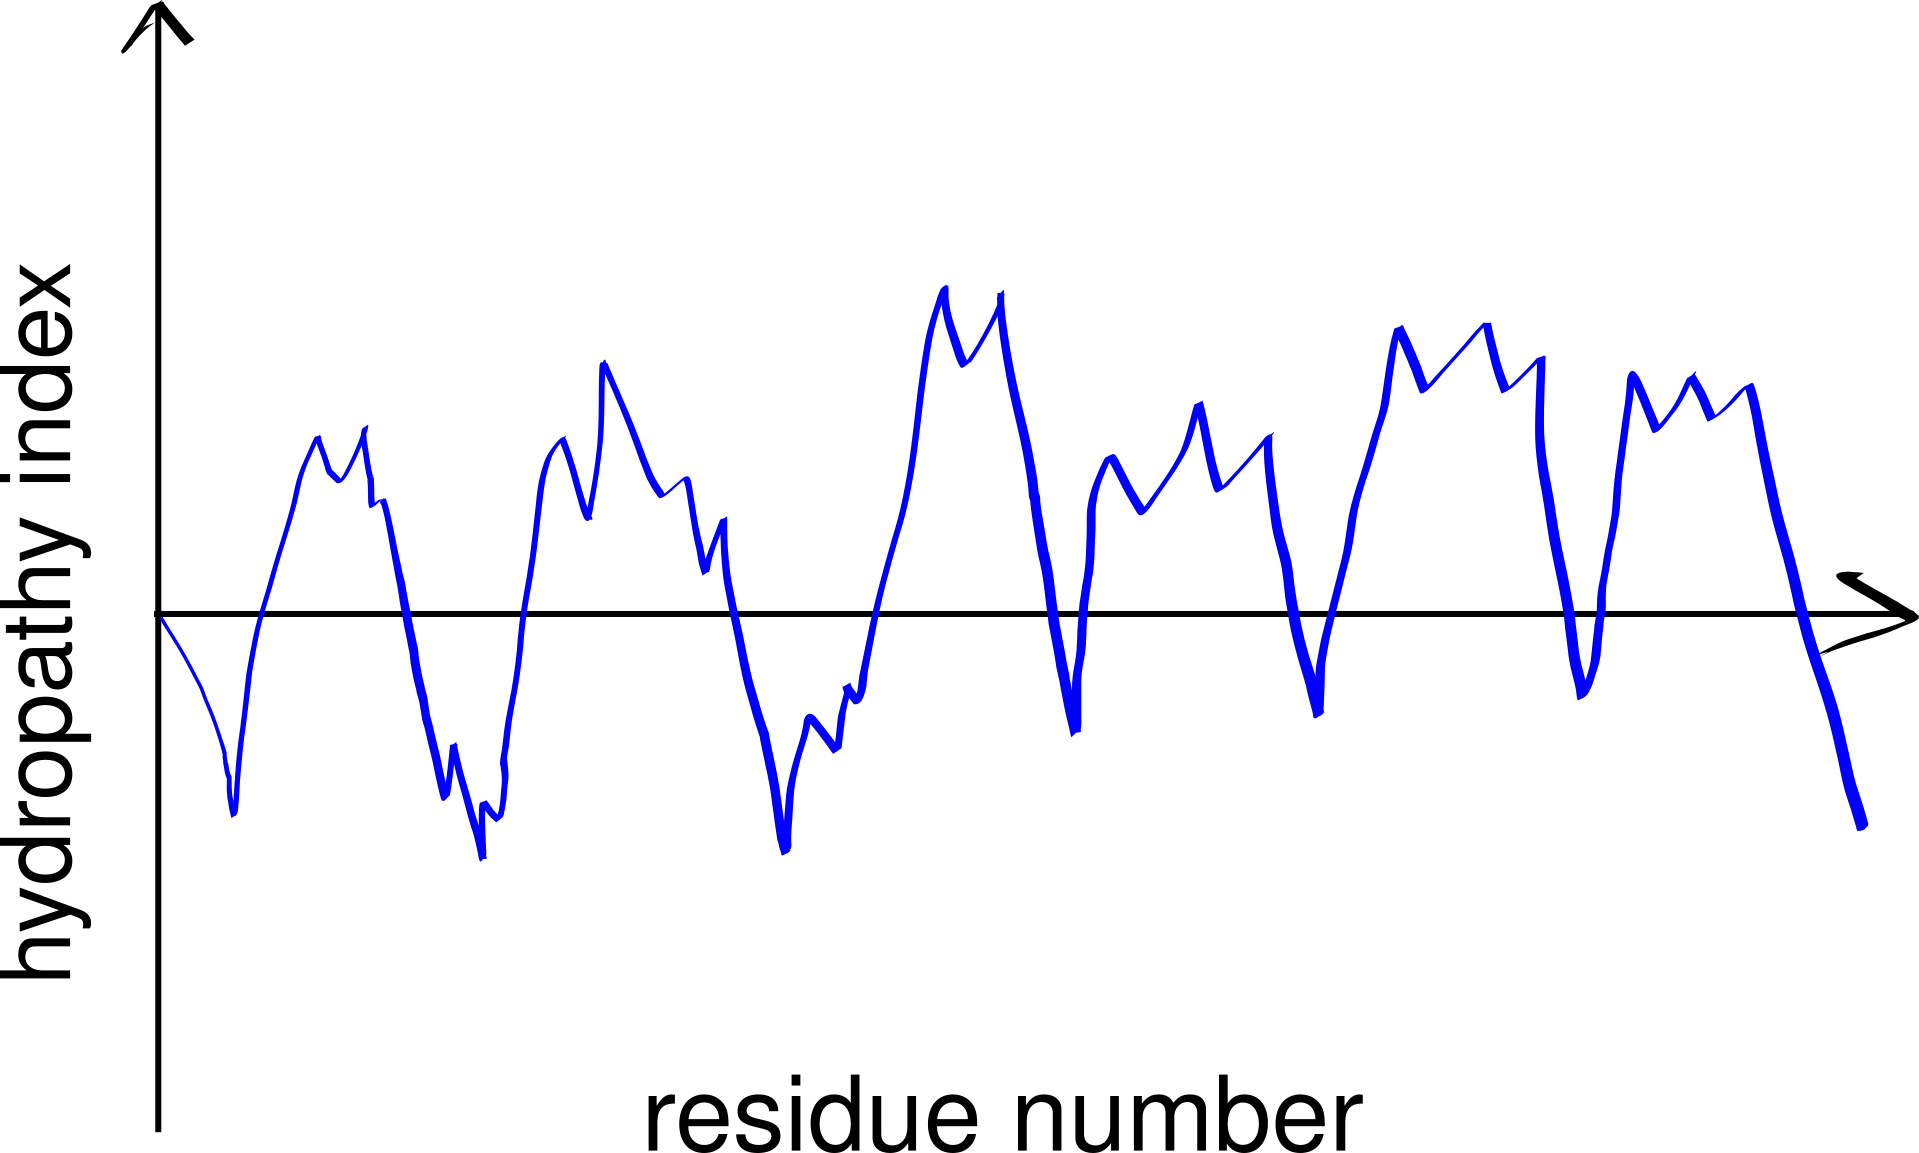
Figure 3.2: A schematic hydropathy plot. Every peak in the plot represents a highly hydrophobic local region in the peptide and thus indicates a potential transmembrane helix.
A small number of polar (even charged) residues within a TM helix can be tolerated as long as the overall transmembrane segment is hydrophobic enough. In addition, in polytopic proteins, polar residues in adjacent helices may help to stabilise each other. These non-hydrophobic residues often have functional roles, as exemplified by voltage-gated K+, Na+ and Ca2+ channels (Figure 3.3).
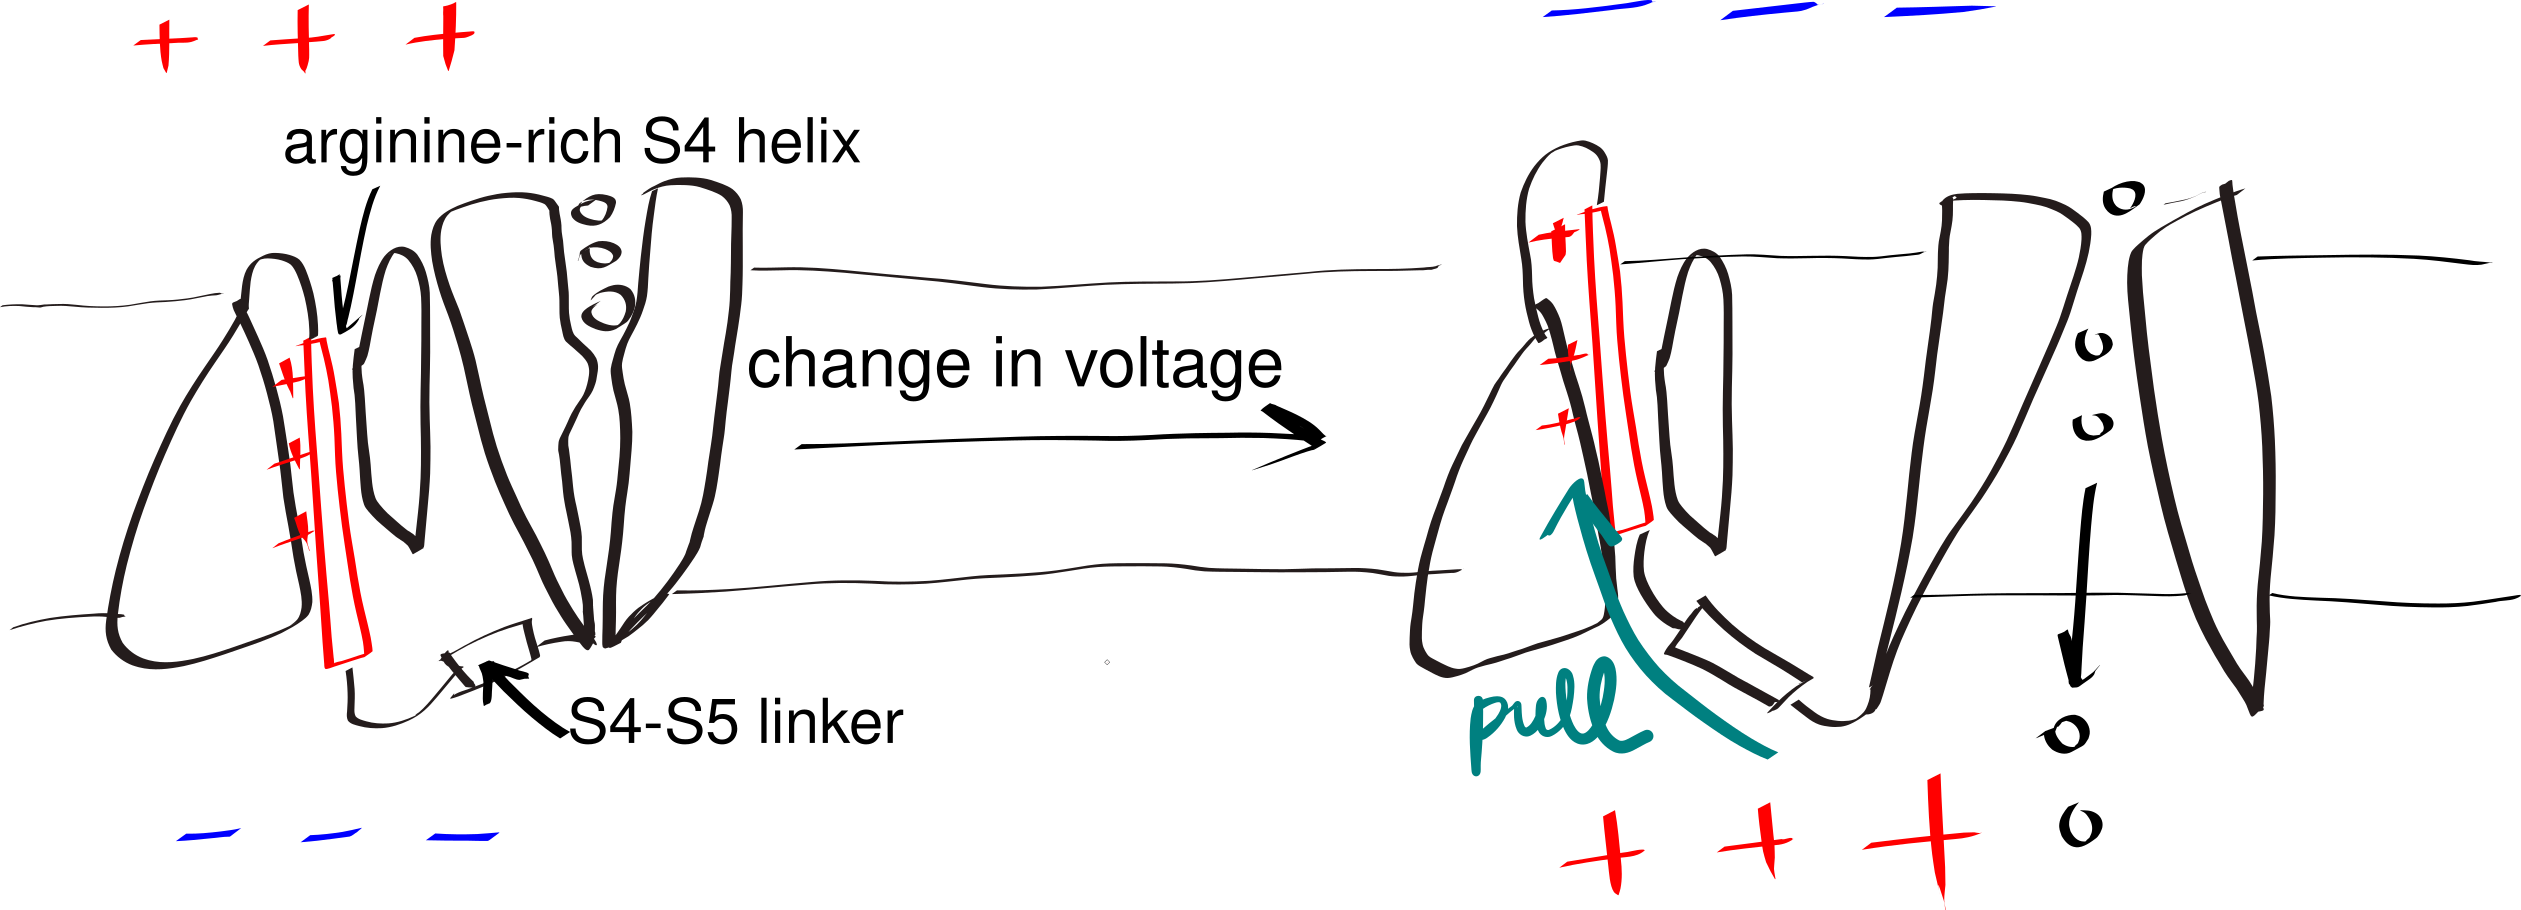
Figure 3.3: The gating mechanism of voltage-gated potassium channel. The S4 helix (red) is arginine-rich and thus positively charged. A linker connects S4 and S5 helix, the latter being a part of the pore domain. In resting state, the interior (bottom) of the cell is negatively charged relative to the exterior (top). A change in voltage causes the S4 helix to move upwards due to electrostatic force, and it pulls the gate open via the S4-S5 linker.
4 Glycine and Proline in TM Helices
The side chain of proline forms a pentameric ring with the amine group on the main chain. Thus, in a helix, the amine group of a proline does not have a hydrogen that can be H-bonded to the main chain C=O of the residue above it. This introduces local flexibility within a relatively regid helix and often forms a hinge. Similarly, due to glycine’s small size, it can tolerate a much wider range of dihedral angles than other amino acids, which also makes it able to introduce flexibility. This flexibility is crucial for the function of some proteins, such as voltage-gated ion channels (Figure 3.3).
5 Tryptophan and Tyrosine at the Interface and Lysine/Arginine Snorkelling
Tryptophan and tyrosine are often found in the interfacial region in both \(\alpha\)-helical bundle and \(\beta\)-barrel proteins. Their hydrophobic aromatic ring interacts with the hydrophobic core, and their polar -NH (of Trp) or -OH (of Tyr) groups interacts with the lipid head groups. Similarly, lysine and arginine extend their side chain towards the surface, so that their positively charged guanidium (of Arg) or amide (of Lys) groups form strong ionic interactions with the negatively charged lipid head groups. This phenomenon is known as “snorkelling.” These interactions helps to lock the membrane in place within the membrane, preventing vertical motions.
6 Interactions with Lipids
Membrane proteins interacts with lipid in various ways, and these interactions contribute to the structural stability and function of the protein to different extents.
A transmembrane protein interacts strongly with the shell (annulus) of lipid that surrounds it. These lipids are called annular lipids and can be distinguished experimentally from the bulk lipids of the bilayer. In addition, there is a third class of lipids, called nonannular lipids (or lipid cofactors), which are tightly bound in crevices or between subunits of the protein and are often crutial for the activity of the protein. Electron paramagnetic resonance (EPR) can be used to measure the mobility of annular lipids, and thus gives information on the selectivity for annular lipids of a protein. Most proteins are found to prefer negatively charged lipids such as phosphatidylserine and phosphatidylinositol.
Strong lipid-protein interactions are also evident form crystal structures, and this interaction can be specific. For example, three cardiolipin (CDL) molecules were found to bind to three sites on the ANT1 transporter. The tendency of CDL to bind to these sites can also be shown in molecular dynamics simulations. The specificity of this binding can also be shown computationally, by calculating the free energy at different protein-lipid separations for CDL and other lipids (Figure 6.1).
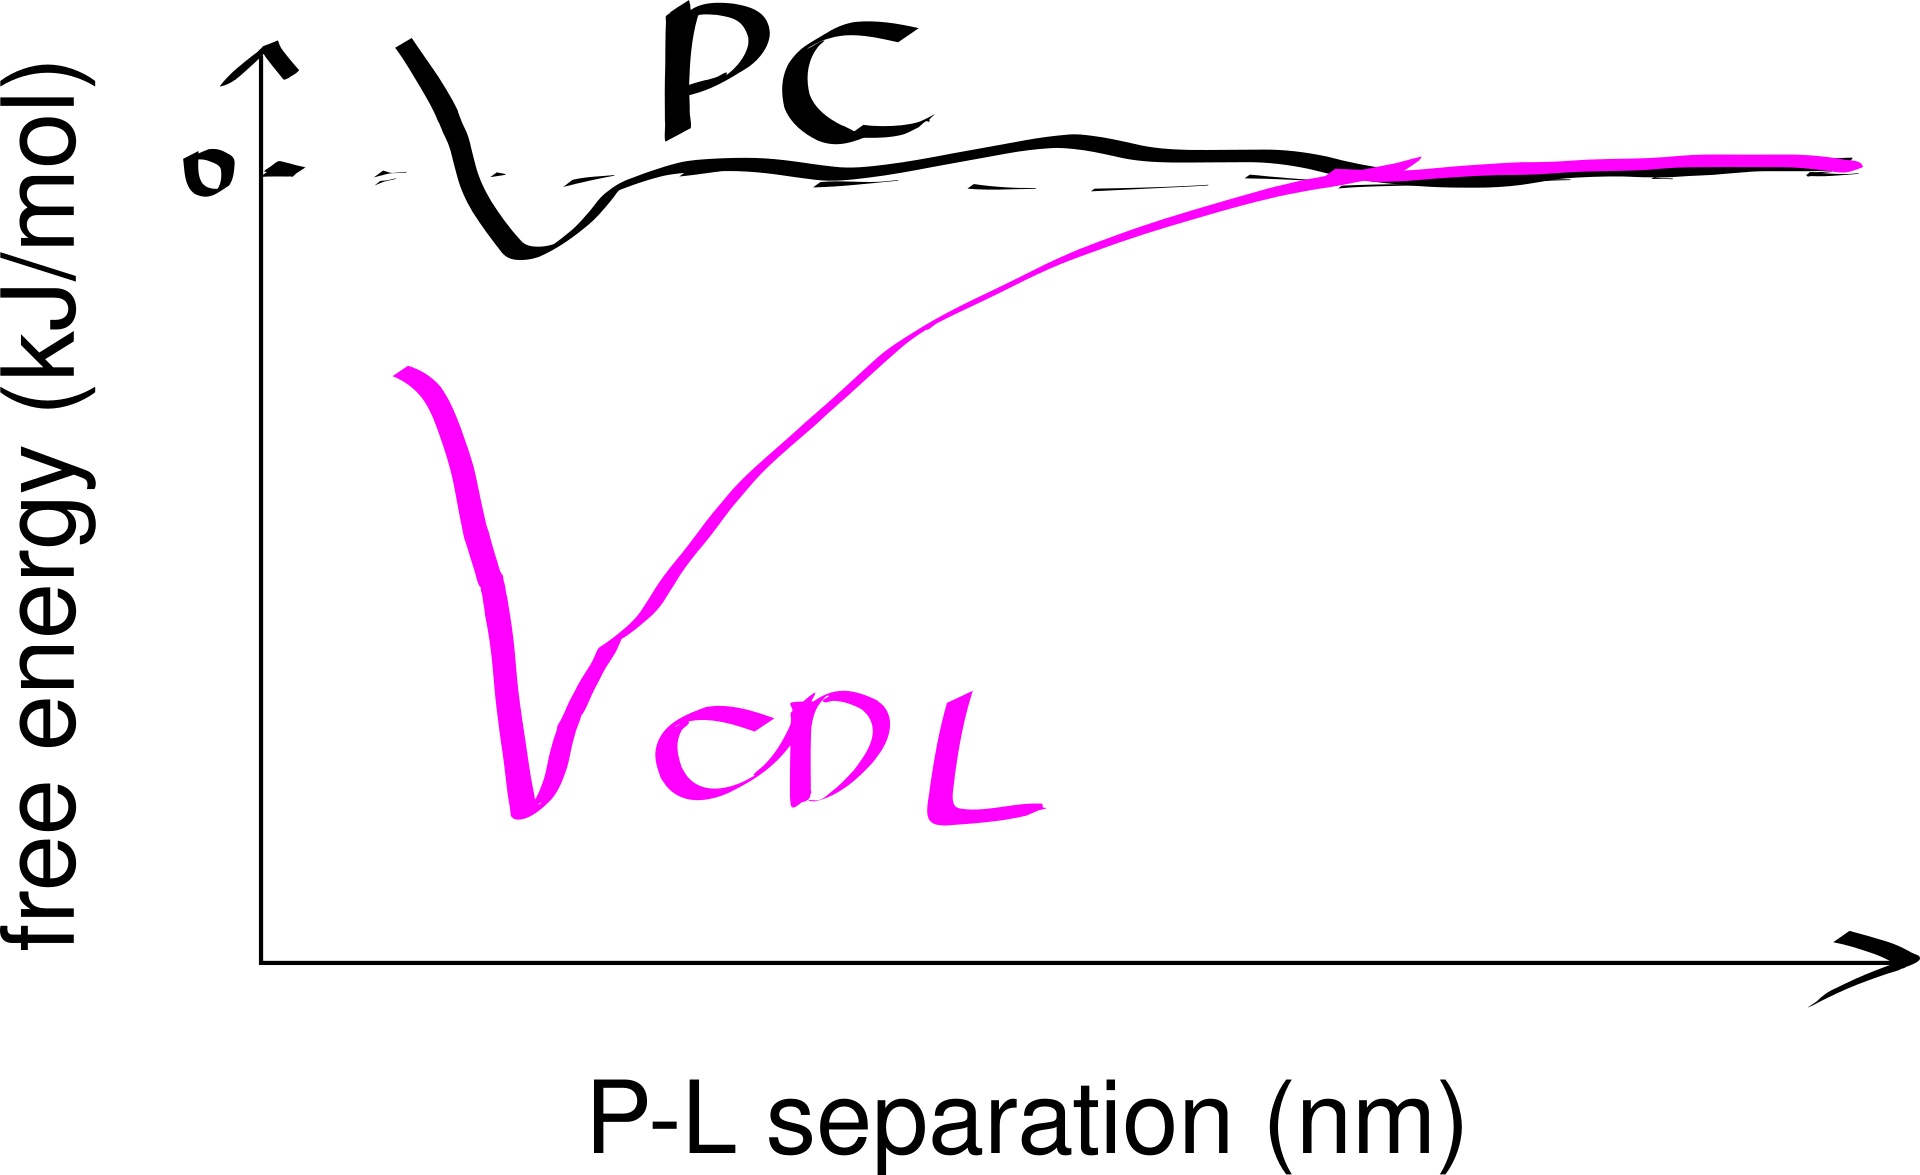
Figure 6.1: Computational analysis of a protein’s preference to bound lipids. CDL binding results in a significantly lower energy state.
Inward-rectifier K+ channels (Kir) are an example where the lipid-protein interaction is directly involved in the protein’s function. Kir have a Transmembrane domain (TMD) and an intracellular C-terminal domain (CTD). PIP2 binding cuases the CTD to move towards the TMD, which in turn causes the helices in the TMD to bend and thus opens the gate (Figure 6.2).
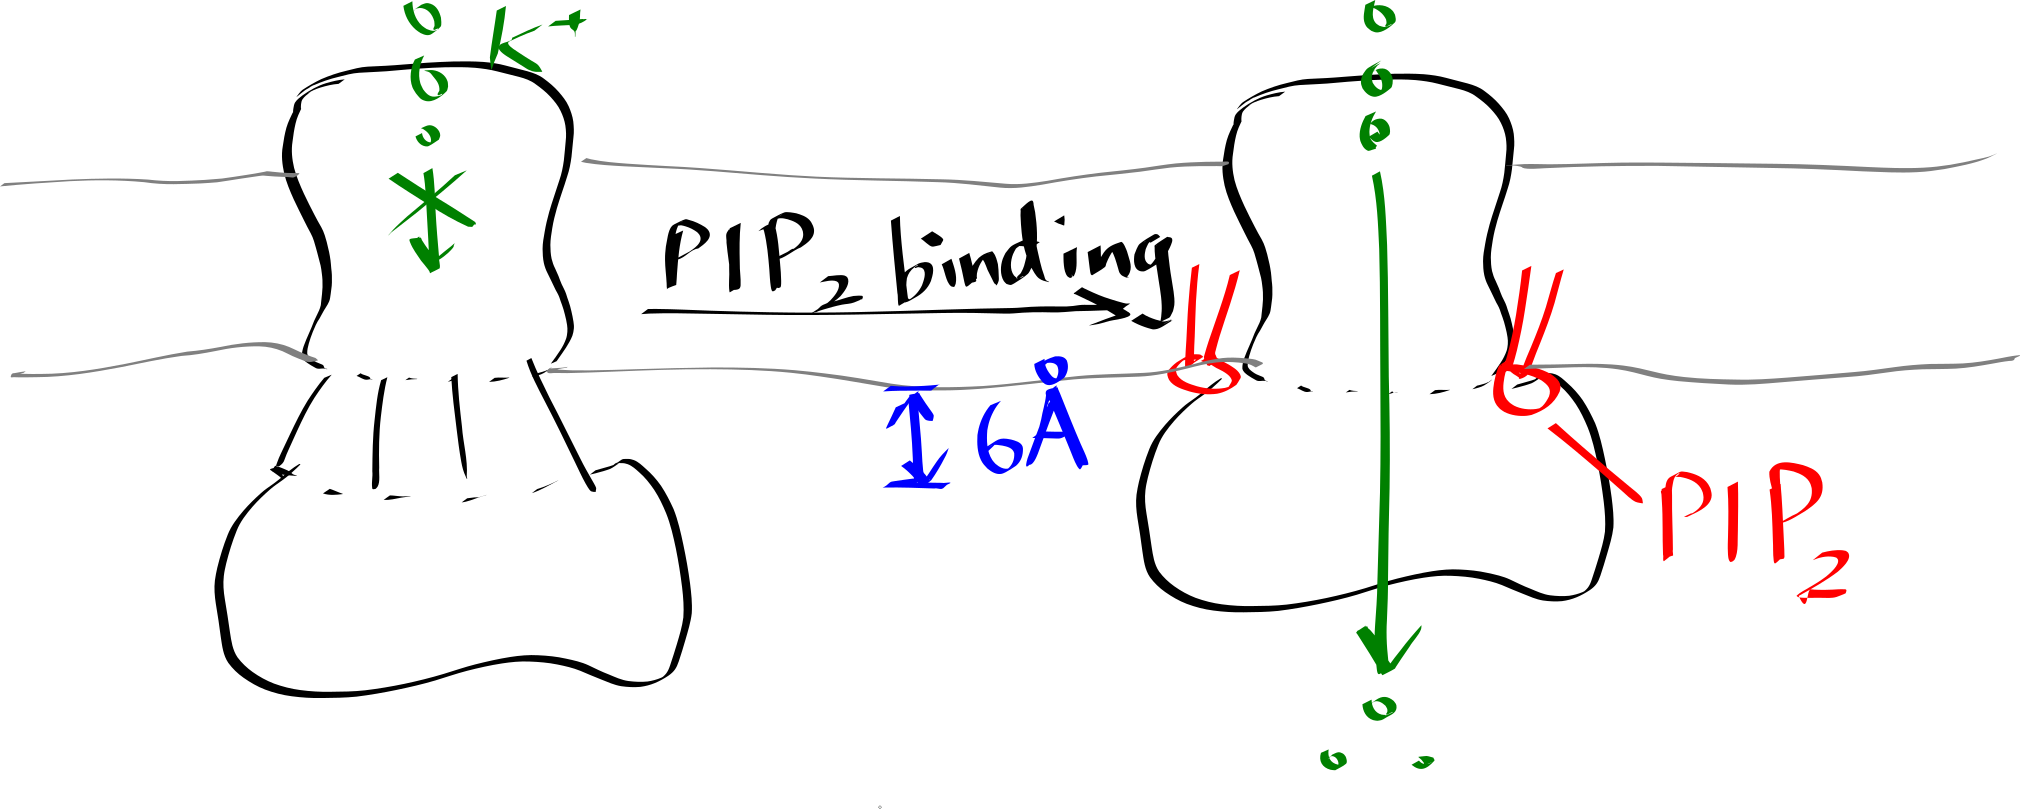
Figure 6.2: Lipid-gated Kir channel
Many crystal structures of GPCRs reveal cholesterol bound to the protein. Molecular dynamics simulations at different cholesterol concentrations suggests the role of cholesterol in reducing the dynamic flexibility the protein and stabilising a certain conformational state in an allosteric fashion.
Introduction
The Ca2+ selectivity of voltage-gated calcium (Cav) channels remained unclear. They were thought to use a ‘knock-off’ methanism which requires multiple ion-binding cores, but mutational analyses supported a single high-affinity Ca2+ binding site. This paradox is explained by the mechanism proposed in this article, based on the crystal structures of CavAb channels.
Methods
In this study, the authors created several mutants of bacterial Nav channel NavAb by site directed mutagenesis using QuickChange at the selectivity filter region1. Some of these mutations changes the activity of the channel from allowing efflux of Na+ to allowing influx of Ca2+ to different extents (quantified by the relative permeability of Ca2+ against Na+). Baculovirus were used as the vector to infect Trichopulsia ni cells. Proteins were collected from insect cells, purified, concentrated to ~20mg ml-1, and reconstituted into DMPC:CHAPSO bicelles (Figure 1). Crystals were grown in a hanging-drop vapour-diffusion format.
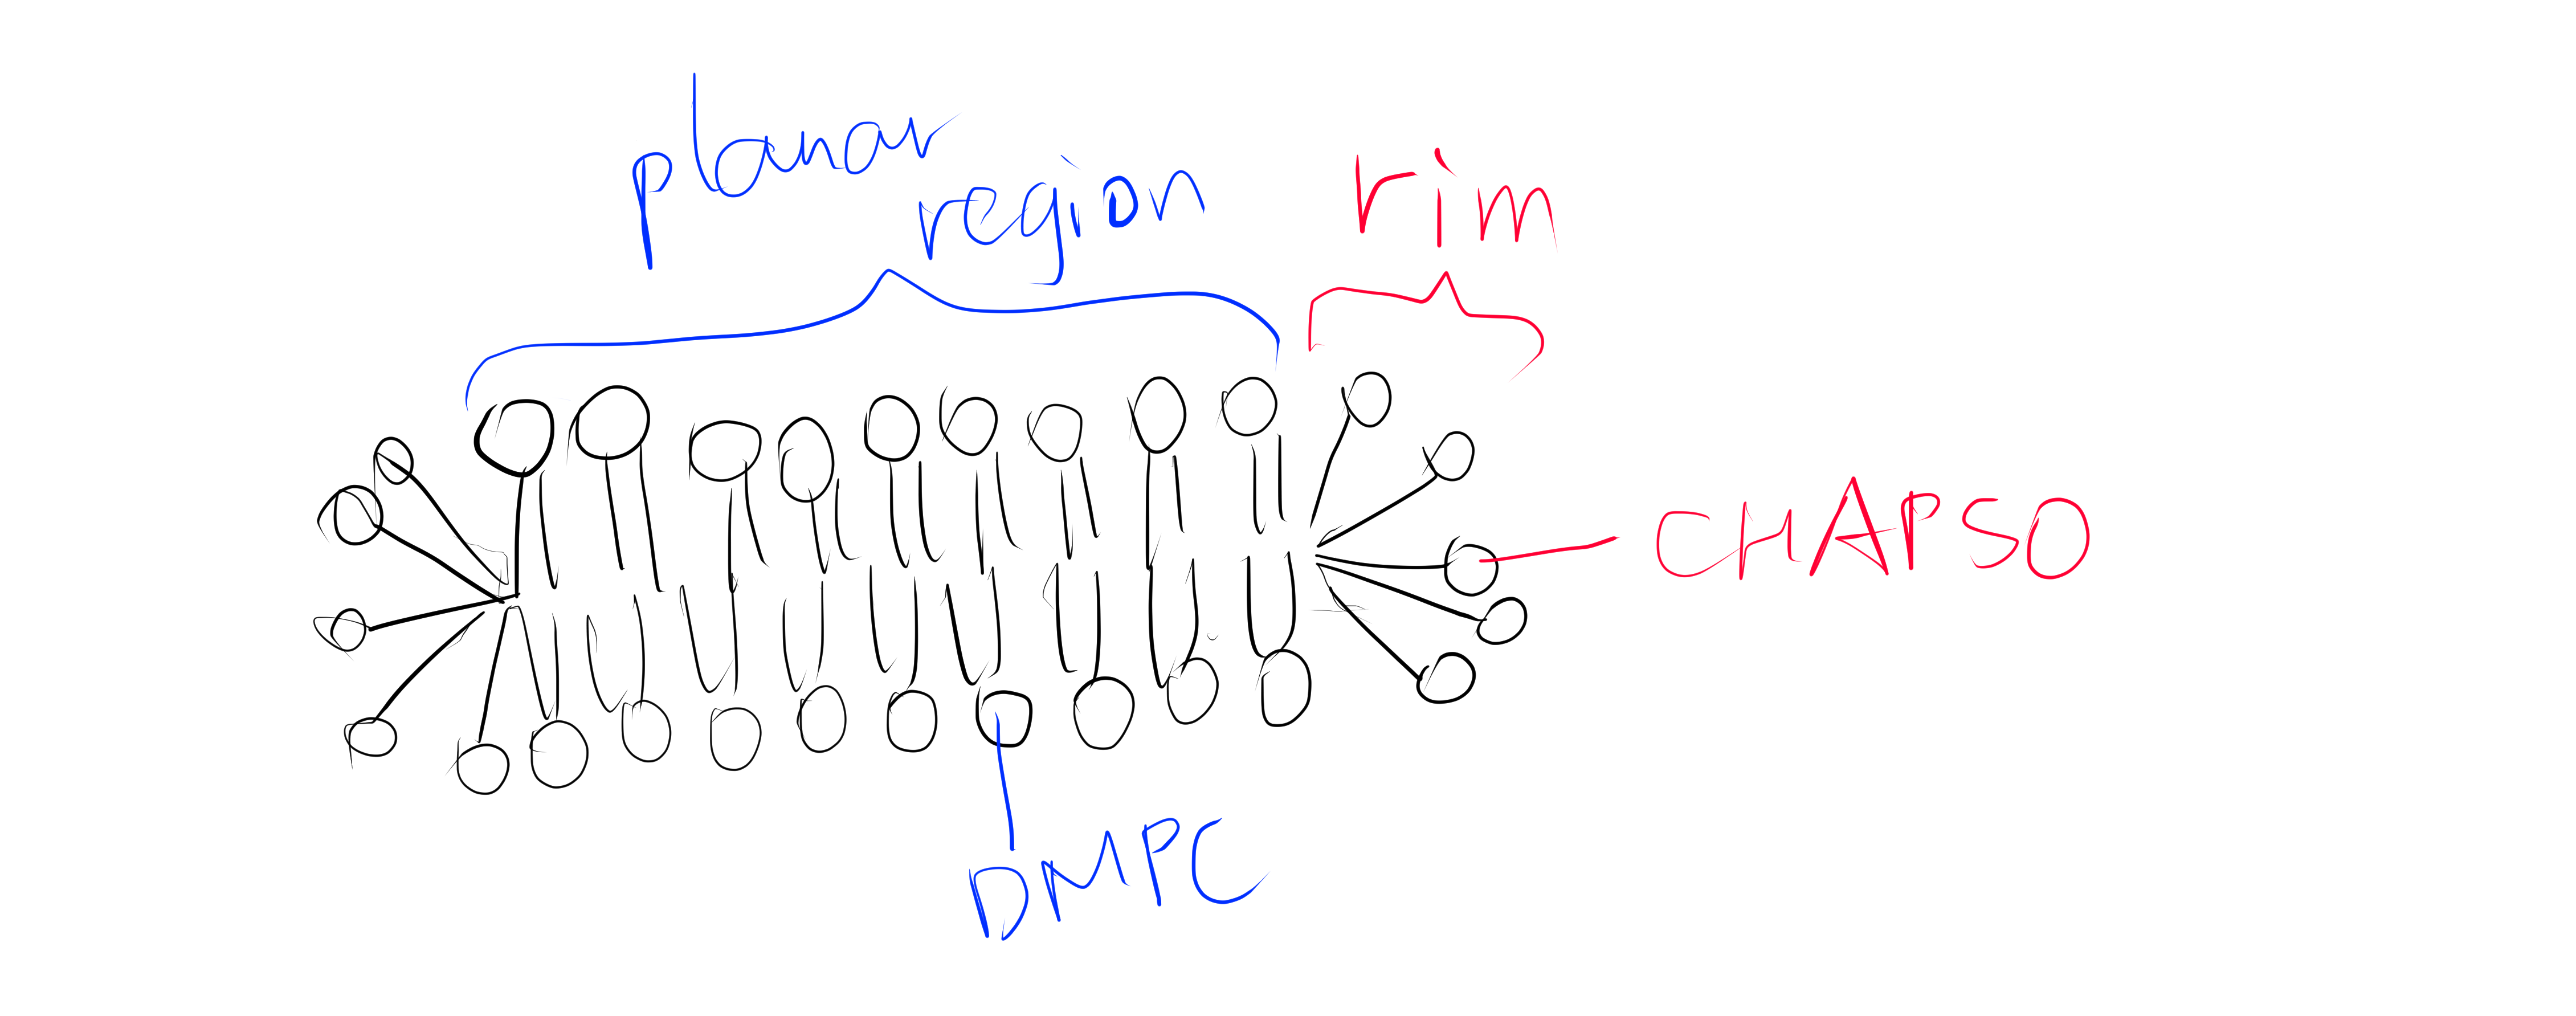
Figure 1: The DMPC:CHAPSO bicelle. Bicelles are disks with a planar region formed by long chain lipid phospholipids and a rim composed of short chain phospholipids or detergent molecules. It provides an environment that resembles a lipid bilayer where membrane proteins’ natively resides. Membrane proteins can be incorporated into bicelles for functional studies as well as crystallisation.
Before X-ray diffraction data collection, crystals were soaked with cryo-protectant solutions containing Ca2+, Mn2+ or Cd2+ of indicated concentrations. These ions travel through solvent channels within the crystals and chelate with amino acid residues in the selectivity filter region.
X-ray diffraction data were integrated and scaled with the HKL2000 packaged and further processed with the CCP4 package. THe structure of CavAb and its derivatives were solved by molecular replacement by using an individual subunit of the NavAb structure (PDB code 3RVY) as the search template. This choice is natural since the proteins used in this study are derived from NavAb and differ from it by no more than 3 amino acid residues.
The divalent cations were identified by anomalous difference Fourier maps calculated using data collected at wavelengths of 1.75 Å for Ca2+, Cd2+ and Mn2+. Anomalous scattering describes cases where a pair of structure factors \(\mathbf{F}_{hkl}\) and \(\mathbf{F}_{\overline{hkl}}\) does not obey Friedel’s law2, which occurs when the incident X-ray photons have an energy close to a transition energy of the diffracting atom, resulting in absorption of radiation energy and change in phase (normal scattering does not change the phase). At the wavelengths convinient for diffraction, only atoms heavier than phosphorus or sulfur behave as anomalous scatterers. While anomalous scattering data are frequently used to solve the phase problem (in techniques known as single/multiple wavelength anomalous dispersion (SAD/MAD)), it can also be used (as in this study) to calculate an anomalous difference map after phases are available to show the locations of the heavy atoms.3
Crystallography and NMR System software was used for refinement of coordinates and B-factors. Final models were obtained after several cycle refinement with REFMAC and PHENIX and manual re-building using COOT. The geometries of the final structural models of CavAb and its derivatives were verified using PROCHECK.
13 crystal structures of 5 proteins (NavAb and 4 CavAb variants) with the following divalent cation concentrations were determined and deposited into PDB:4
- TLESWSM (NavAb) + Ca2+ 15mM
- (TLEDWSM, TLEDESD, TLDDWSM) + Ca2+ 15mM
- TLDDWSD + (Ca2+ 15mM; Mn2+ 100mM; Cd2+ 100mM)
- TLDDWSN + Ca2+ (0.5, 2.5, 5, 10, 15mM)
Of the 13 crystal structure models, 4MVR (175TLDDWSD181) corresponds to the protein with the greatest permeability ratio PCa:PNa , while 4MS2 (175TLDDWSN181) diffracted to the highest resolution (2.75 Å).
Analyses of Results
Ca2+ Binding Sites
Using the anomalous diffraction data, the F+Ca - F-Ca anomalous difference map was calculated. Two strong peaks followed by a weaker peak were found along the ion-conduction pathway, which correspond to the three Ca2+ binding sites. They are designated site 1, 2 and 3 from the extracellular side to the intracellular side.
Site 2 is the site with the highest affinity for Ca2+. It is surrounded by a total of 8 oxygen atoms, 4 of which coming from the carboxylate of D177 above and the other 4 from the carbonyl of L176 below. Site 1 is coordinated by the plane of 4 carboxyl groups from D178, and site 3 by the plane of 4 carbonyls from T175 (Figure 2). Throughout the selectivity filter, the O-Ca2+ coordination distances are in the range of 4.0-5.0 Å, which is much longer than the ionic diameter of Ca2+ (2.28 Å), suggesting that the bound Ca2+ ion maintains its hydration shell while passing through the pore. Site 3 has the lowest affinity, consistent with its role in exit of Ca2+ from the selectivity filter into the central cavity. Figure 3 shows the molecular model and electron density near the selectivity fileter region of CavAb (TLDDWSN + 15mM Ca2+) in COOT5 (contoured at r.m.s.d = \(3.02 \sigma\)).
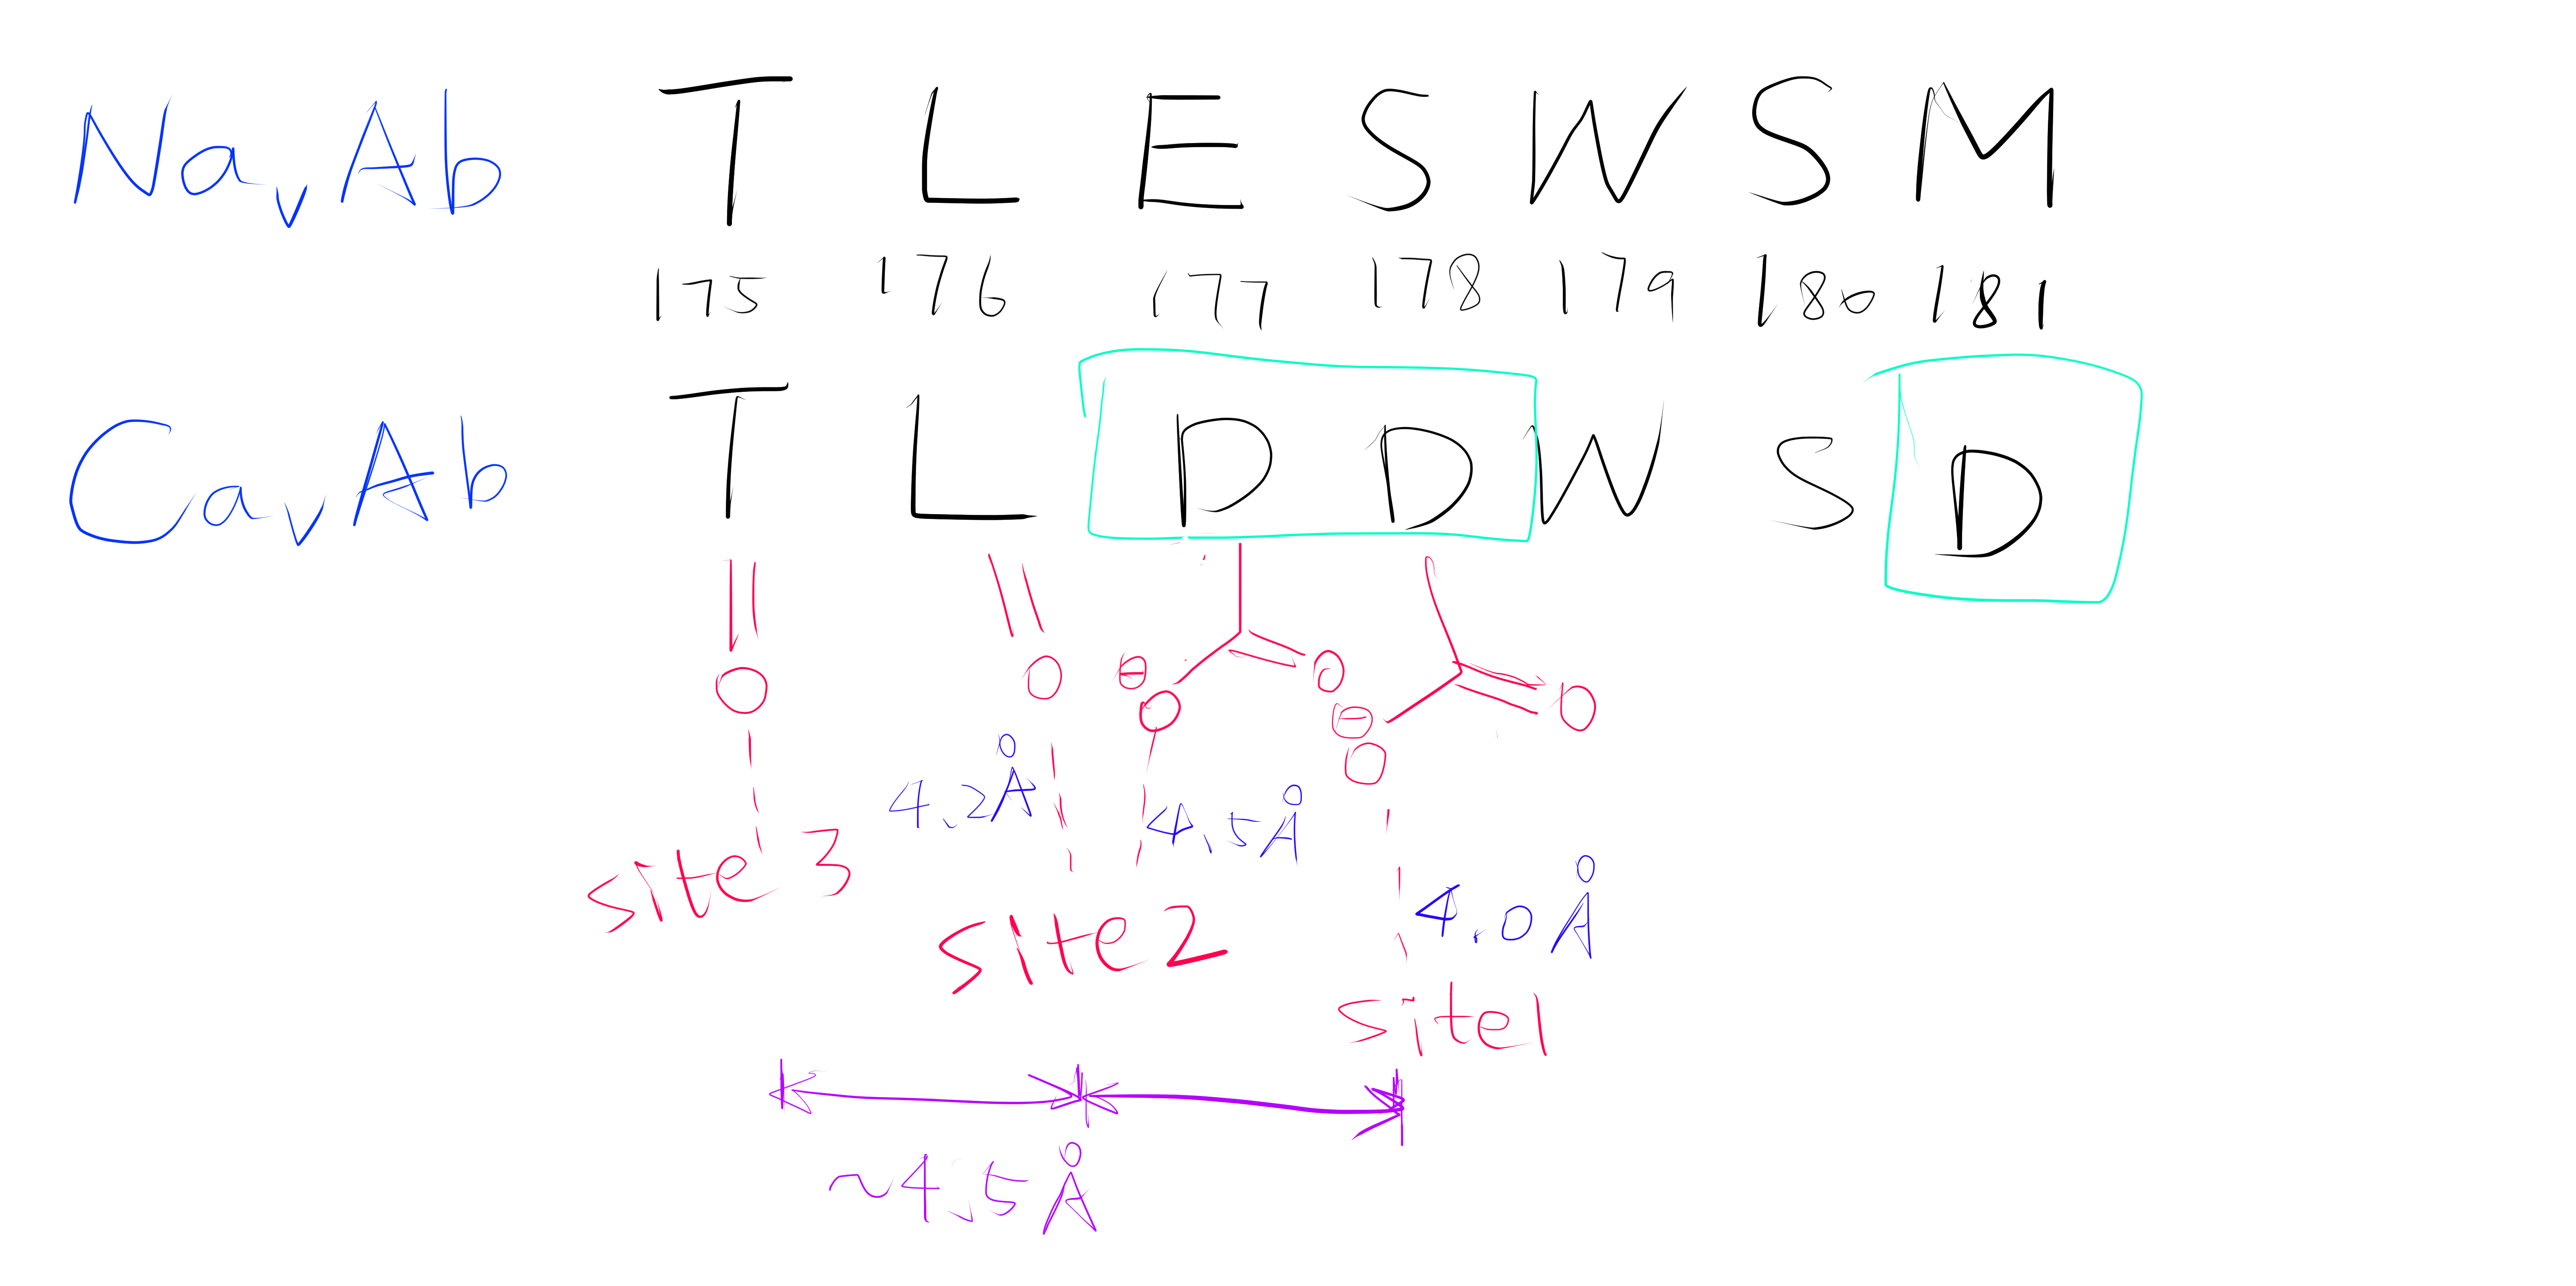
Figure 2: A schemetic showing the Ca2+ ion coordination sites of CavAb (TLDDWSD)
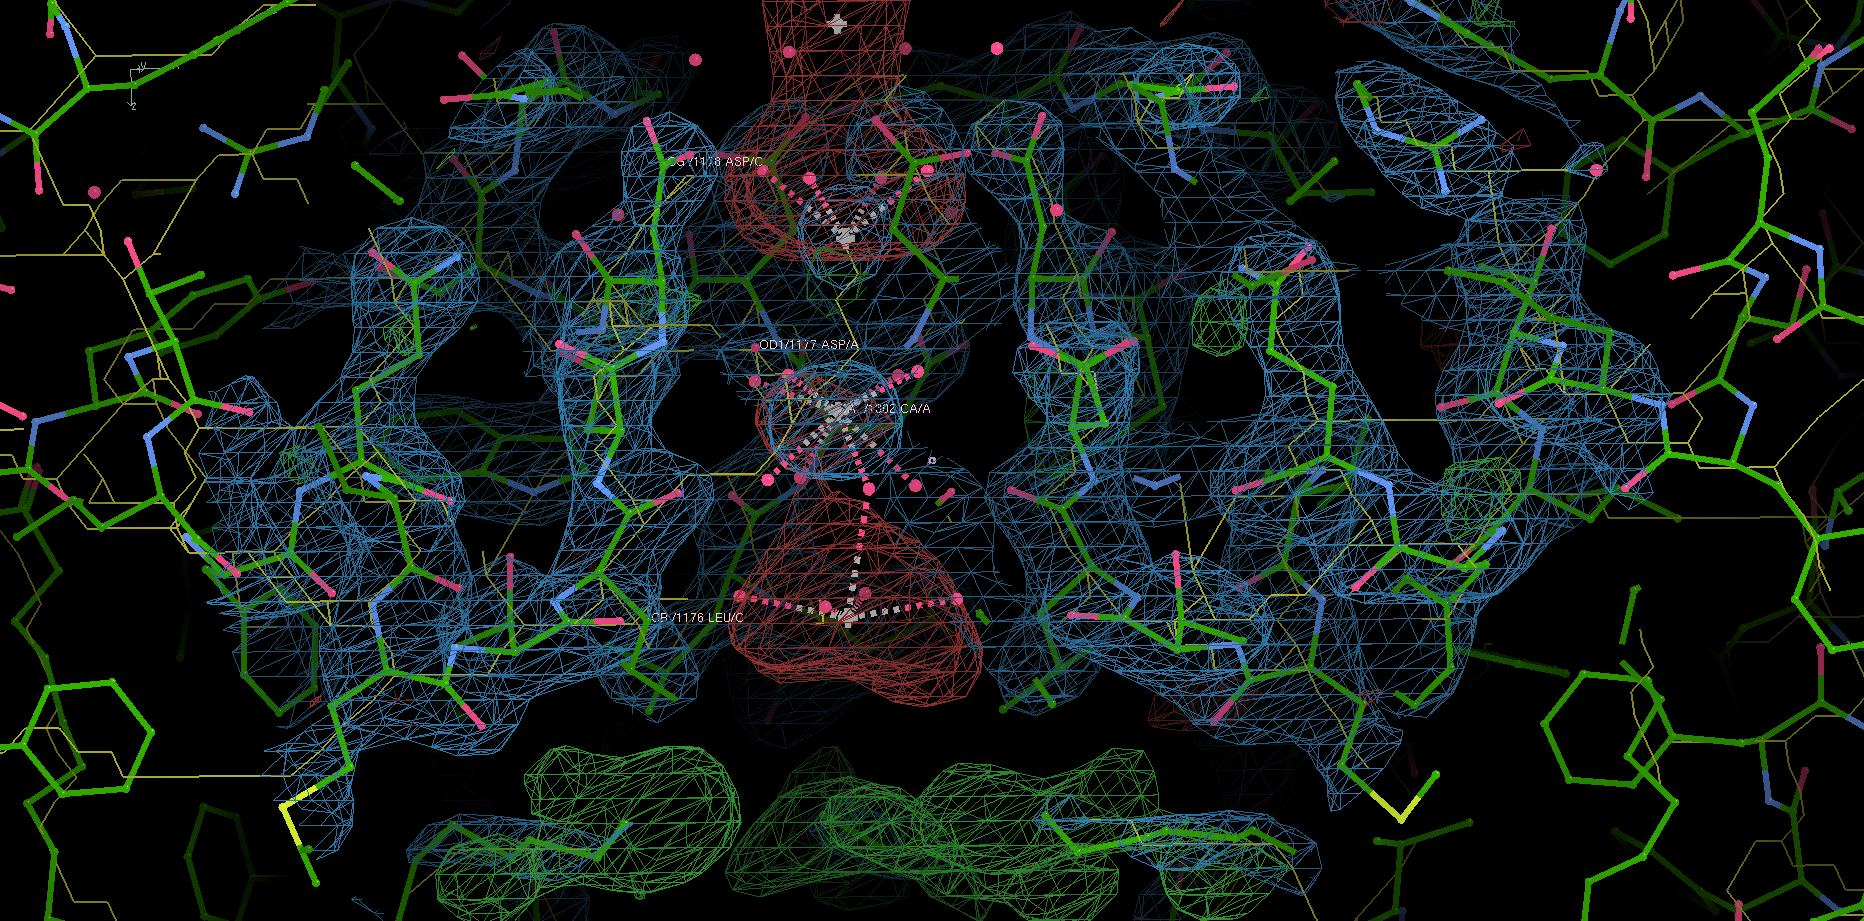
Figure 3: The selectivity filter region of 4MS2.
The relative affinities of the three sites were further confirmed by experiments on CavAb (TLDDWSN) with varying Ca2+ concentrations (0.5, 2.5, 5, 10, 15mM): at low Ca2+ concentration, two strong peaks of approximately equal intensity are found at Site 1 and Site 2; at high concentration the electron density is significantly enhanced in Site 2 and decreased in Site 1. The electron density at Site 3 remains low in all concentrations.
Ion-Permeation Mechanism
Based on the properties of the three coordination sites, an ion-permeation mechanism can be deduced. The three coordination sites are separated by a distance of about 4.5 Å, which makes it energetically unfavourable for Ca2+ to occupy adjacent sites simutaneously. Thus the authors suggested that the selectivity filter oscillates between two states, in which either a single hydrated Ca2+ occupies Site 2, or two of them each occupies Site 1 and Site 3. The entry of Ca2+ into Site 1 is promoted by it high extracellular concentration, and the exit of Ca2+ is facilitated by the low affinity of Site 3.
Notably, this mechanism suggests that Ca2+ ions are kept hydrated during its passage through the selectivity filter. This is very different from the mechanism by which potassium channels achive selectivity, which requires K+ ions’ hydration shell to be removed.
Roles of Key Selectivity Filter Residues
The five variants of CavAb the author produced have different Ca2+ selectivity ratios, which can be partially explained by directly comparing the difference in the arrangement of selectivity filter residues. This comparison is sometimes facilitated by superposition of one structure onto another. For example, the carboxyl group of D177 in TLDDWSD interacts with the Ca2+ ion, while the carboxyl group of E177 in TLEDWSD swings away from the selectivity filter and forms a hydrogen bond with D181 and the main-chain nitrogen atoms of S180.
specifically, from 175TLESWSM181 to TLDDWSD, TLDDWSN, TLDDWSM, TLEDWSM, TLEDWSD and TLDSWSM↩︎
Friedel’s law states that \(\mathbf{F}_{hkl}\) and \(\mathbf{F}_{\overline{hkl}}\) have the same amplitude but opposite phase angle.↩︎
This map is automatically calculated in phenix.refine.↩︎
namely 4MS2, 4MTO, 4MTF, 4MTG, 4MVU, 4MW8, 4MVZ, 4MVM, 4MVO, 4MVQ, 4MW3, 4MVS, 4MVR↩︎
COOT version 0.9.1 (packaged with CCP4), on Linux version 5.8.16-2-MANJARO↩︎
A high-quality protein structure model explains the experimental observations well, and conforms to physical and biochemical principles. There are some parameters indicating the quality of a structure model. Some of them are used during model building and refinement, while others apply only on a refined structure.
1 The Essence of X-Ray Crystallography
The intensity at \((h, k, l)\) in the reciprocal space, i.e. the structure factor amplitudes collected in X-ray experiments is directly related to the Fourier transform of the electron density in the real space (\(I = \mathbf{F}_{hkl}^2\)), the latter being calculated as:
\[\begin{equation} \mathbf{F}_{hkl} = \int_{x}\int_{y}\int_{z}\rho(x, y, z)e^{2\pi i(hx +ky + lz) }\mathrm{d}x \mathrm{d}y \mathrm{d}z \end{equation}\]
In practice, since the number of atoms and reflections (hence \((x, y, z)\) or \((h, k, l)\) coordinates is limited, its discrete form, which can be efficiently computed, is used:1
\[\begin{equation} \mathbf{F}_{hkl} = \sum_{j}^{n}f_j e^{2\pi i(hx_j +ky_j + lz_j) } \end{equation}\]
where \((x_j, y_j, z_j)\) is the coordinates of the j-th atom in real space.
This is also known as the structure factor equation.
Solving the electron density from structure factors involves solving the inverse Fourier transform of the above equation, also known as the electron density equation, in its discrete form:
\[\begin{equation} \rho(x, y, z) = \dfrac{1}{V}\sum_{h}\sum_{k}\sum_{l}w_{hkl}|\mathbf{F}_\text{obs}|e^{-2\pi i(hx + ky + lz - \alpha^\prime_{hkl})} \end{equation}\]
where \(\alpha^\prime_{hkl}\) is the phase at each set of coordinates in the reciprocal space. The phases are not directly available but are necessary (actually more important than intensities) for computing \(\rho(x,y,z)\) (electron density).
The phases can be solved either by phasing experiments, in which case the resolution is relatively low but the data is unbiased, or by molecular replacement (MR), in which case the resolution is relatively high but the data suffer from bias (the phases resemble the search model more than the actual structure). Thus, bias minimisation measures such as maxinum likelihood map coefficients are applied before electron density map contrstruction.
2 Assessing the Quality of A Structure During Model Building and Refinement
Solving the electron density and ultimately the atomic structure from experimental data is an iterative process, starting from a model with low resolution and imperfect phases and progressively refining the model by applying prior knowledge on the information the current model can provide so far.
In general, the first step in refinement is to construct a crude electron density map (Equation (3)) using phase angles (\(\alpha^\prime\)) obtained either from MR or experimental phasing. This initial map, F0, is improved using techniques such as density modification, solvent leveling, solvent flattening. At some critical point in the iterative improvement of phases, the map becomes clear enough that a protein chain can be traced through it. From this point on, real-space refinement is also conducted at each round of iteration. Electron density map is obtained (details in Section 2.3), and filled with atoms, and transformed back to the reciprocal space. This process repeats until converging to a high-quality strucure. \(R\) and \(R_\text{free}\), explained below, are used to assess progress in the refinement, and is also a major factor in evaluating the quality of a model.
2.1 R and Rfree
R is a measure of the deviation of calculated intensities from models (details in Section 2.2) from the observed intensities in the diffraction pattern, defined by the following equation:
\[ R = \dfrac{\sum ||\mathbf{F}_\text{obs}| - |\mathbf{F}_\text{calc}||}{\mathbf{F}_\text{obs}} \]
Since bias can easily be introduced into the R value (especially by overparameterisation, see Section 2.2) and a reduction of R value sometimes does not improve the actual quality of structure (Kleywegt and Brünger (n.d.)), a small fraction (typically around 5%2) of randomly selected reflections are removed from the data used for refinement. These reflections can then be used to calculate an R factor, denoted as \(R_\text{free}\), whose reduction can be considered as an unbiased estimate of the improvement of the model.
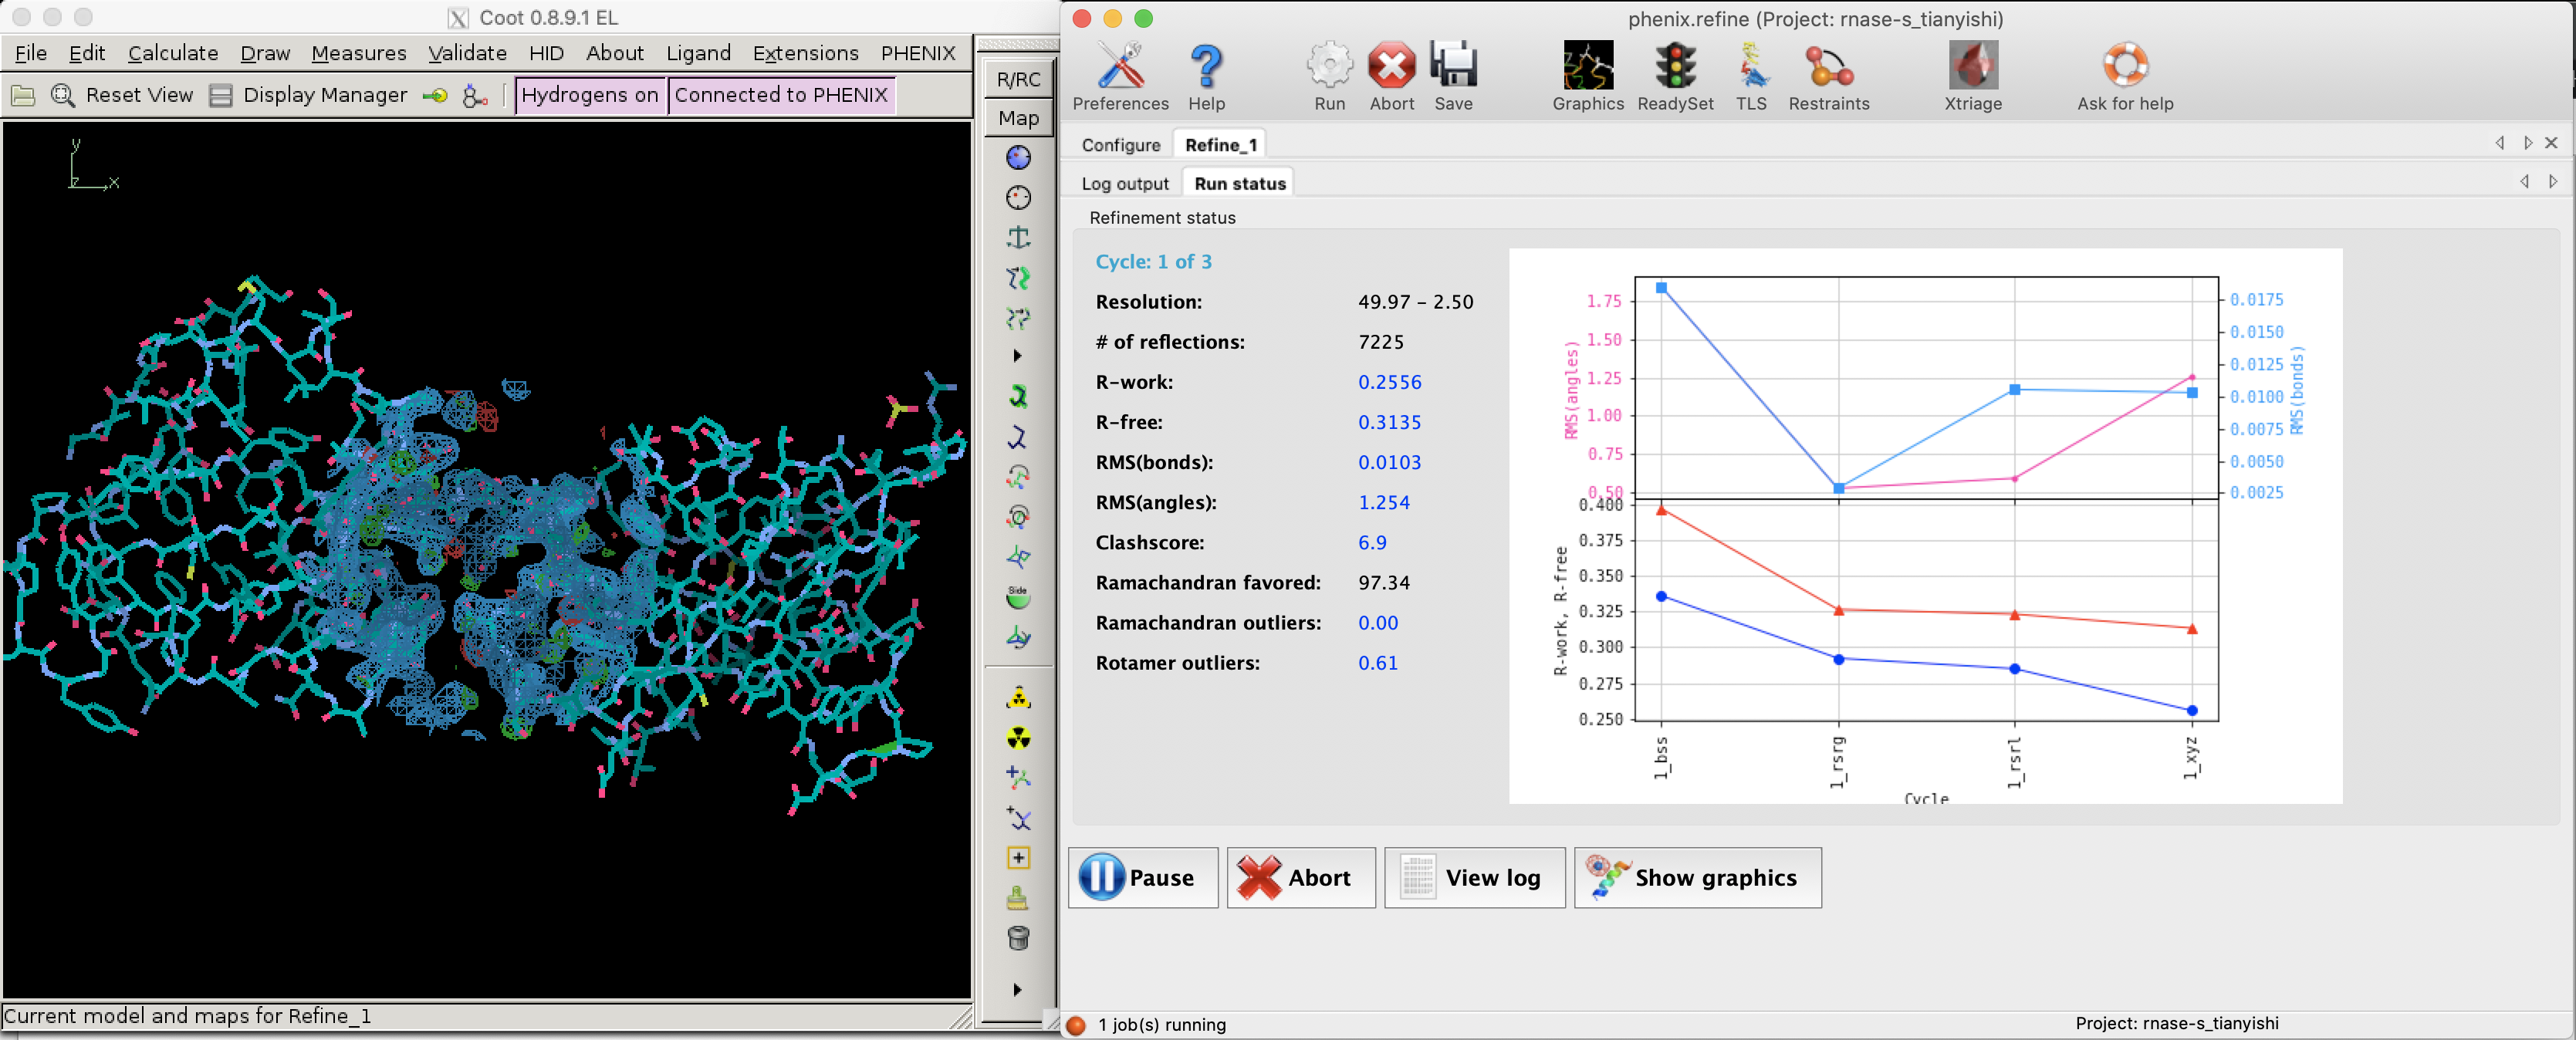
Figure 2.1: R and R-free values decreases as refinement proceeds (left: Coot; right: phenix.refine).
Figure 2.1 shows the decrease of R and Rfree during a refinement task conducted in Phenix.
2.2 Reciprocal-Space Refinement: Refinement by least squares
Reciprocal-space refinement involves computerised attempts to improve agreement between \(\mathbf{F}_\text{obs}\) and \(\mathbf{F}_\text{calc}\) by without consideration of the maps and models. Refinement by least squares is the earliest successful technique and is discussed here.3
The goal of refinement by least squares is, find \((x_j, y_j, z_j)\) for all atom \(j\) whose expected ( i.e. computed) structure factor amplitudes, \(|\mathbf{F}_\text{calc}|\) are as close as possible to observed structure factor amplitudes, \(|\mathbf{F}_\text{obs}|\). Specifically, this means minimising the function \(\Phi\):
\[\begin{equation} \Phi = \sum_{hkl}(w_{hkl}\mid\mathbf{F}_\text{obs}\mid - \mid\mathbf{F}_\text{calc}\mid)_{hkl}^{2} \end{equation}\]
where \(w_{hkl}\) is the weight term that depends on the reliability of the corresponding measured intensity and \(|\mathbf{F}_\text{calc}|\) is a variant form of Equation (2) that can include additional parameters such as B-factor (\(B_j\)) and occupancy \(n_j\). An equation with \(B_j\) and \(n_j\) included can be written as:
\[\begin{equation} \mathbf{F}_\text{calc} = \sum_{j}n_j f_j e^{2\pi i(hx_j +ky_j + lz_j) - B_j[(\sin\theta)/\lambda]^2} \end{equation}\]
Note that the equatin shows that the effect of B-factors depends on the angle of reflection \((\sin\theta)/\lambda\).
Solving the minimum of \(\Phi\) analytically is impractical, and instead numerical methods are used, which would lead to a minimum closest to the starting value.To prevent the refinement converging to a local minimum, it is important that the starting parameters be near the global minimum. Is also important not to include too many parameters (such as B-factor) at the initial stages of resolution when the resolution is low, as this would decrease the radius of convergence (Figure 2.2).

Figure 2.2: Adding number of parameters improves precision of refinement, but makes it more unlikely to reach the global minimum from a given point. Thus, refinement starts with a small number of parameters, and more parameters are only added after the success of previous lower-resolution refinement steps.
To minimise the number of parameters used during early stages of refinement (and thus to increase radius of convergence), individual \((x,y,z)\) coordinates are actually not used. Instead, only torional angles \(\psi\) and \(\phi\) are allowed to change, and all bond lengths and angles are fixed to their theoretical average, side chains are assumed to be in their preferred conformation, and peptide linkages are fixed to be planar. This strategy is known as restrained reciprocal space refinement. As refinement proceeds, more parameters, from individual \((x,y,z)\) coordinates to isotropic B-factors and finally anisotropic factors, can be added into calculation.
2.3 Real-Space Refinement: Map Fitting
Map fitting or model building entails building a molecular model that fits realistically into the current electron density contour map.
To reduce the bias (towards Fcalc (Fc)) when constructing the electron density map, Fourier syntheses of Fobs and Fcalc are used. A Fourier synthesis mFo - nFc is calculated as:
\[ \rho(x, y, z) = \dfrac{1}{V}\sum_{h}\sum_{k}\sum_{l}(m|\mathbf{F}_\text{o}|-|\mathbf{F}_\text{c}|)e^{-2\pi i(hx + ky + lz - \alpha^\prime_{hkl})} \]
and its corresponding electron density map is called an mFo - nFc map.
Simply put, the 2Fo - Fc map resembles a molecular surface, and a Fo - Fc map emphasises the error (positive density implies that the unit cell contains more electron density in this region than implied by the model (Fc). Near the end of refinement, the Fo - Fc map becomes rather empty except in problem areas, which may need to be corrected manually.
Fitting a molecular model into the electron density map depends on prior knowledge, such as average bond lengths and angles, the amino acid sequence of the protein, properties of peptide chains, etc. For example, we know that carboxyl oxygens in adjacent amino acid residues in a \(\beta\)-sheet point in opposite directions. Thus, once a \(\beta\)-sheet along with one or two carboxyl oxygen are discernible, we can make a sensible guess of the positions of all other carbonyl oxygens.
3 Assessing Quality After Automatic Model Building and Refinement
3.1 Density fit analysis and local geometry validation
Automatic model building and refinement use the decrease of R value as an indicator of progress and terminates when R is considered to be sufficiently low. This may lead to situations where the global R is favourable but local geometry can still be improved.
Local geometry validation programs, such as “Density fit analysis” in Coot (Figure 3.1), evaluate the model geomtry on a per-residue basis and flag outliers. These outliers can then be fixed manually. With the aid of electron density contour maps (where model atoms lie outside 2Fo - Fc contours, the Fo - Fc will often show the atoms with negativel contours, with nearby positive contours pointing to correct locations for these atoms).
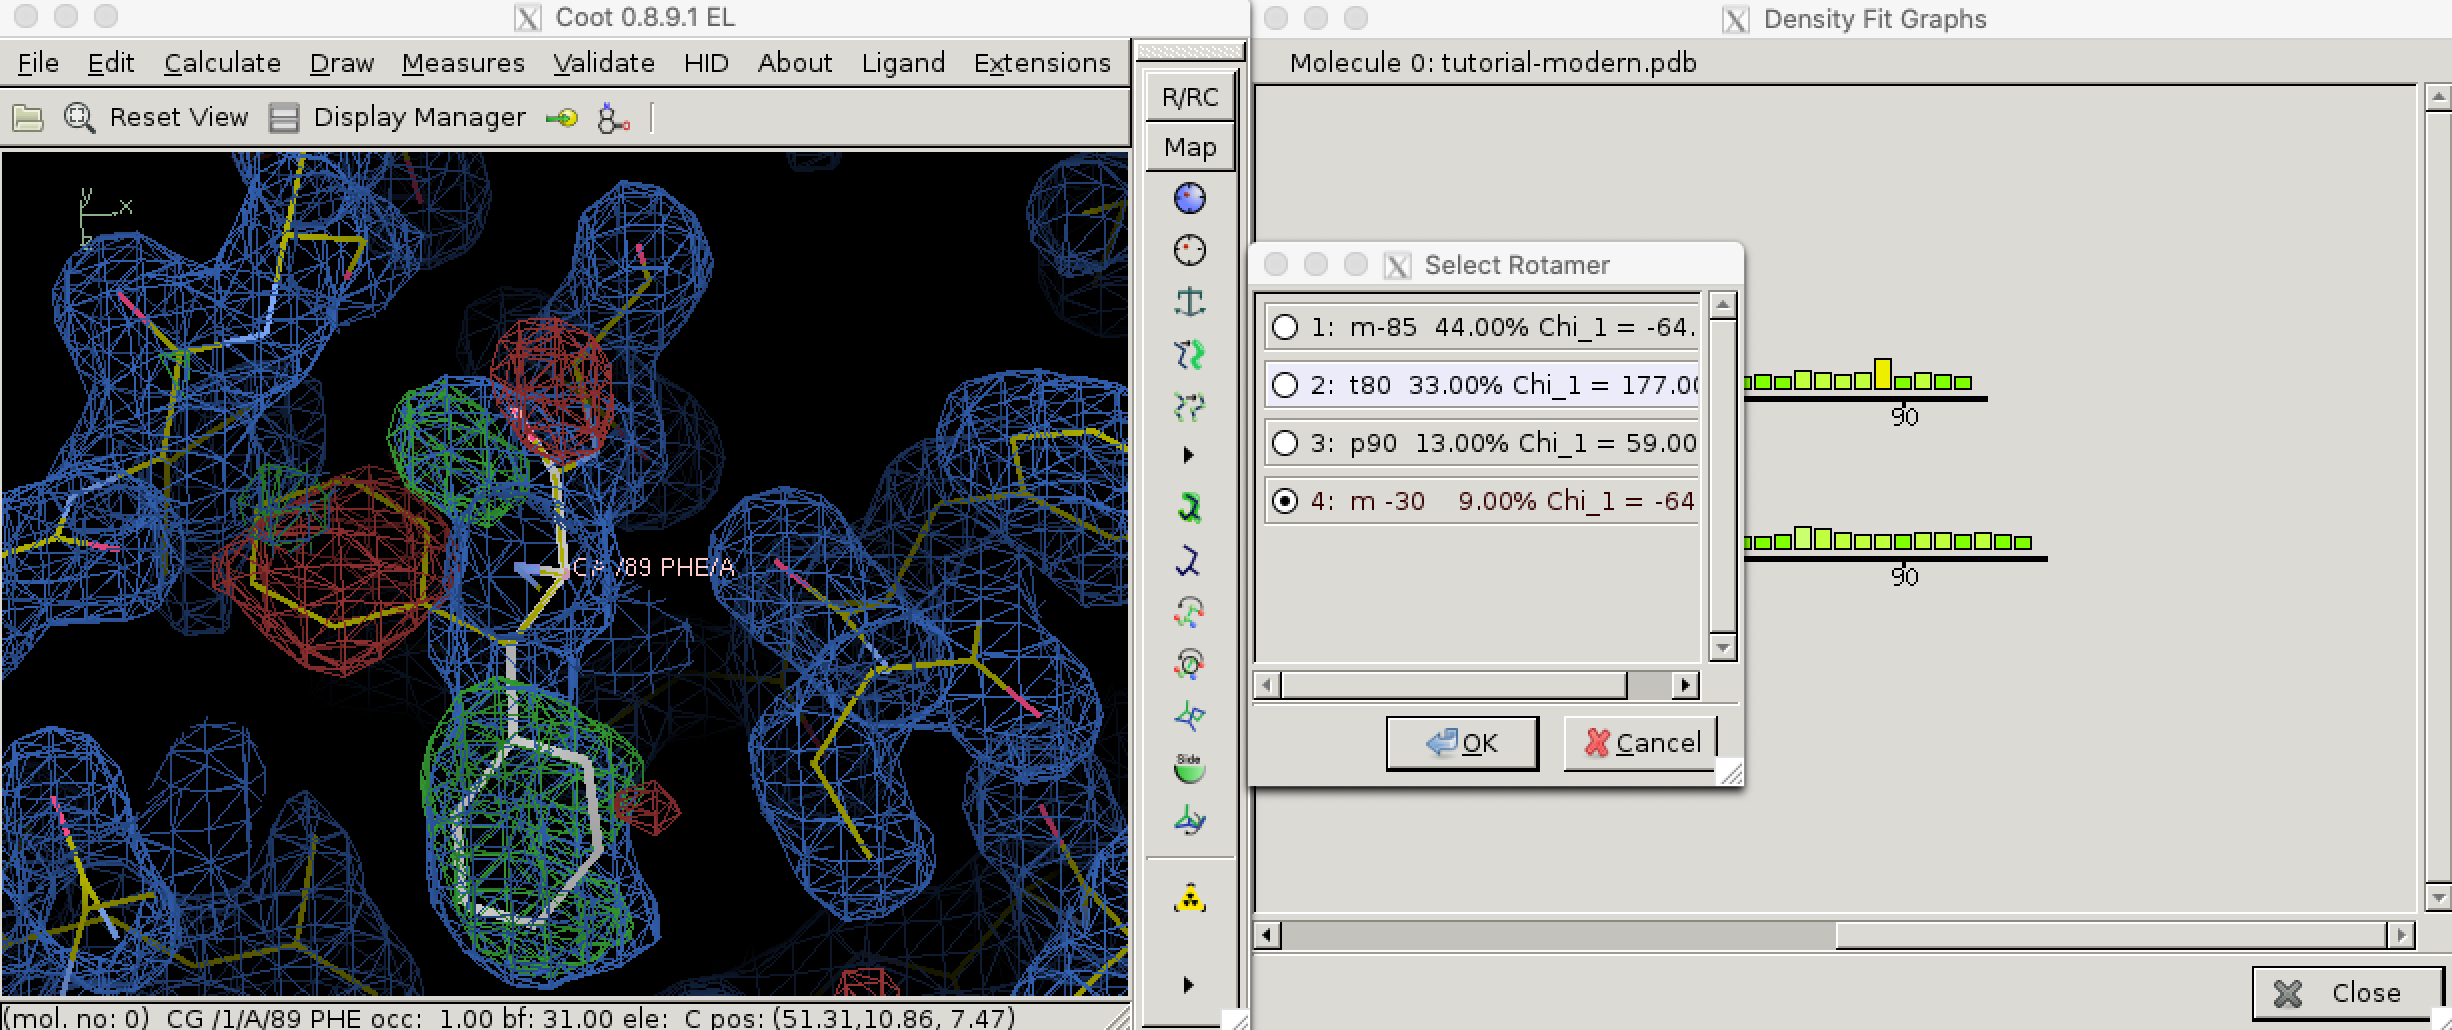
Figure 3.1: Use the ‘Density fit analysis’ function to evaluate model geometry on a per-residue basis and plot a histogram that shows outliers, then use the ‘Rotamers’ tool to fix a side chain that’s pointing the wrong way.
3.1.1 Structural parameters: bond length, bond angle, chirality, planarity, and dihedral angles
During late stages of refinement, restraints on structura paramaters such as bond lengths and angles are release such that thay are allowed to change freely as long as R values could be made to decrease. This may lead to unrealistic models with improbable structural parameters. Thus, they need to be validated. By convention, this is done by calculating the root-mean-square deviations (RMSD) of these parameters in the model from the corresponding set of values based opon the geometry of small organic molecules. These values are recorded in PDB files in REMARK 3 fields:
REMARK   3  DEVIATIONS FROM IDEAL VALUES.
REMARK   3                 RMSD          COUNT
REMARK   3   BOND      :  0.003           1366
REMARK   3   ANGLE     :  0.675           1846
REMARK   3   CHIRALITY :  0.050            186
REMARK   3   PLANARITY :  0.005            246
REMARK   3   DIHEDRAL  : 15.473            459
Because bond angles, lengths, chirality and planarity are restrained in early stages of refinement, they are less likely to deviate much from ideal values. Dihedral angles, which is allowed to change throughout the refinement, produce much larger RMSD and are worth closer examination.
3.1.2 Torsional Angles and Ramachandran Plot
Torsional (dihedral) angles \(\psi\) and \(\phi\) are show much more variation than bond lengths and angles, but only a subset of all possible (\(\phi\), \(\psi\)) pairs are allowed so that adjacent amino acid side chains do not clash. Validation of torsional angle is achieved via a lookup table, where the keys are (\(\phi\), \(\psi\)) pairs and values are scores. A (\(\phi\), \(\psi\)) is considered preferred or allowed if its score is within certain thresholds. Otherwise, it is considered an outlier. Due to glycine’s small size and proline’s cyclic structure, the preferred/allowed regions of their torsinal angle pairs are defined differently, for example in Phenix/cctbx4. Torsional angle validation is often visualised with a Ramachandran plot, as shown in Figure 3.2.5
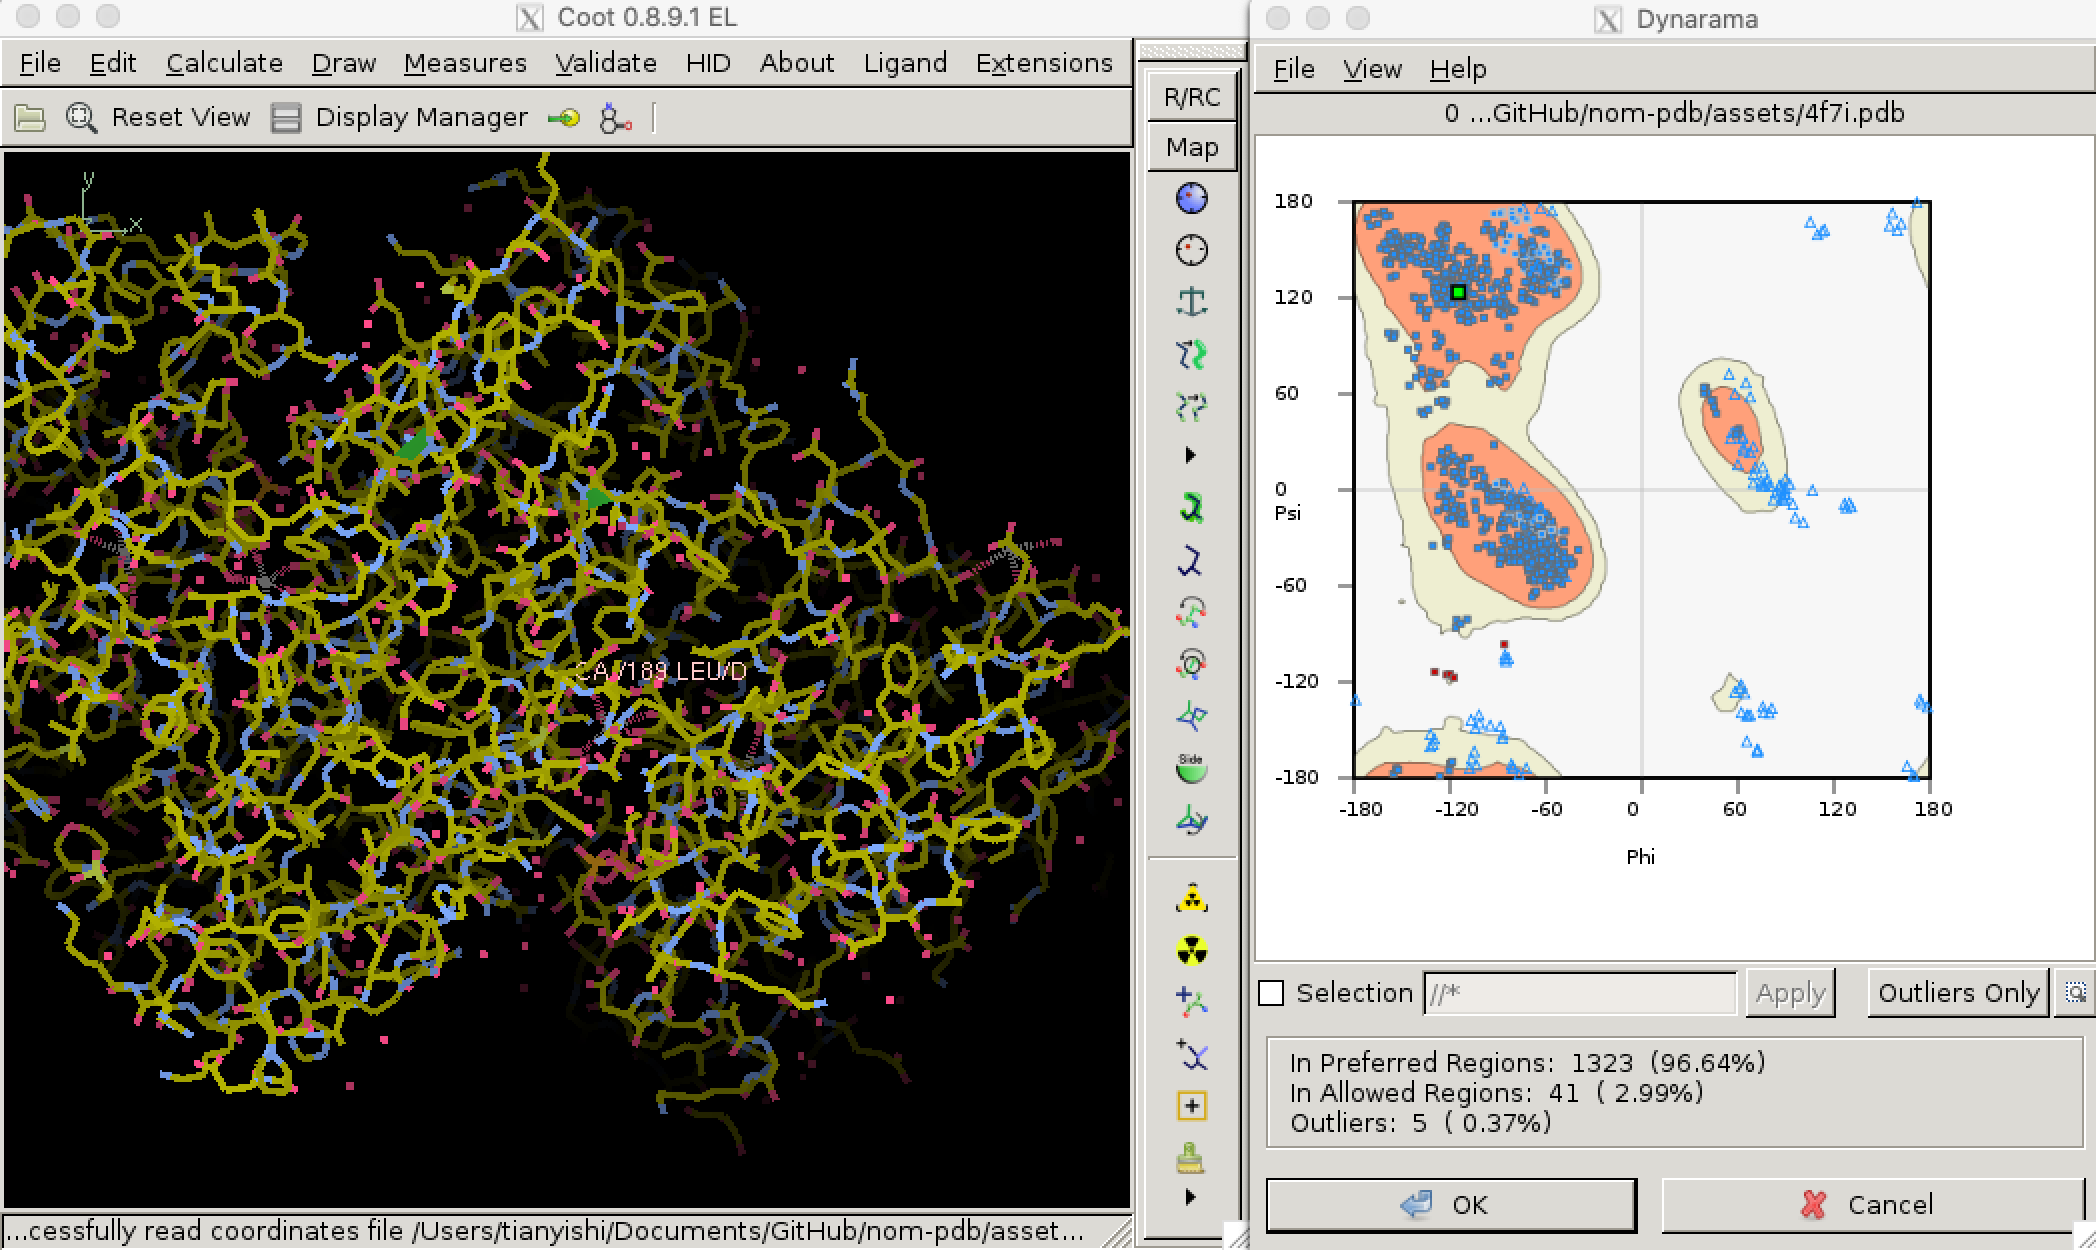
Figure 3.2: Validating dihedral angles with Ramachandran plot in Coot
3.1.3 Undefined regions
Often, some regions (often the terminal regions) of the protein are highly disordered and produce no detectable diffraction at high resolution and are thus invisible in the electron-density maps. It is not uncommon to omit these residues in the model. In some cases, however, exact coordinates are given for these atoms, along with very high B-factors (above 50 or 60 angstroms), and one must be careful not to over-interprete these regions.
3.1.4 Unexplained Density
Empty electron density may remain after all known contents of the unit cell have been located. This can either due to an artifect of missing Fourier terms, reagents used in purification or crystallisation, or it could be due to previously unknown ligands (cofactors, inhibitors or allosteric effectors).
3.1.5 Distortions due to crystal packing
Although flexibility of atoms is usually reflected by the B-factor, in certain situations dynamic regions of a protein molecule can be rigidly fixed in a specific conformation as a result of crystal packing interactions. It should be declared in the PDB header that the protein is affected by crystallisation. One can also check whether these interactions are likely to occur by displaying all neighbouring, symmetry-related molecules in the crystal structure and examine if any intermolecular interactions are present that are a result of crystal packing.
References
Blow, David. 2002. Outline of Crystallography for Biologists. Oxford University Press.
Kleywegt, G J, and A T Brünger. n.d. “Checking Your Imagination: Applications of the Free R Value.” Structure 4 (8): 897–904. https://doi.org/10.1016/s0969-2126(96)00097-4.
Rhodes, Gale. 2006. Crystallography Made Crystal Clear Clear. Academic Press.
Rupp, Bernhard. 2010. Biomolecular Crystallography: Principles, Practice, and Application to Structural Biology. Garland Science.
Most crystallography softwares seem to use Fast Fourier Trasnform (FFT) algorithms provided by FFTW (http://www.fftw.org/) to compute discrete fourier transforms (and its inverse)↩︎
In PDB files, this fraction is recorded in the field
FREE R VALUE TEST SET SIZE↩︎modern refinement softwares use techniques such as simulated annealing and beyesian methods to improve the accuracy of refinement↩︎
In Phenix/cctbx, a lookup table (actually implemented as an array for better performance) is defined for each of the following cases: glycine, cis-proline, trans-proline, pre-proline, isoleucine/valine, and all other amino acid residues:
mmtbx/validation/ramachandran/rama8000_tables.h↩︎Recently I’ve been developing a PDB file parser. It is now able to parse coordinate information reliably, which allows Ramanchandran plot analysis: https://github.com/TianyiShi2001/protein↩︎
Presentation see here
Discuss the feasibility and desirability of improving photosynthesis in higher plants through the use of photorespiratory bypasses.
Plants and algae use the Calvin cycle to capture inorganic carbon (as CO2) and use ATP and NADPH generated in light reactions to convert it to organic carbon. This process, known as photosynthesis, is the predominant way to replenish organic carbon in the biosphere, and is the basis for human food production. Despite its crucial role, the key enzyme in the pathway that attaches the inorganic CO2 to the organic sugar 1,5-bisphosphate (RuBP), called Rubisco, is not efficient, in that it can also use O2 instead of CO2 as the substrate, which leads to production of one molecule each of 3-PGA and 2-phosphoglycerate (2-PG). Plants use a pathway known as photorespiration to remove the toxic 2-PG and to salvage some (75%) carbon lost from the Calvin cycle by converting two 2-PG to one 3-PGA while releasing CO2 (Figure 0.1 ). Photorespiration is one of the major factors contributing to inefficiency of photosynthesis because 1) much CO2 released in mitochondria is escaped into the atmosphere and not re-assimilated in the Calvin cycle, resulting in the reduction of the amount of Calvin cycle intermediates; 2) O2 directly competes with CO2 for Rubisco reaction (in ambient atmosphere and at 25oC, 25% of the Rubisco reactions in an average C3 plant uses O2); 3) in photorespiration, ammonia is released and needs to be reassimilated at the expense of one molecule of ATP and two reducing equivalents (reduced ferredoxins) per molecule of ammonia; 4) reducing power is dissipated in the oxidation of glycolate using molecular oxygen; 5) ATP is also consumed for phosphorylating glycerate in the final step in the photorespiration pathway (because the phosphate group on 2-PG is removed by phosphatase and is thus not conserved). The total direct energy cost for converting two 2PG to one 3PGA is 3.5 ATP and 2 NADPH. The rate of photorespiration is increased by the ratio of O2 concentration to CO2 concentration experienced by Rubisco (in C3 plants, this is similar to atmospheric ratio), and is thus increased by high temperature, as solubulity of CO2 decreases faster than does O2 with increasing temperature.
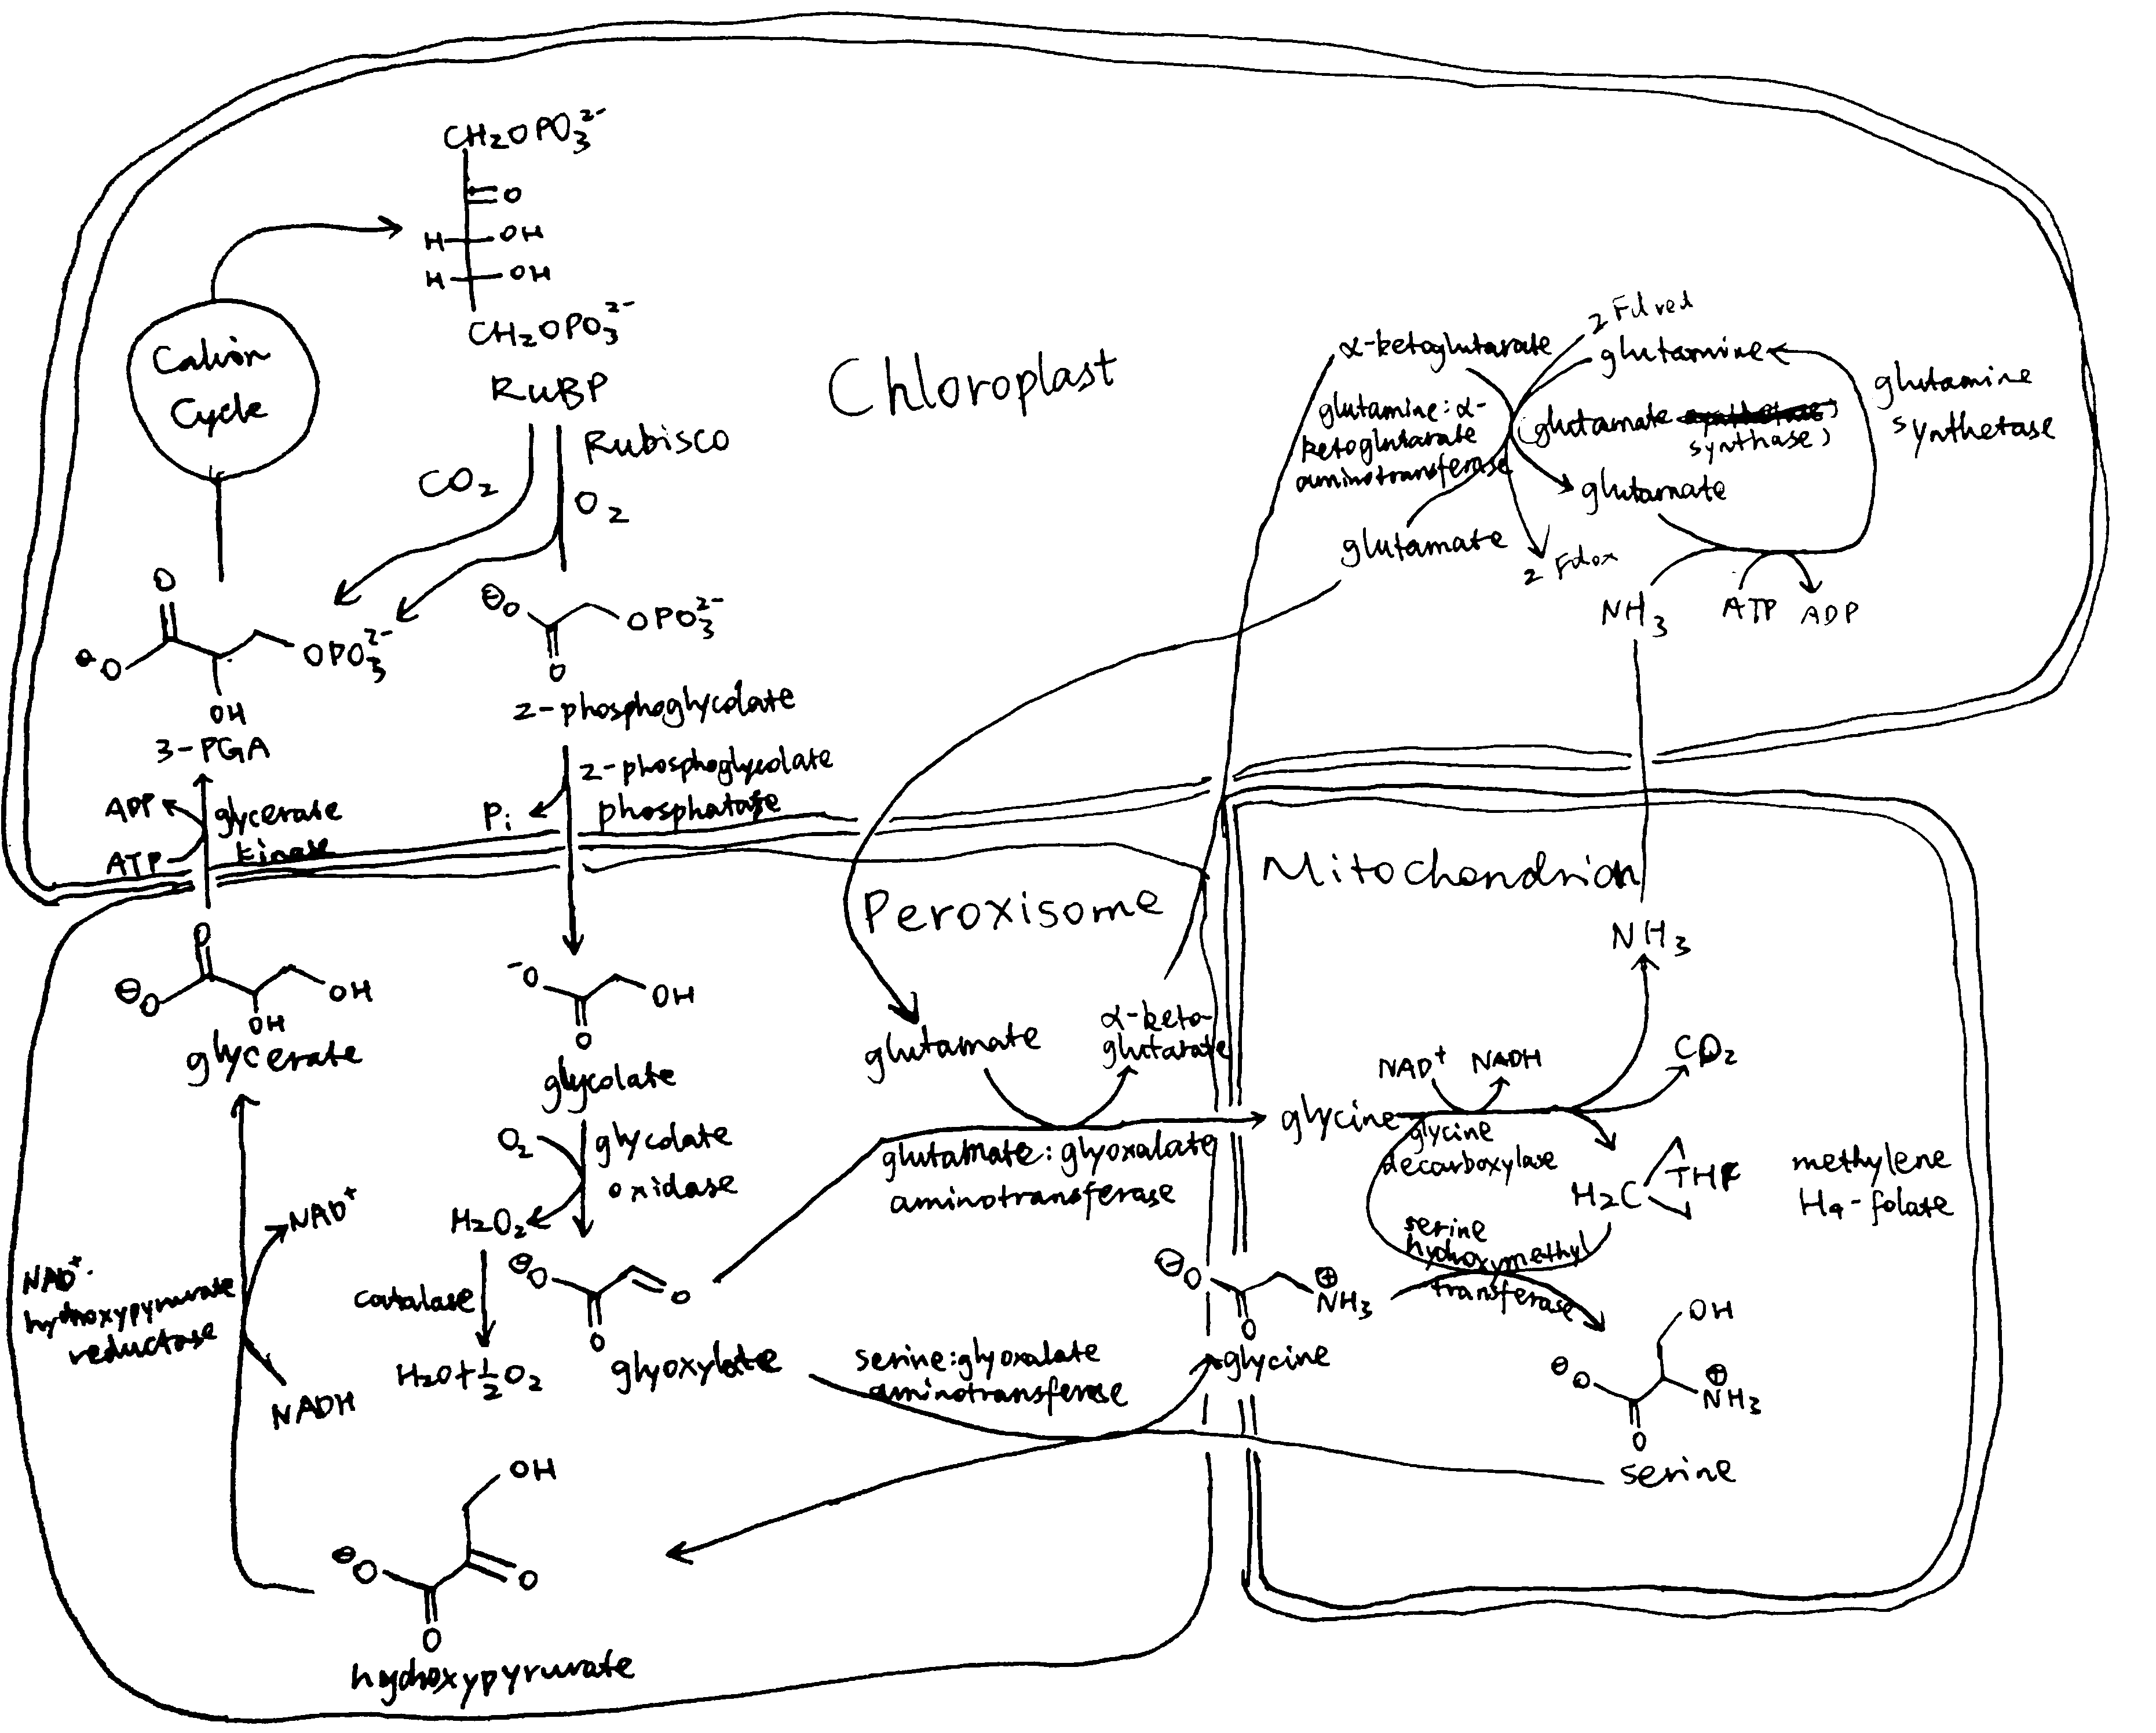
Figure 0.1: The native photorespiration pathway.
Several groups of photosynthetic organisms independently evolved strategies to minimise photorespiration and are thus able to grow in hot and/or CO2-deficient conditions. For example, C4 and CAM plants uses PEP carboxylase, which uses \(HCO_3^-\) instead of CO2 as the substrate, to perform an initial carboxylation, which results in production of 4-carbon malate/oxaloacetate that is later used to release CO2 for Rubisco reaction. The initial carboxylation and later decarboxylation is separated spatially in C4 plants and temporally in CAM plants. In aquatics environments where CO2 concentration is low, cyanobacteria and green algae uses bicarbonate pumps to actively increase intracellular CO2 (\(HCO_3^-\)) concentration, and their Rubisco is in close proximity with carbonic anhydrase, which converts \(HCO_3^-\) to CO2.
The vast majority of land plants (especially crops), however, adopts the C3 metabolism scheme, which means they do not actively concentrate CO2 and are susceptible to reduction of photosynthesis efficiency by photorespiration. Thus, it has been believed that reduction in photorespiration can improve photosynthesis and hence crop yield.
1 Attempts to Inhibit Photorespiration and Improve Specificity of Rubisco
Initial attempts to reduce the effect of photorespiration include inhibition, knock-down and knock-out of the enzymes involved in photorespiration. The relevant genes are identified by screening for mutants that have impaired photorespiratory function. However, most of such mutants exhibited chlorosis and stunted growth. The rationale is simple: reduction of photorespiratory enzyme activity not only does not reduce the production of 2-PG by Rubisco, but also causes the toxic molecules resulted from partial metabolism of 2-PG to accumulate. Also, it has been suggested that photorespiratory enzymes may be also involved in other pathways related to serine biosynthesis and nitrogen metabolism.
Researches that attempted for a Rubisco enzyme with a greater specificity for CO2 were also conducted. However, it was found that there is a inverse relationship between specificity and rate of reaction. As adaptations to achieve maximal rate of photosynthesis in different environments, Rubisco with high specificity and low turnover rate are typically found in C3 plants that grow under high temperature/low CO2, and Rubisco with high turnover and low specificity are generally found in C3 plants that grow under lower temperature, as well as in organisms with a CO2-concentrating mechanism (C4/CAM/algae/cyanobacteria).
2 Bypassing Photorespiration
As attempts to improve Rubisco specificity and inhibit photorespiration directly both did not yield much outcome, photorespiratory bypasses becomes the new hotspot for improving photosynthesis. In general, photorespiratory bypasses are ‘designed photorespiratory pathways’ that aim to minimise energy comsumption and CO2 loss to the atmosphere. Successful bypasses usually involve confining photorespiration to less compartments (ideally in chloroplast only), preventing lost of reducing power via oxidase, preventing release of NH3, and reducing the number of steps of reactions.
2.1 Implementing The Bacterial Glycerate Pathway
Many bacteria possess a simple and efficient pathway for converting glyoxylate to glycerate. This pathway involves two steps: 1) condensation of two glyoxylate to tartronate semialdehyde (by glyoxylate carboxyligase (GCL)) while releasing CO2; 2) reduction of tartronate semialdehyde by tartronate semialdehyde reductase (requiring one NADH) to glycerate. Compared with the native photorespiratory pathway (which converts glyoxylate to glycine in peroxisome and decarboxylates glycine in the mitochondrion), NH3 release is prevented and, if this pathway can be implemented in the chloroplast, CO2 release is localised to the chloroplast and is more likely to be re-assimilated by Rubisco instead of escaping to the atmosphere.
To implement the pathway in the chloroplast, a targeting sequence (e.g. Arabidopsis Rubisco small subunit (RbcS) or phosphoglucomutase transit peptide sequence) needs to be added to the N terminus of the gene constructs of the desired enzymes. In addition, the enzyme(s) that converts glycolate to glyoxylate also need(s) to be imported to the chloroplast. In normal plants, this conversion is catalysed by glycolate oxidase in peroxisome, and the same enzyme can be targeted to the chloroplast. However, glycolate oxidase is inefficient, as it uses O2 as the hydrogen acceptor, which wastes reducing power. In addition, its reaction generates H2O2, which needs to be broken down by catalase. A more efficient bacterial enzyme, glycolate dehydrogenase (GDH), can be used to replace glycolate oxidase’s role. GDH uses NAD+ instead of O2 as the hydrogen acceptor, which prevents production of toxic H2O2 and preserves reducing power.
According to the scheme described above, Kebeish et al. (2007) generated plants transformed with five chloroplast-targeted bacterial genes encoding glycolate dehydrogenase, glyoxylate carboligase and tartronic semialdehyde reductase (Figure 2.1, 1). In these plants, some glycolate is successfully converted directly to glycerate in chloroplasts, and reduces, but not eliminate, flux of photorespiratory metabolites through peroxisomes and mitochondria. The transgenic plants grew faster, produced more shoot and root biomass, and the content of soluble sugars (fructose, glucose and sucrose) increases significantly.
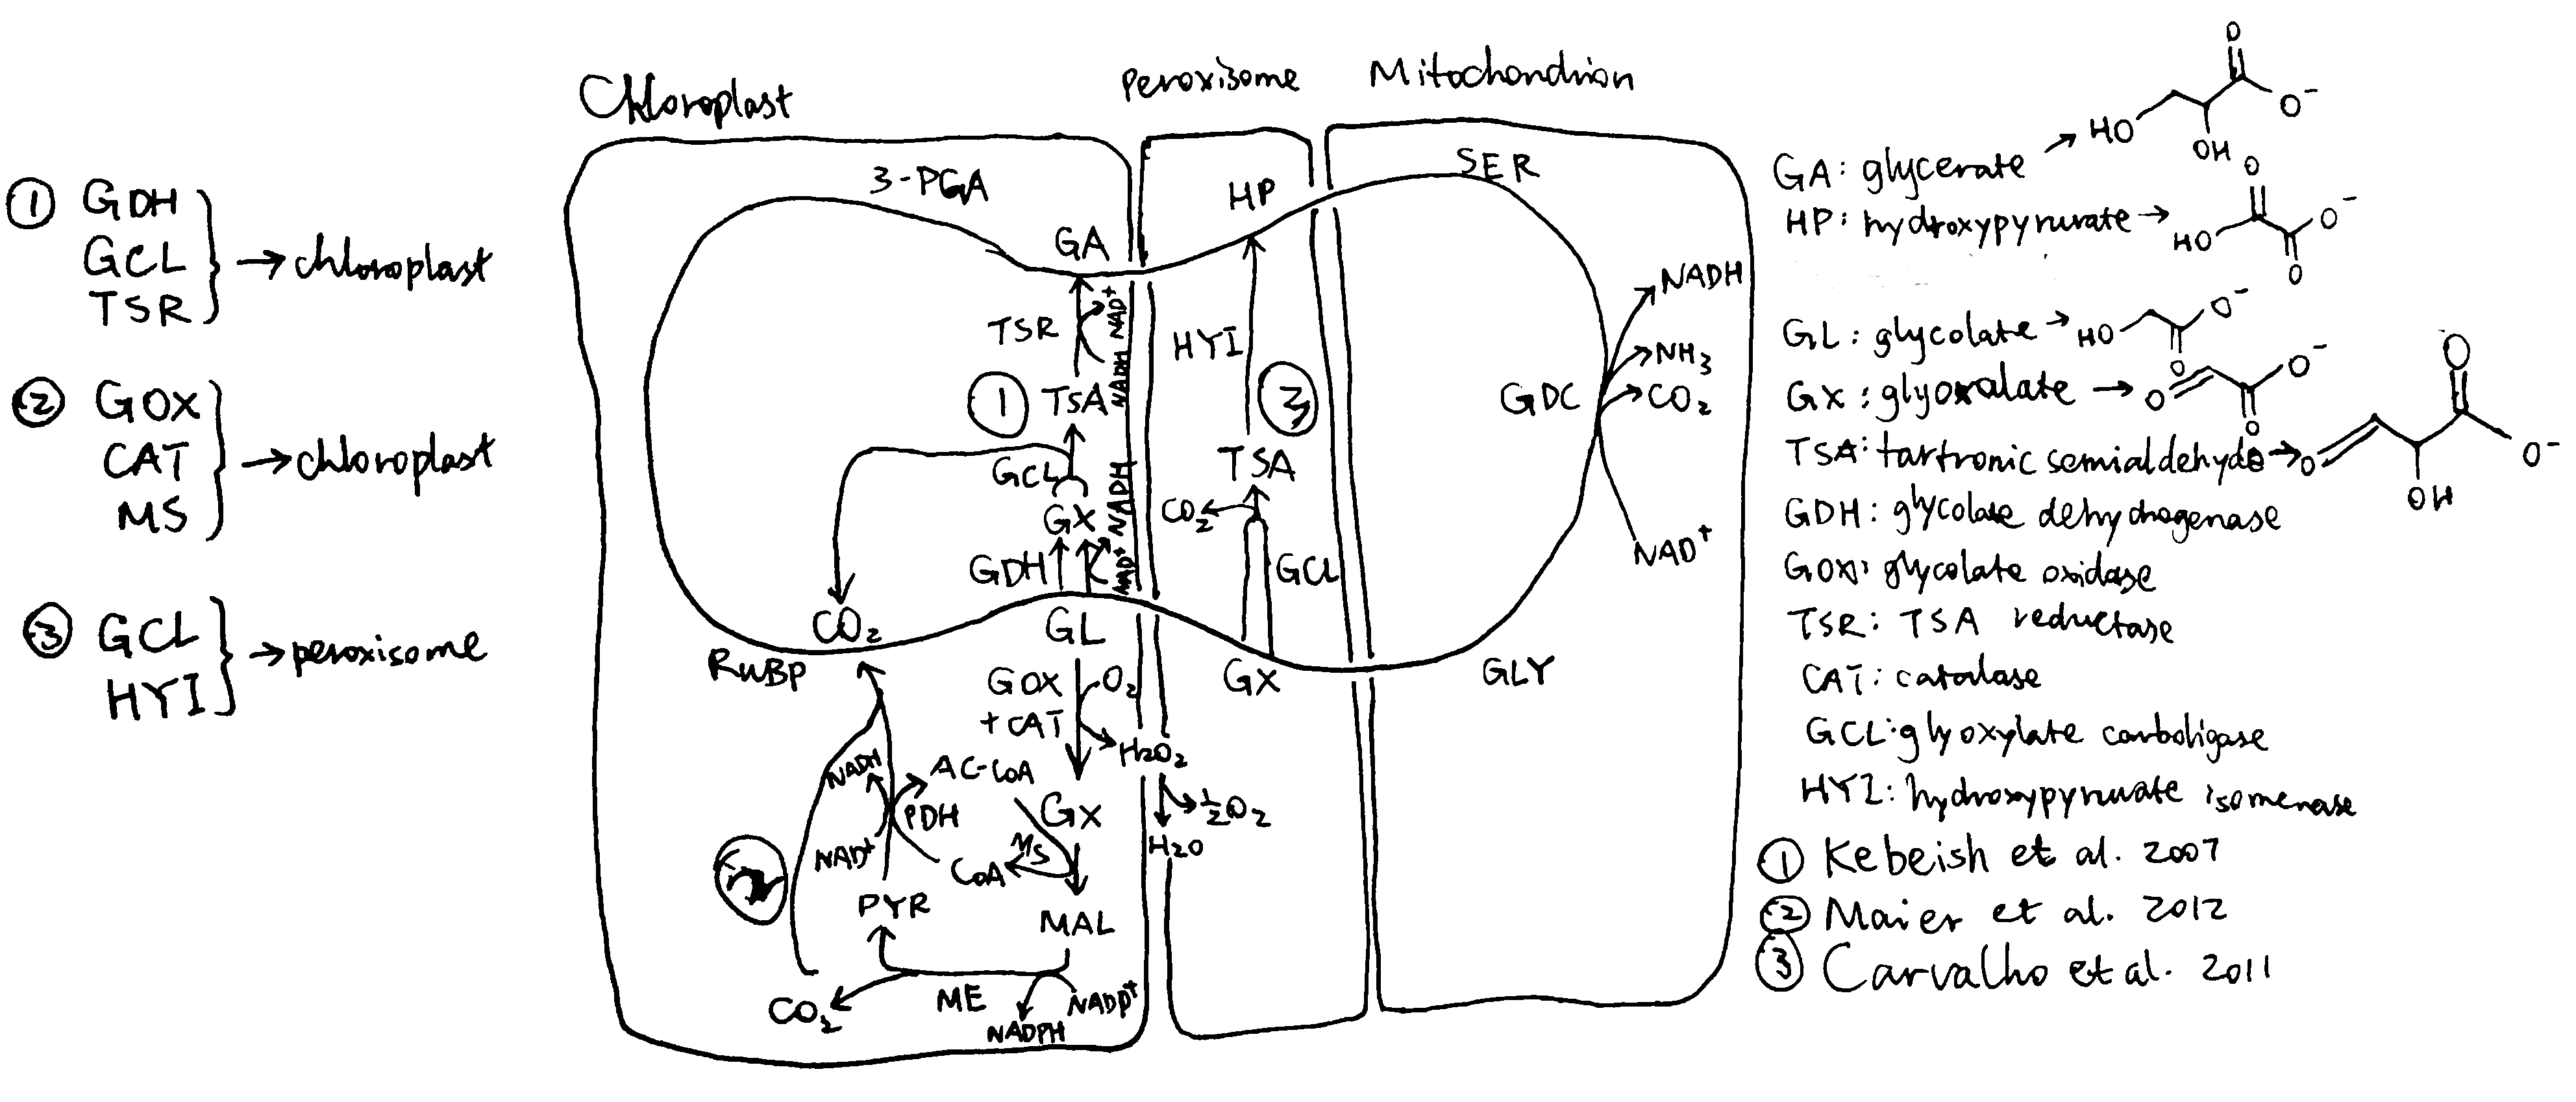
Figure 2.1: Three photorespiratory bypasses. The loop represents the native pathway.
Carvalho et al. (n.d.) designed a similar photorespiratory bypass (Figure 2.1, 3). It also uses tartronate semialdehyde (TSA) as the intermediate and thus prevents NH3 production. However, the CO2-releasing TSA synthesis reaction occurs in the peroxisome rather than in the chloroplast and therefore this mechanism does not have the additional benefit of reducing CO2 loss. In the peroxisome, TSA is converted to hydroxypyruvate by hydroxypyruvate isomerase (HYI), and the rest is identical to the native pathway. Unfortunately, all plants fail to express HYI, and for those with GCL expressed, chlorosis and stunted growth are exhibited, similar to photorespiration mutants. (I think one statement regarding this piece of research at the end of page 808 of the review written by Weber and Bar-Even (2019) is not appropriate, as HYI was not even expressed)
Maier et al. (2012) used a completely different approach. Instead of taking shortcuts within the native photorespiratory pathway with 3-PGA being the final product, they introduced glycolate oxidase, catalase and malate synthase into the chloroplast, which, together with pyruvate dehydrogenase and malic enzyme which are natively present in the chloroplast, completely oxidise glycolate into two CO2 (Figure 2.1, 2), while producing NADPH and NADH. Although this pathway requires more energy than the native pathway to restore the ‘status quo ante’ according to the calculation (see Peterhansel, Blume, and Offermann (n.d.), Table 2), and is shown in computational modelling to result in a 31% decrease in photosynthetic efficiency compared to WT (Xin et al. 2015), experimental studies on Arabidopsiis thaliana surprisingly revealed an increase in biomass in these transgenic plants. A modified version of this approach carried out later on tobacco plants by South et al. (2019) were shown to be even more successful than Kebeish’s approach which was calculated to be the most energy-efficient. The success of Maier’s method may be explained by thhe fact that, in hot climates (where sunlight is intense), ATP and NADPH supply from light reactions is often not limiting, so an improved energy balance in photorespiration does not necessarily improve the rate of carbon fixation. Instead, the benefit brought about by the rapid CO2 generation in this bypass is more important. In addition, it is argued that the ‘wasteful’ dissipation of reducing power by glycolate oxidase may actually be beneficial in avoiding production of reactive oxygen species (ROS) in high light intensity, when the output of light reactions is in large excess. This also explains why higher plants prefer glycolate oxidase rather than glycolate dehydrogenase.
2.2 Inhibition of the Glycolate Transporter
In the two successful photorespiratory bypasses described above, glycolate metabolism inside chloroplast competes with its export via the glycolate exporter PLGG. Therefore, repression of this transporter is expected to increase the flux into the bypasses and thus further increase the efficiency. South et al. (2019) studied the effect of RNAi inhibition of PLGG1 in these two methods as well as a ‘combined’ scheme of the two. The constructs and mechanisms of action are shown in Figure 2.2. Both AP1 and AP3 (but not AP2) showed significant increase in dry weight biomass, by 13% and 18%, respectively. When the PLGG1 RNAi module is added, the benefit of AP1 is lost, while that of AP3 increases to 24% (Weber and Bar-Even (2019) implied, on page 808 when citing this work, that inhibition of PLGG always increases efficiency, which is not correct).
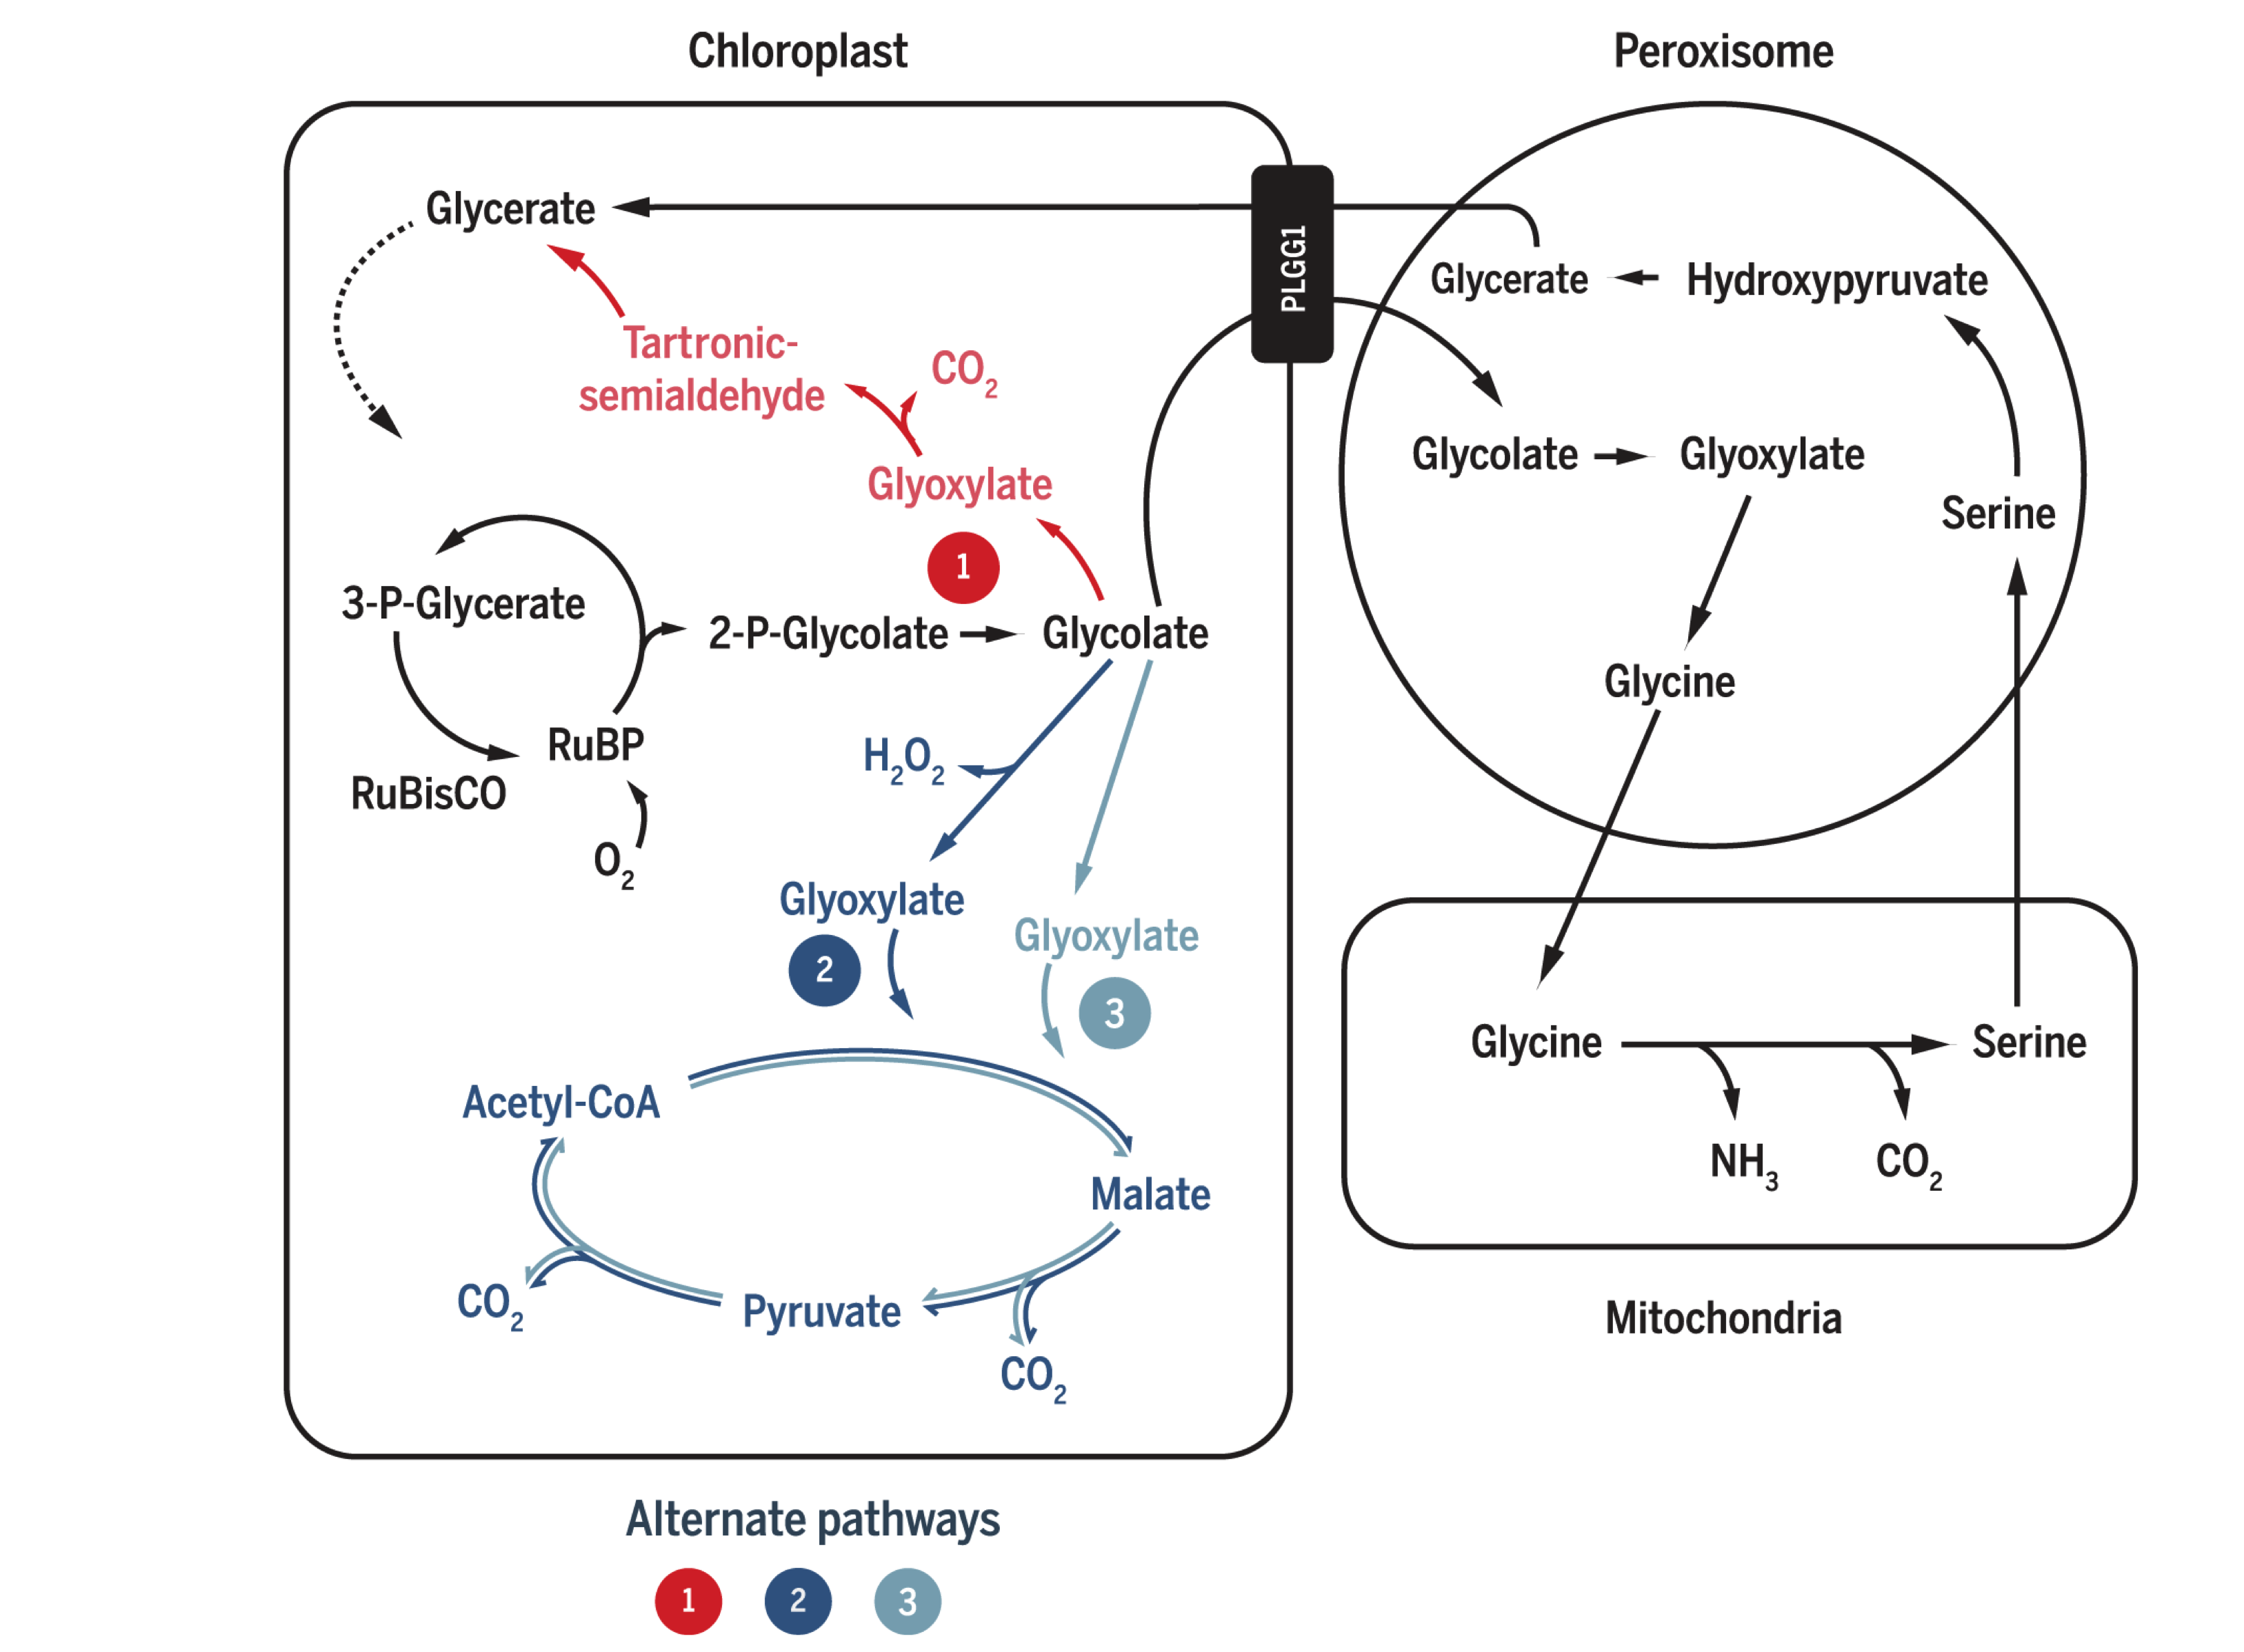
Figure 2.2: South’s (2019) three photorespiratory bypass constructs. AP1: five bacterial genes encoding glycolate dehydrogenase (GDH), glyoxylate carboligase and tartronic semialdehyde reductase (same as Kebeish (2007)); AP2: glycolate oxidase (GOX), malate synthase and catalase (CAT) (same as Maier (2012)); AP3: same as AP2, except that GOX+CAT is replaced by GDH.
Elimination of the AP1 enhancements by the PLGG1 RNAi module implies that this introduced pathway ‘may not have had sufficient kinetic capacity to handle the full glycolate flux under high rates of Rubisco oxygenation’, according to South et al. (2019). This is in accordance with the aforementioned statement that the efficiency of photorespiratory bypasses in accelerating carbon fixation does not depend on energy economy (conservation of ATP and NADPH), but instead on the rate of conversion of 2-PG into TCA cycle intermediates (CO2 and/or 3-PGA). That is to say, the real culprit for photorespiration-induced reduction in carbon fixation activity is not loss of energy in the form of ATP and NADPH, but is likely to be the inefficiency of removing 2-PG, as well as the low CO2:O2 ratio. Thus, in South’s AP3 construct where 2-PG is efficiently cleared up and CO2 is produced in a large amount, the most prominent increase in carbon fixation and biomass is observed.
3 Conclusion
Photorespiration has long been a target for improving photosynthesis and crop yield. Several photorespiratory bypasses, which provide alternative, more efficient pathways to complement or replace the native pathway, have proved successful for this goal in model plants. Much is yet to be known about the mechanisms by which these bypasses accelerates photosynthesis, but recent experiments suggests that, in contrast to the traditional view that photorespiration is energy-wasting and should be avoided, increasing the flux through the photorespiration pathway might instead speed up carbon fixation. Also, conclusion obtained from computational modelling should be viewed with care, at least in photorespiratory studies, as the seemingly sensible assumptions they make often results in significant deviations from the experimental results.
References
Carvalho, Josirley de F C, Pippa J Madgwick, Stephen J Powers, Alfred J Keys, Peter J Lea, and Martin A J Parry. n.d. “An Engineered Pathway for Glyoxylate Metabolism in Tobacco Plants Aimed to Avoid the Release of Ammonia in Photorespiration.” BMC Biotechnol 11. Embrapa Soybean, Londrina, Paraná, Brazil, Rodovia Carlos Strass, Distrito da Warta, Londrina PR, Brasil.: 111. https://doi.org/10.1186/1472-6750-11-111.
Kebeish, Rashad, Markus Niessen, Krishnaveni Thiruveedhi, Rafijul Bari, Heinz-Josef Hirsch, Ruben Rosenkranz, Norma Stäbler, Barbara Schönfeld, Fritz Kreuzaler, and Christoph Peterhänsel. 2007. “Chloroplastic Photorespiratory Bypass Increases Photosynthesis and Biomass Production in Arabidopsis Thaliana.” Nat Biotechnol 25 (5). RWTH Aachen, Institute of Biology I, Worringer Weg 1, 52056 Aachen, Germany.: 593–99. https://doi.org/10.1038/nbt1299.
Maier, Alexandra, Holger Fahnenstich, Susanne Von Caemmerer, Martin Engqvist, Andreas Weber, Ulf-Ingo Flügge, and Veronica Maurino. 2012. “Transgenic Introduction of a Glycolate Oxidative Cycle into a. Thaliana Chloroplasts Leads to Growth Improvement.” Frontiers in Plant Science 3: 38. https://doi.org/10.3389/fpls.2012.00038.
Peterhansel, Christoph, Christian Blume, and Sascha Offermann. n.d. “Photorespiratory Bypasses: How Can They Work?” J Exp Bot 64 (3). Leibniz University Hannover, Institute of Botany, Herrenhaeuser Straße 2, 30419 Hannover, Germany. cp@botanik.uni-hannover.de: 709–15. https://doi.org/10.1093/jxb/ers247.
South, Paul F, Amanda P Cavanagh, Helen W Liu, and Donald R Ort. 2019. “Synthetic Glycolate Metabolism Pathways Stimulate Crop Growth and Productivity in the Field.” Science 363 (6422). Global Change; Photosynthesis Research Unit, United States Department of Agriculture-Agricultural Research Service, Urbana, IL 61801, USA.; Carl R. Woese Institute for Genomic Biology, University of Illinois, Urbana, IL 61801, USA.; Carl R. Woese Institute for Genomic Biology, University of Illinois, Urbana, IL 61801, USA.; Department of Crop Sciences, University of Illinois, Urbana, IL 61801, USA.; Global Change; Photosynthesis Research Unit, United States Department of Agriculture-Agricultural Research Service, Urbana, IL 61801, USA. d-ort@illinois.edu.; Carl R. Woese Institute for Genomic Biology, University of Illinois, Urbana, IL 61801, USA.; Department of Crop Sciences, University of Illinois, Urbana, IL 61801, USA.; Department of Plant Biology, University of Illinois, Urbana, IL 61801, USA. https://doi.org/10.1126/science.aat9077.
Weber, Andreas P.M., and Arren Bar-Even. 2019. “Update: Improving the Efficiency of Photosynthetic Carbon Reactions.” Plant Physiology 179 (3). American Society of Plant Biologists: 803–12. https://doi.org/10.1104/pp.18.01521.
Xin, Chang-Peng, Danny Tholen, Vincent Devloo, and Xin-Guang Zhu. 2015. “The Benefits of Photorespiratory Bypasses: How Can They Work?” Plant Physiology 167 (2). American Society of Plant Biologists: 574–85. https://doi.org/10.1104/pp.114.248013.
To what extent has genetic manipulation of the Calvin cycle forced the reappraisal of our understanding of the control of metabolic pathways in plants? What do studies of these transgenic plants reveal about the integration of metabolism?
1 Introduction
Genetic manipulation, particularly graded knock-down of enzymes in the Calvin cycle, has been exploited in the quest for understanding the control of the rate of carbon fixation step of photosynthesis. While initially it was thought that the flux of carbon fixation is limited by a few ‘regulated’ enzymes, with Rubisco being the most promising candidate, many unexpected experimental results revealed that, in reality, the flux of the Calvin cycle is influenced by multifarious factors, some of which are even due to other carbohydrate-unrelated pathways.
1.1 Rubisco Does not Exert Much Control on the Flux of the Calvin Cycle Unless in Special Conditions
Rubisco catalyses the carbon fixation step in the Calvin cycle and was initially widely thought to act as a control point on the rate of photosynthesis. Indeed, the enzymatic activity of Rubisco is modulated by a number of ways, such as activation by resersible carbamylation by CO2 and by Rubisco activase, and inhibition by a number of sugars resulting from Rubisco’s side reactions.
1 produced a series of tobacco plants (Nicotiana tabacum) that exhibit a range of reduced amounts of Rubisco by Agrobacterium-mediated transformation of plants with antisense mRNA to the gene for the small subunit of Rubisco (rbcS). Such ‘antisense’ plants were used by2 to examine the control exerted by Rubisco on the rate of photosynthesis. They found that in optimum enviornmental conditions the amount of Rubisco in a leaf could be reduced by more than one-third before any significant effect on the rate of photosynthesis, with \(C^J\) = 0.05-0.15 (very small). It was shown that reduction of enzyme amount is compensated for by an increase in Rubisco activation (from about 55% to almost 100%) due to 1) an increase of substrates (ribulose 1,5-bisphosphate and CO2) and decrease of products (3-phosphoglycerate), and 2) an increase of ATP/ADP ratio in the chloroplast stroma. Also, Rubisco is produced in large excess in WT plants, also explaining the lack of impact of its knock-down.
However, when plants were grown in low light and are then suddenly exposed to high light intensity, there was a near-proportional relation between the amount of Rubisco and the rate of photosynthesis3. A similar result can be obtained with low CO2 concentration. These experiments show that the contribution of Rubisco to the control of photosynthesis depends on both current and past conditions (CO2 concentration and light intensity).
2 Other Enzymes that Catalyse Irreversible Reactions
Apart from Rubisco, three other enzymes in the Calvin cycle catalyse irreversible reactions: (stromal) fructose 1,6-bisphosphatase (FBPase), sedoheptulose 1,7-bisphosphatase (SBPase) and phosphoribulokinase (PRK). These three enzymes are subjected to a same set of ‘fine’ regulatory mechanisms, all of which are exploited by the light reaction to activate the Calvin cycle:
- pH. These enzymes have a relatively sharp pH optimium at around 8.2.
- Mg2+ stimulation.
- Redox state. These enzymes are inactive when disulfide bridges form between certain cysteine residues, and are activated by (reduced) thioredoxin, which reduces these disulfide bonds.
Analysis of plant strains with each of these three enzymes knocked down reavealed that transformants with decreased SBPase activity show a significant but still non-proportional inhibition of photosynthesis4 in ambient conditions, while the effects of FBPase and PRK knock-down are marginal. Therefore, enzymes with similar regulatory properties does not indicate they have similar flux-control capabilities in a metabolic pathway.
3 Plastid Aldolase as an ‘Non-Regulated’ Enzyme Exerts a Greater Control than Rubisco on the Rate of Photosynthesis
In the Calvin cycle, aldolase carries out the synthesis of fructose 1,6-bisphohsphate (FBP) and sedoheptulose 1,7-bisphohsphate (SBP), both of which are close to equilibrium. Unlike the four enzymes described previously, aldolase’s activity is devoid of any regulatory properties and thus its rate is solely determined by the concentrations of substrates and products.
However, similar knock-down experiments targeting aldolase showed unexpected results, in that reduction in aldolase was found to significantly reduce the rate of photosynthesis5. A 30% decrease of aldolase activity in potato transformants led to a small (5–10%) inhibition of ambient photosynthesis, and reduction below 30% of the wild-type activity led to a severe inhibition. The experiment is repeated with different light intensities and CO2 concentrations, and it was found that the inhibition is smallest in low light and highest in high light and elevated CO2 (with \(C^J\) of about 0.18 and 0.56, respectively).
Decreased expression of aldolase inhibits photosynthesis for different reasons in low and high light. In low light, decreased expression of aldolase led to an accumulation of its substrate, triose phosphates and a depletion of of its product, which in turn causes the depletion of RuBP. In high light (plus elevated CO2), however, the triose phosphates remained very low, RuBP remained high, and PGA was higher in the transformants than in wild-type plants. This is because high irradiation inhibits starch synthesis and hence accumulation of phosphorylated intermediates, which leads to Pi-limitation, which in turn restricts ATP regeneration by the light reaction. The decreased ATP concentration thhen limits conversion of 3PGA to GAP, causing 3PGA to accumulate, which in turn results in product inibition of Rubisco. Of course, the two mechanisms are not mutually exclusive, and the relative importance of each vary gradually according to the light intensity.
It is important to note here that, to fully rationalise the difference in the effectiveness of inhibition of the Calvin cycle in different conditions, the effect of the conditions on other pathways (starch synthesis) in the metabolic network need also be considered.
4 Transketolase Directly Controls not Only Calvin Cycle but Also Other Pathways
Perturbation of the enzymes involved in the central carbohydrate metabolism pathways can directly influence the activity of other pathways. Transketolase is such an example.
In the Calvin cycle, transketolase catalyses the reactions 1) \(F6P + GAP \rightarrow E4P + X5P\) and 2) \(S7P + GAP \rightarrow X5P + R5P\), both of which are reactions close to equilibrium. Tobacco tranformant with decreased expression of plastid transketolase were also produced. Like aldolase, this ‘non-regulated’ enzyme also has a relatively high flux-control coefficient, especially in saturating light and CO2. As expected, loss of transketolase activity results in an increase in the amounts of its substrate (F6P) and decrease of its products, ultimately leading to a decrease of RuBP concentration. However, it was also observed that there was a significant decrease in the levels of aromatic amino acids, intermediates of the phenylpropanoid pathway, and secondary products such as chlorogenic acid and lignin. A plausible explanation for these observations is that the flux into the shikimic acid pathway (which synthesises aromatic pathways) is limited by the decreasing erythrose 4-phosphate (one product of transketolase) concentration.
The multiple consequences of reducing transketolase activity highlight the extent of integration within thhe central metabolic pathways and the potential difficulties in attepting to modify flux through a specific section of the metabolic network.
5 Conclusion
Genetic manipulation (mainly knock-outs) of some enzymes of the Calvin cycle qualitatively revealed some of the logic behind the regulation of (plant) metabolism in general: 1) loss of regulated enzymes such as Rubisco are compensated by increase in activity, 2) regulated enzymes are often produced in excess so that minor reduction in their amount does not affect the flux at all, 3) non-regulated enzymes such as aldolase are not produced in excess, and their loss restricts the flux more effectively, 4) the extent and the mechanisms of influence on Calvin cycle flux by reduction of an enzyme is affected by enviornmental conditions and the developmental history of the plant, 5) perturbation of a single reaction/enzyme can influence other, even distantly-related metabolic pathways, due to the plethora of interconnected components, 6) the flux through the Calvin cycle is determined by multiple enzymes.
Lots of effort has been made in modelling plant metabolism pathways such as the Calvin cycle (in order to ‘improve’ them), which proves extremely difficult. The Calvin cycle does not exist in isolation, so natually its flux is also influenced by other pathways in the complicated plant metabolism network, through shared intermediates/enzymes/regulatory molcules. Therefore, the precise prediction of its activity, in principle, also requires modelling of other, even distantly related pathways. However, it is impossible to presisely predict the behaviour of the entire metabolic network without knowing all the details (kinetic properties under different conditions, concentrations of enzymes and substrates, etc.) of every reaction in the network. Even if precise kinetic data of enzymes and concentrations of all substances can be obtained, further challenges will be encountered when considering in vivo modelling: unlike the test tube where all substances are relatively evenly distributed and there is only one single isolated compartment, the plant cells are extensively compartmentalised (many metabolic pathways take place in more than one compartments), and substances (substrate or enzymes) may not be evenly distributed and instead localise to specific regions of each compartment, thus altering the effective concentration. In addition, the effects of the internal and external enviornment (e.g. signalling molecules, light intensity) on gene expression of enzymes are also difficult to simulate.
References
1. Rodermel, S. R., Abbott, M. S. & Bogorad, L. Nuclear-organelle interactions: Nuclear antisense gene inhibits ribulose bisphosphate carboxylase enzyme levels in transformed tobacco plants. Cell 55, 673–681.
2. Quick, W. P. et al. Decreased ribulose-1,5-bisphosphate carboxylase-oxygenase in transgenic tobacco transformed with "antisense" rbcS : I. Impact on photosynthesis in ambient growth conditions. Planta 183, 542–554.
3. Quick, W. P. et al. Decreased ribulose-1,5-bisphosphate carboxylase-oxygenase in transgenic tobacco transformed with "antisense" rbcS : IV. Impact on photosynthesis in conditions of altered nitrogen supply. Planta 188, 522–531.
4. Harrison, E. P., Willingham, N. M., Lloyd, J. C. & Raines, C. A. Reduced sedoheptulose-1,7-bisphosphatase levels in transgenic tobacco lead to decreased photosynthetic capacity and altered carbohydrate accumulation. Planta 204, 27–36 (1997).
5. Haake, V., Zrenner, R., Sonnewald, U. & Stitt, M. A moderate decrease of plastid aldolase activity inhibits photosynthesis, alters the levels of sugars and starch, and inhibits growth of potato plants. The Plant Journal 14, 147–157 (1998).
Why do plants co-ordinate the relative activities of Photosystems I and II and how is this co-ordination achieved?
1 Background
Photosystems I and II are photochemical complexes that harvest light energy to drive endergonic redox reactions. Their operation in series (PS-II then PS-II), known as the Z scheme, results in generation of oxygen from water via photolysis, ATP production via electron transport chain (ETC) and production of NADPH (reduction of NADP+), which is essential for providing reducing power in anabolic reactions such as photosynthesis, by ferredoxin-NADP+ reductase. PS-I can also operate alone, resulting in cyclic photophosphorylation, generating ATP only.
Each photosystem exists on the thylakiod membrane (PS-II mainly in grana lamellae; PS-I mainly in stroma lamellae) as a multisubunit pigment-protein complex (or a dimer thereof, in the case of PS-II) comprising a reaction centre (RC) core containing a pair of chlorophyll a molecules, which is surrounded by other accessory proteins as well as variable number of antenna complexes ((trimers of) LHC-II/LHC-I; also known as chlorophyll a/b light-harvesting complex ) containing accessory pigments (e.g. chlorophylls and carotenoids) that pass light energy to the reaction centre via resonance energy transfer. The reaction centre in PS-II preferentially absorbs red light at wavelength 680 nm and is thus referred to as P680; the reaction centre in PS-I, known as P700, preferentially absorbs far-red light.
The activities of two types of photosystems is determined both by the external factors, i.e. intensity and wavelength of light, as well as the the intrinsic factors which can be regulated by the plant cells, namely the number of PS-II/PS-I cores and the antenna complexes (and hence the amount of accessory pigments) associated with them. Such regulation can affect the absolute activities of PS-II and PS-I as well as their activities relative to each other.
2 Why is Coordination between Photosystems I and II Needed
Because the PS-I and PS-II complexes are not physically coupled (so their abundance can differ) and their light absorption properties differ (PS-I prefers longer wavelength), their activities are not directly related and are often different. The activities of the two photosystems relative to each other can be regulated using the mechanisms described in Section 3, but before that, the benefits of this regulation are considered here:
- Stoichiometry adjustment. PS-II and PS-I activities should ideally be equal, in order to maximise the efficiency of light utilisation for production of NADPH in vectorised electron flow, which would otherwise be limited by the slower photosystem. There is a need for this kind of adjustment when there is a change in light quality. Upon illumination by far-red light that preferentially activates PS-I (PS-I light), PS-I activity is greater than PS-II, so PS-II activity shhould be improved relative to PS-I. Conversely, illumination by PS-II light leads to hyperactive PS-II, and its activity should be reduced relative to PS-II. These two states are referred to state 1 and 2, respectively, and state transition is the process by which the plant adjusts relative activity of PS-II and PS-I in response to a change in state.
- Protection against photoinhibition. If PS-II activity exceeds PS-I activity, the rate of production of reactive oxygen species (ROS) is increased. However, recent studies on stn7 mutants argue against this role. Photodamage of PS-II is unavoidable even under nomal conditions, and it is repaired efficiently in healthy plants.
- Meeting increased requirement for ATP. If PS-I activity exceeds PS-II activity, the excess activity in PS-I results in cyclic electron flow (CEF), generating additional ATP. Theoretically, this may be exploited by the plant to meet increased demand for ATP. However, recent work revealed that CEF is controlled by the redox power and is independent of state transition: state 2 is neither sufficient nor required to promote CEF (Takahashi et al. 2013).
The discussion below, therefore, focuses on the role of photosystem coordination in stoichiometry adjustment.
3 How is Coordination between PS-I and PS-II Achieved
3.1 The Role of the Plastoquinone Pool
The oxidative status of the plastoquinone (PQ) pool reflects the relative activity of PS-II and PS-I, and is involved in the signalling pathway of both short-term and long-term coordination (described in Section 3.2 and 3.3, respectively).
Upon illumination by PS-I light (in state 1), PS-I activity is greater than PS-II, leading to oxidation of the plastoquinone pool (most plastoquinone molecules are in the oxidised form, PQ). Conversely, the plastoquinone pool becomes reduced upon preferential excitation of PS-II (Figure 3.1).
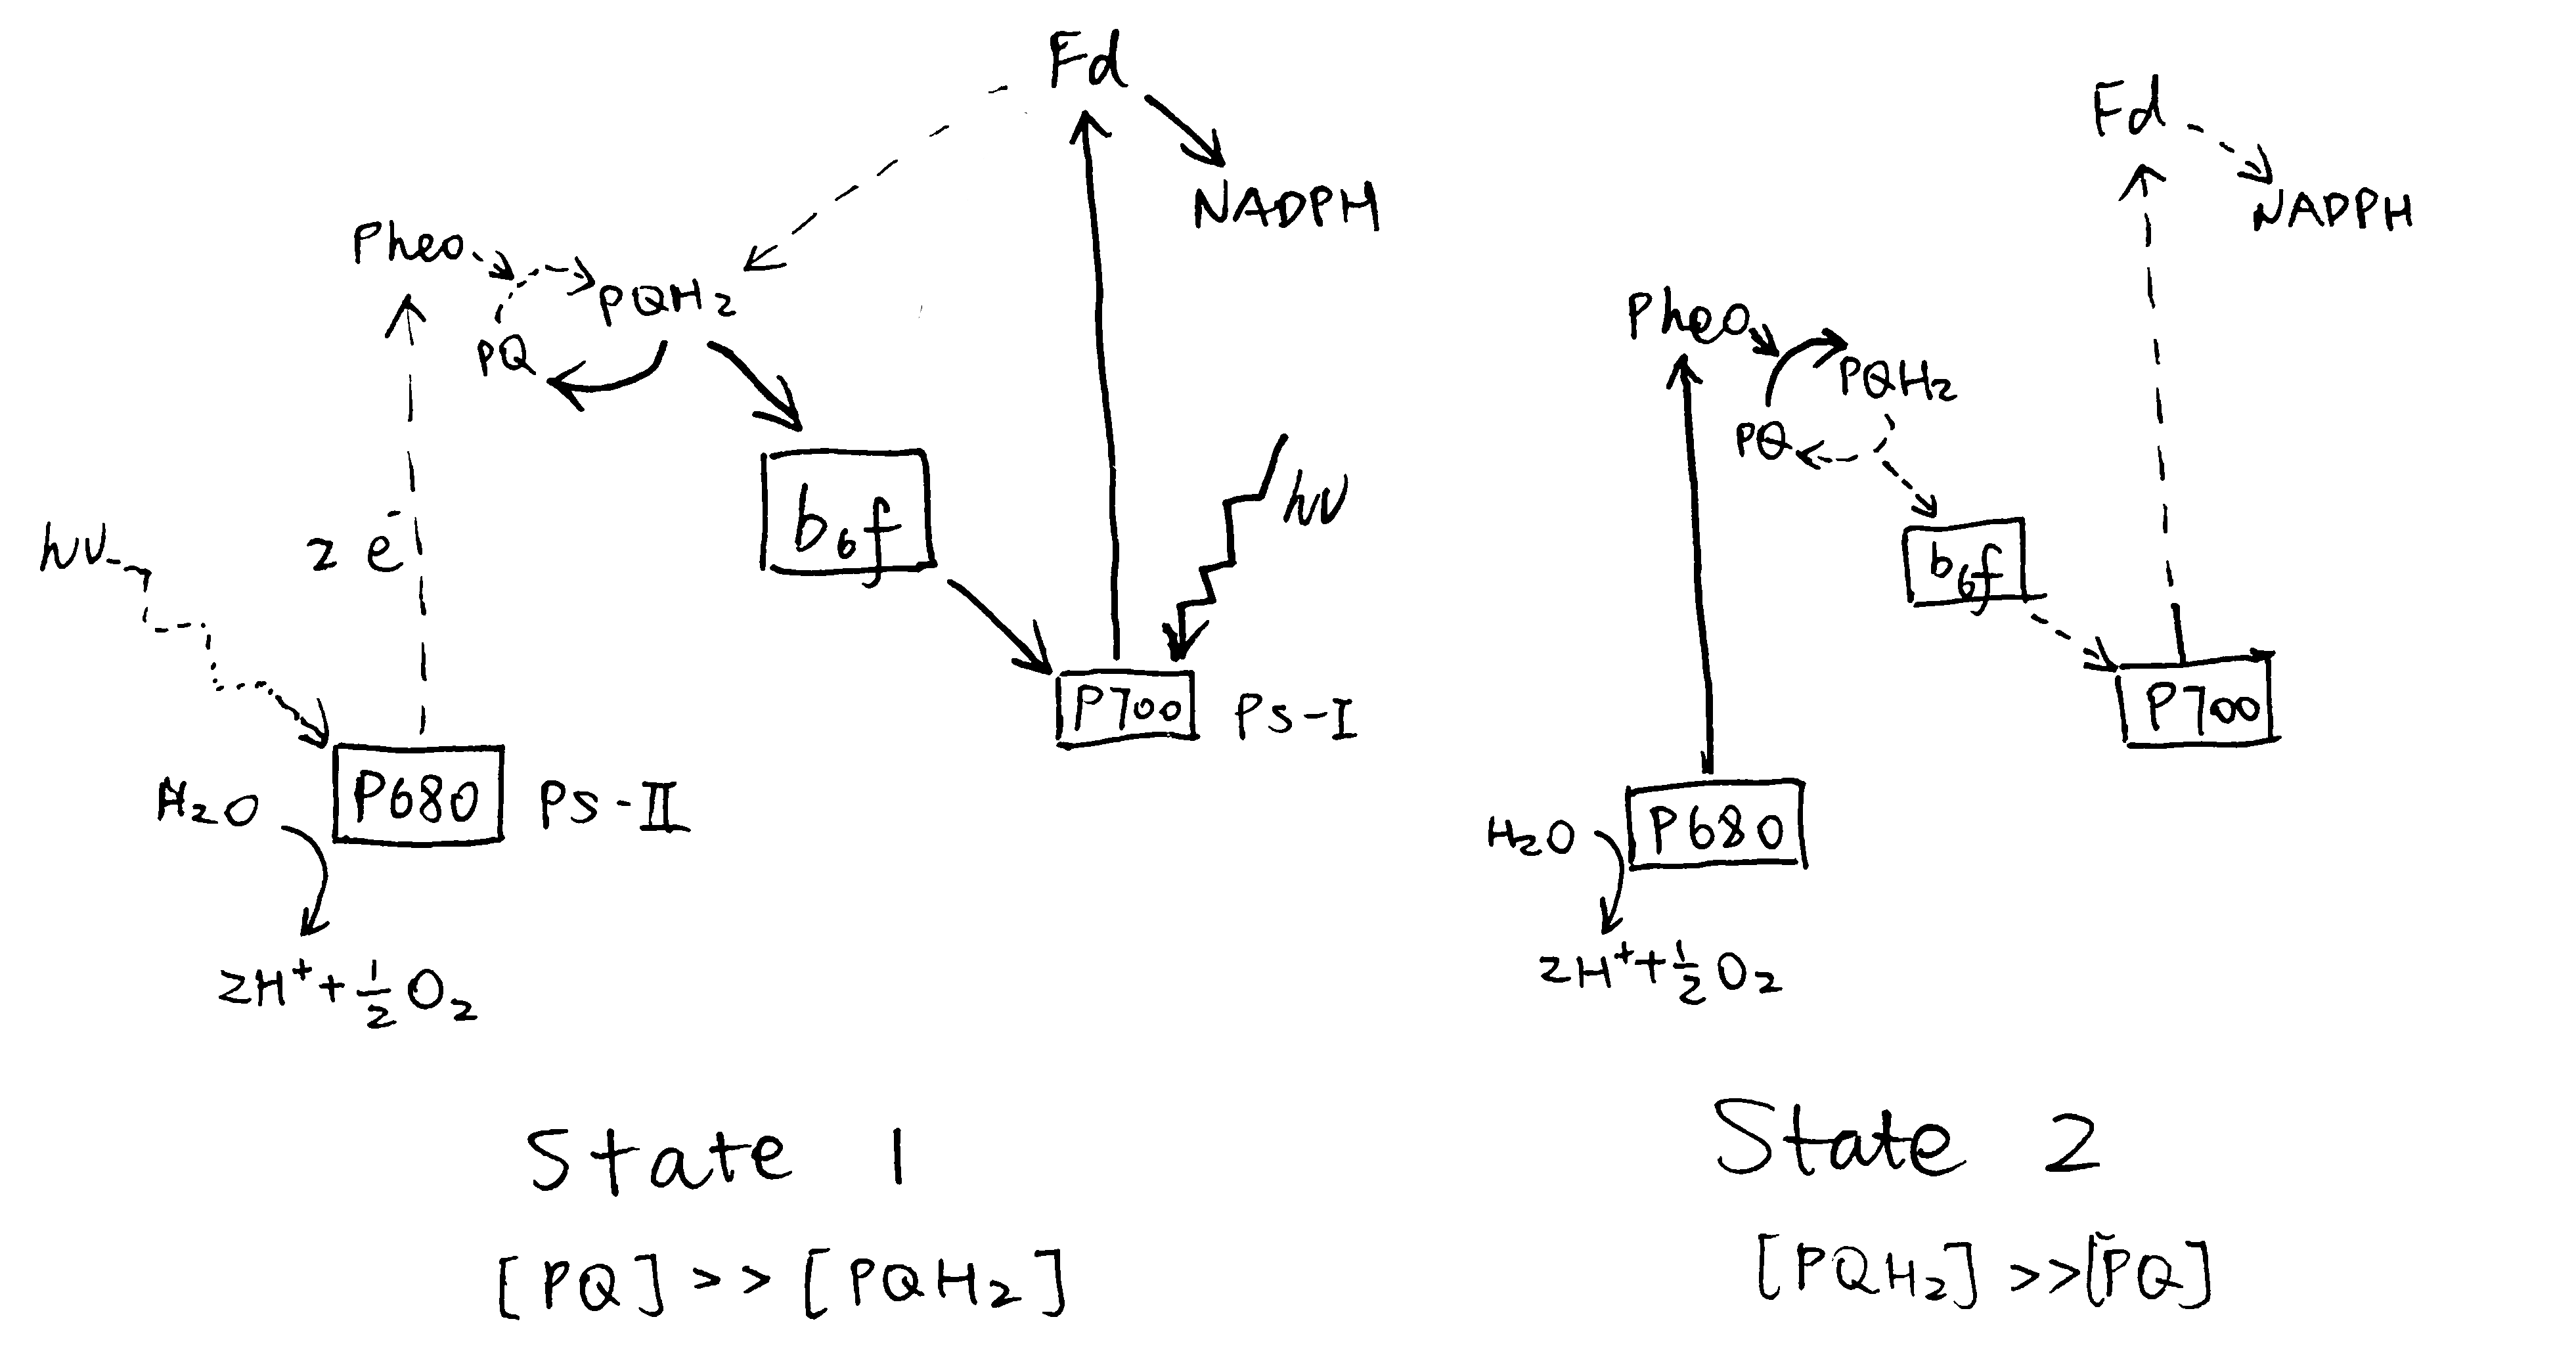
Figure 3.1: Preferential activation of either PS-I or PS-II causes a shift in the oxidation state of the plastoquinone (PQ) pool.
3.2 Reversible Redistribution of LHC-II
LHC-II plays an important role in the coordination between PS-I and PS-II. The structure of one LHC-II protein has been determined by a combination of electron microscopy and X-ray crystallography (reviewed by Barros and Kühlbrandt (2009)). It contains three membrane-spaning \(\alpha\)-helices, and binds about 15 chlorophyll a and b molecules plus a few carotenoids. LHC-II complexes of different subtypes (of which Lhcb1, 2 and 3 are the most common) spontaneously assemble into trimers (can be heterogeneous), which then associate with PS-II and PS-I to increase the efficiency of their corresponding photochemical reaction.
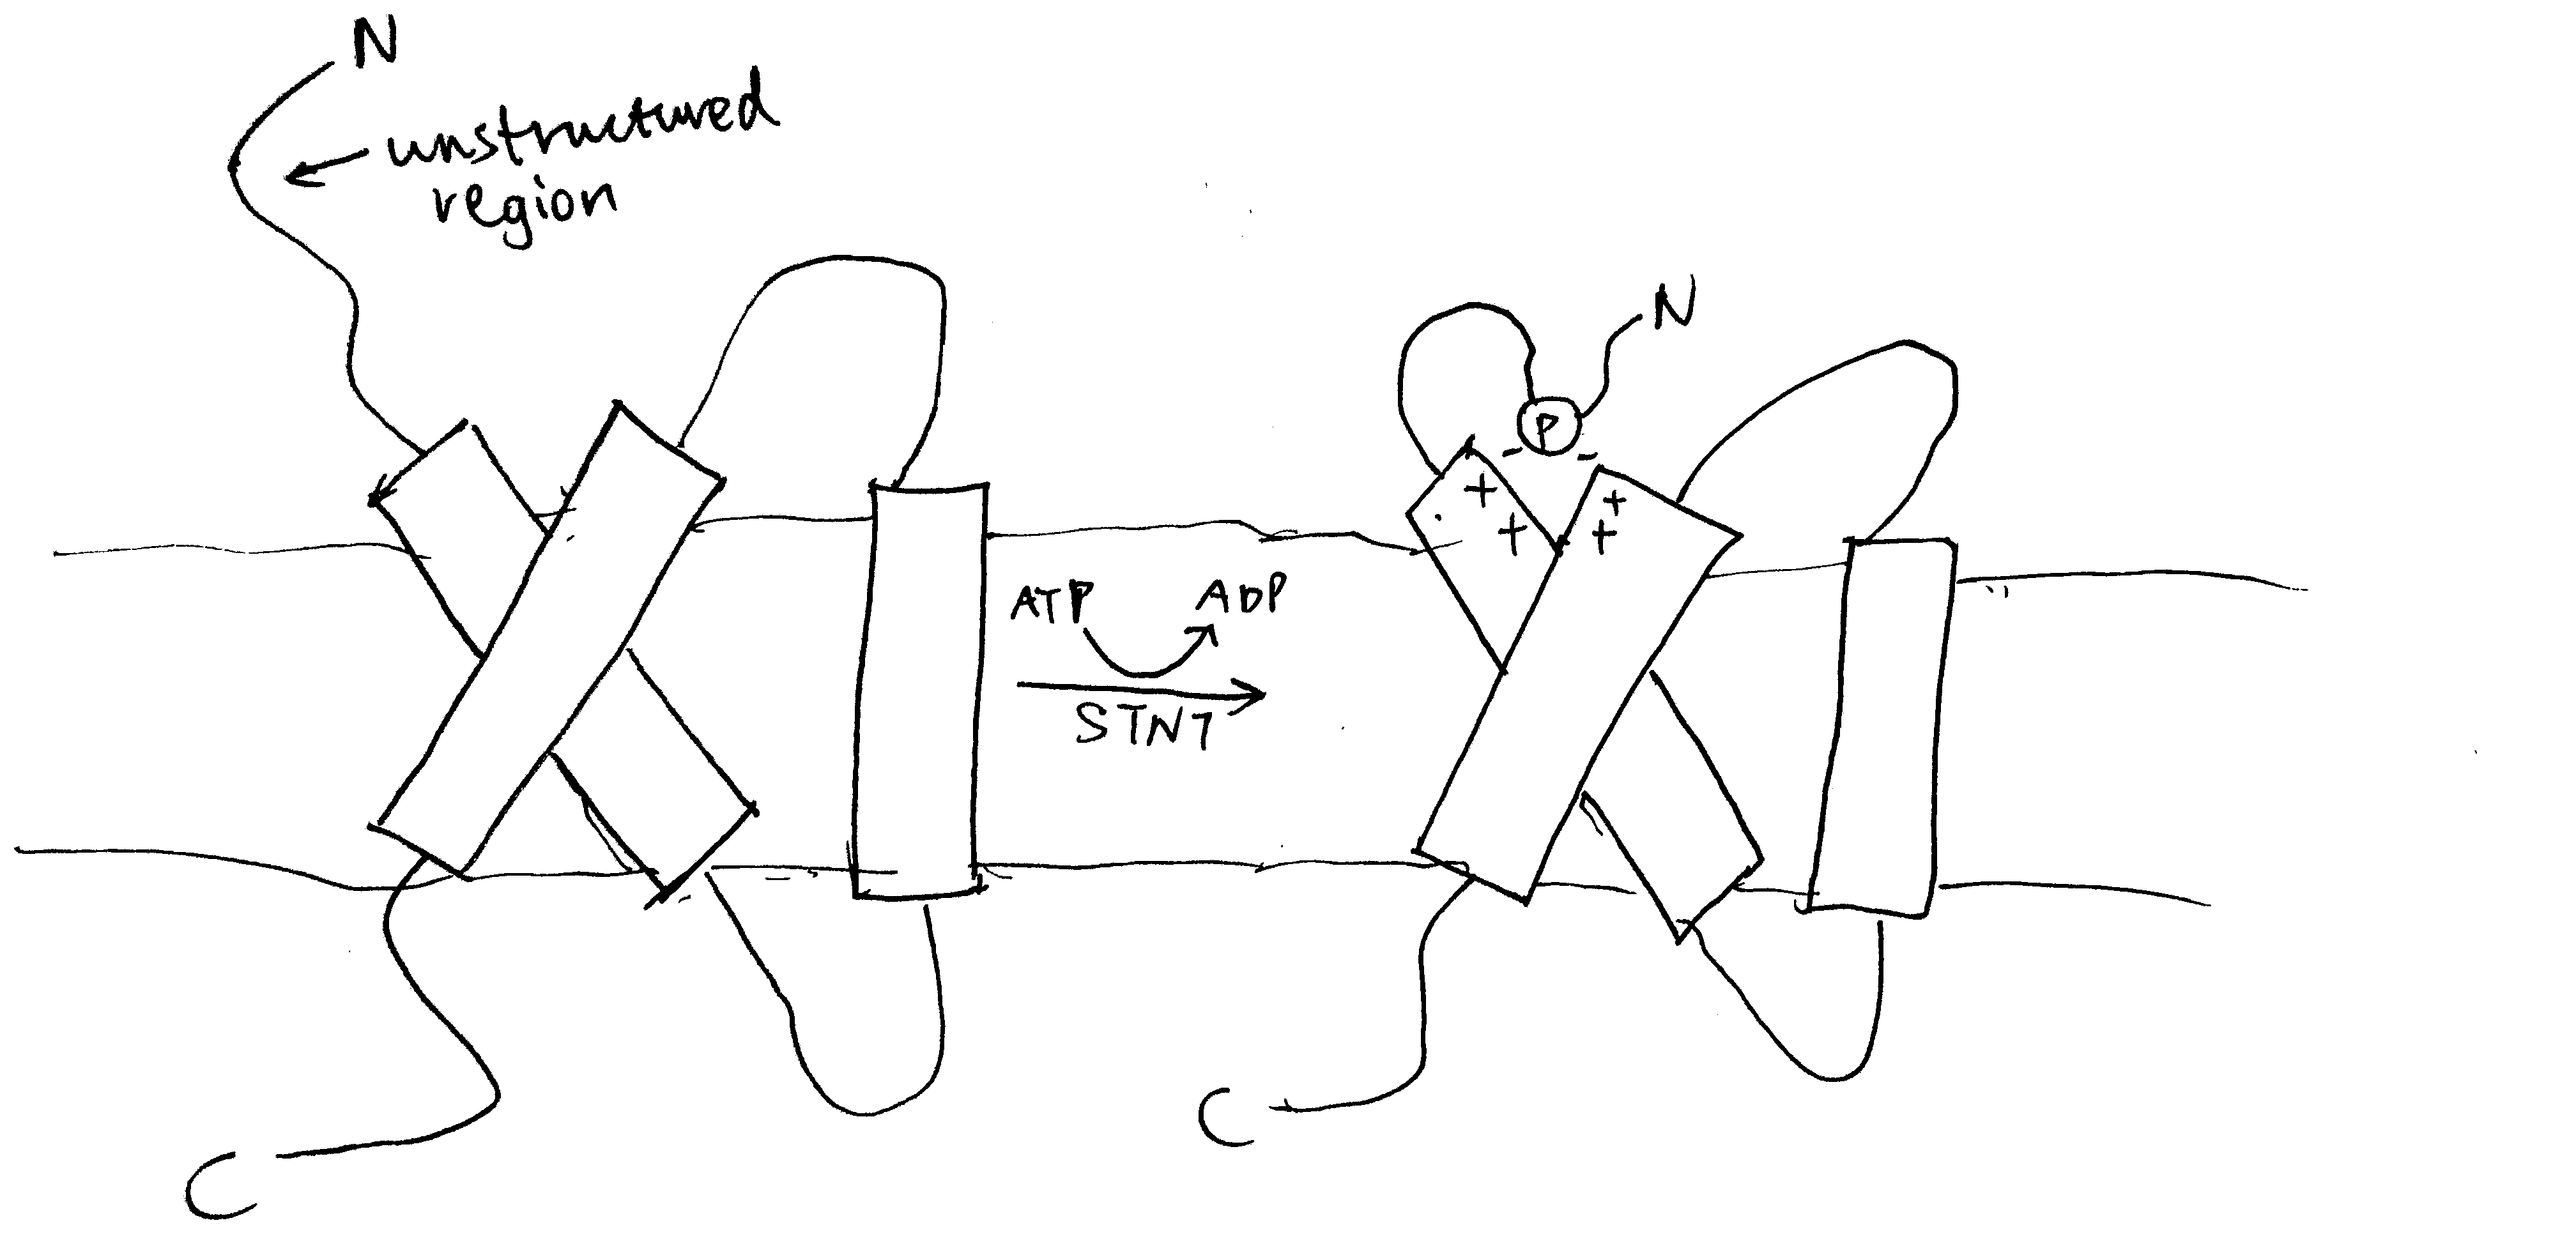
Figure 3.2: Phosphorylation by STN7 causes conformational changes in LHC-II. Top: stroma; bottom: thylakoid lumen.
The LHC-II subtypes Lhcb1 and Lhcb2 (but not Lhcb3) can be phosphorylated by a specific protein kinase called STN7 (a.k.a. Stt7) at a threonine residue near the N-terminus (Mullet 1983). This happens during transition to state 2, when the STN7 kinase, which is associated with a specific region of the Rieske protein of the cytochrome b6f complex (Cytb6f), is activated upon binding of PQH2 to the Qo site of Cytb6f. Phosphorylation on LHC-II causes a conformational change (Figure 3.2), reduces its affinity to PS-II and increases its affinity to PS-I. The increase in affinity to PS-I is due to not only the conformational change, but also the tight association between the phosphate group and a specific arginine residue in PsaL, a protein that facilitates docking of LHC-II to PS-I core complex. As a result, LHC-II migrates from PS-II towards PS-I, thus enhancing efficiency of PS-I relative to PS-II (Figure 3.3). This is supported by the findings that plants without either STN7 (Bellafiore et al. 2005) or Lhcb1+Lhcb2 (Andersson et al. 2003) do not undergo state transitions. It was later shown by Longoni et al. (2015) that only Lhcb2 phosphorylation is relevant to state transition (Lhcb1 phosphorylation causes its exclusion from the complex). The N-terminal region of phosphorylated Lhcb2 interacts with PsaL, PsaH and PsaO proteins, and PsaO bridges PsaA (PSI reaction centre) and Lhcb2 through contacts within the membrane and on the stromal and luminal surface. PsaO is associated with two chlorophyll molecules which facilitates resonance energy transfer from LHC-II to PsaA.
The phosphorylation can be reversed by a specific kinase called TAP38 (a.k.a PPH1). When PS-I is over-excited relative to PS-II, STN7 is inactive, and TAP38 dephosphorylates LHC-II and causes them to return to PS-II (Figure 3.3).
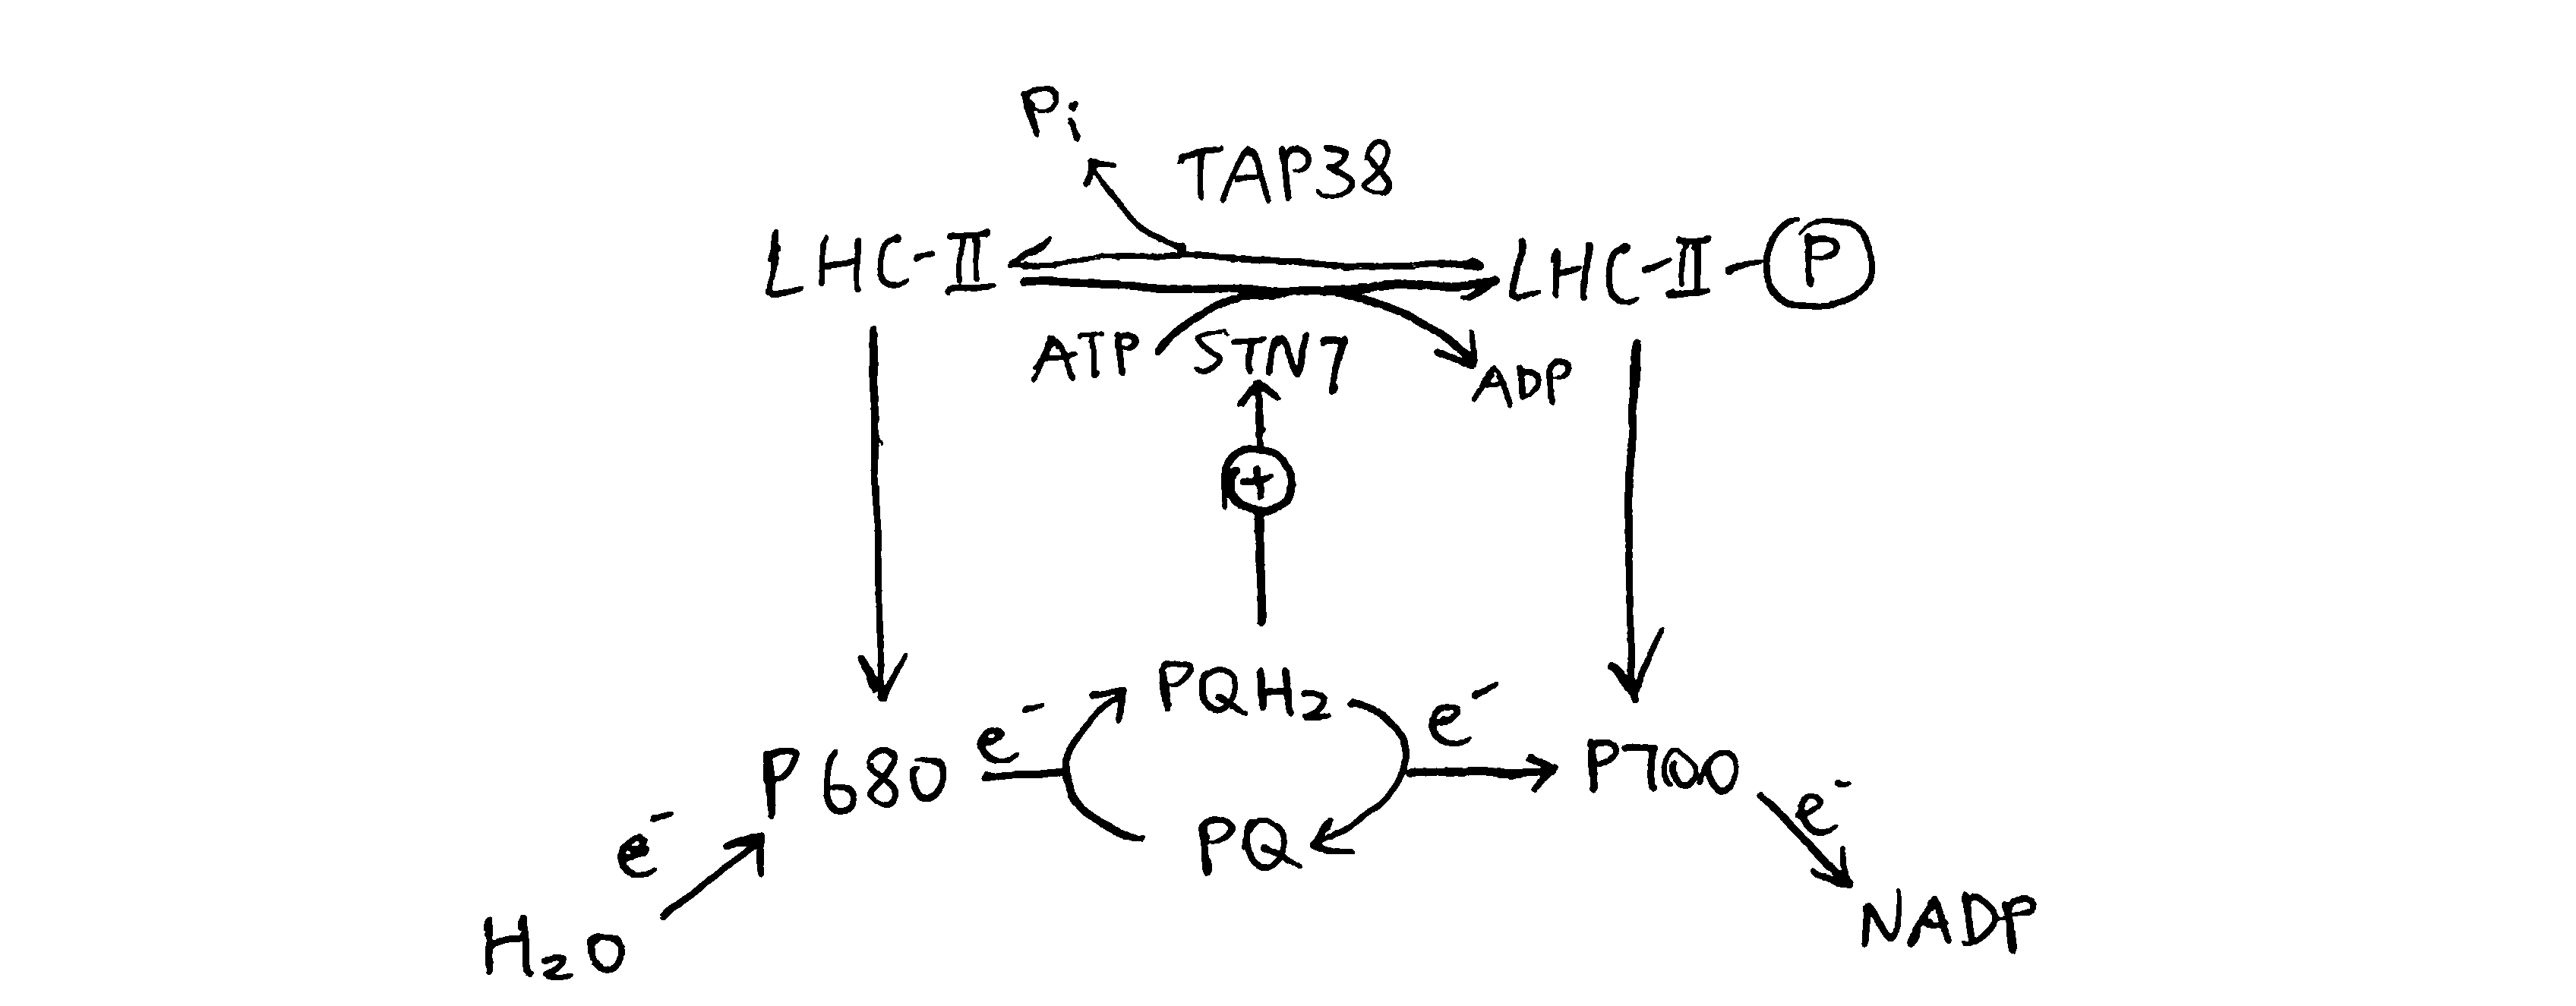
Figure 3.3: Oxidative status of plastoquinone determines the phosphorylation state of LHC-II, which in turn regulates relative activity of PS-I and PS-II.
3.3 Transcriptional Regulation
Regulation of relative activity of PS-I and PS-II can also be achieved by controlling the amount of transcription of PS-I genes (e.g. psaA) and PS-II genes (psbA).
Puthiyaveetil et al. (2008) described a sensor kinase called chloroplast sensor kinase (CSK) that couples oxidation state of PQ to transcriptional control of psbA. As shown in Figure 3.4, PS-I light causes the PQ pool to be oxidised, and then CSK, which is activated by PQ (the PQ analogue, DBMIB (2,5-dibromo-3-methyl-5-isopropyl-p-benzoquinone) binds to CSK similarly), autophosphorylates itself, and then phosphorylates sigma factor 1 (SIG1) subunit of PEP (RNA polymerase). This results in specific repression of PS-I genes (psaA), thus decreasing the stoichiometry of PS-I to PS-I. Conversely, CSK is inactive with a reduced PQ pool under PS-II light, and SIG1 phosphatase removes the repression of PS-I gene transcription, thus increasing the stoichiometry of PS-I to PS-II.
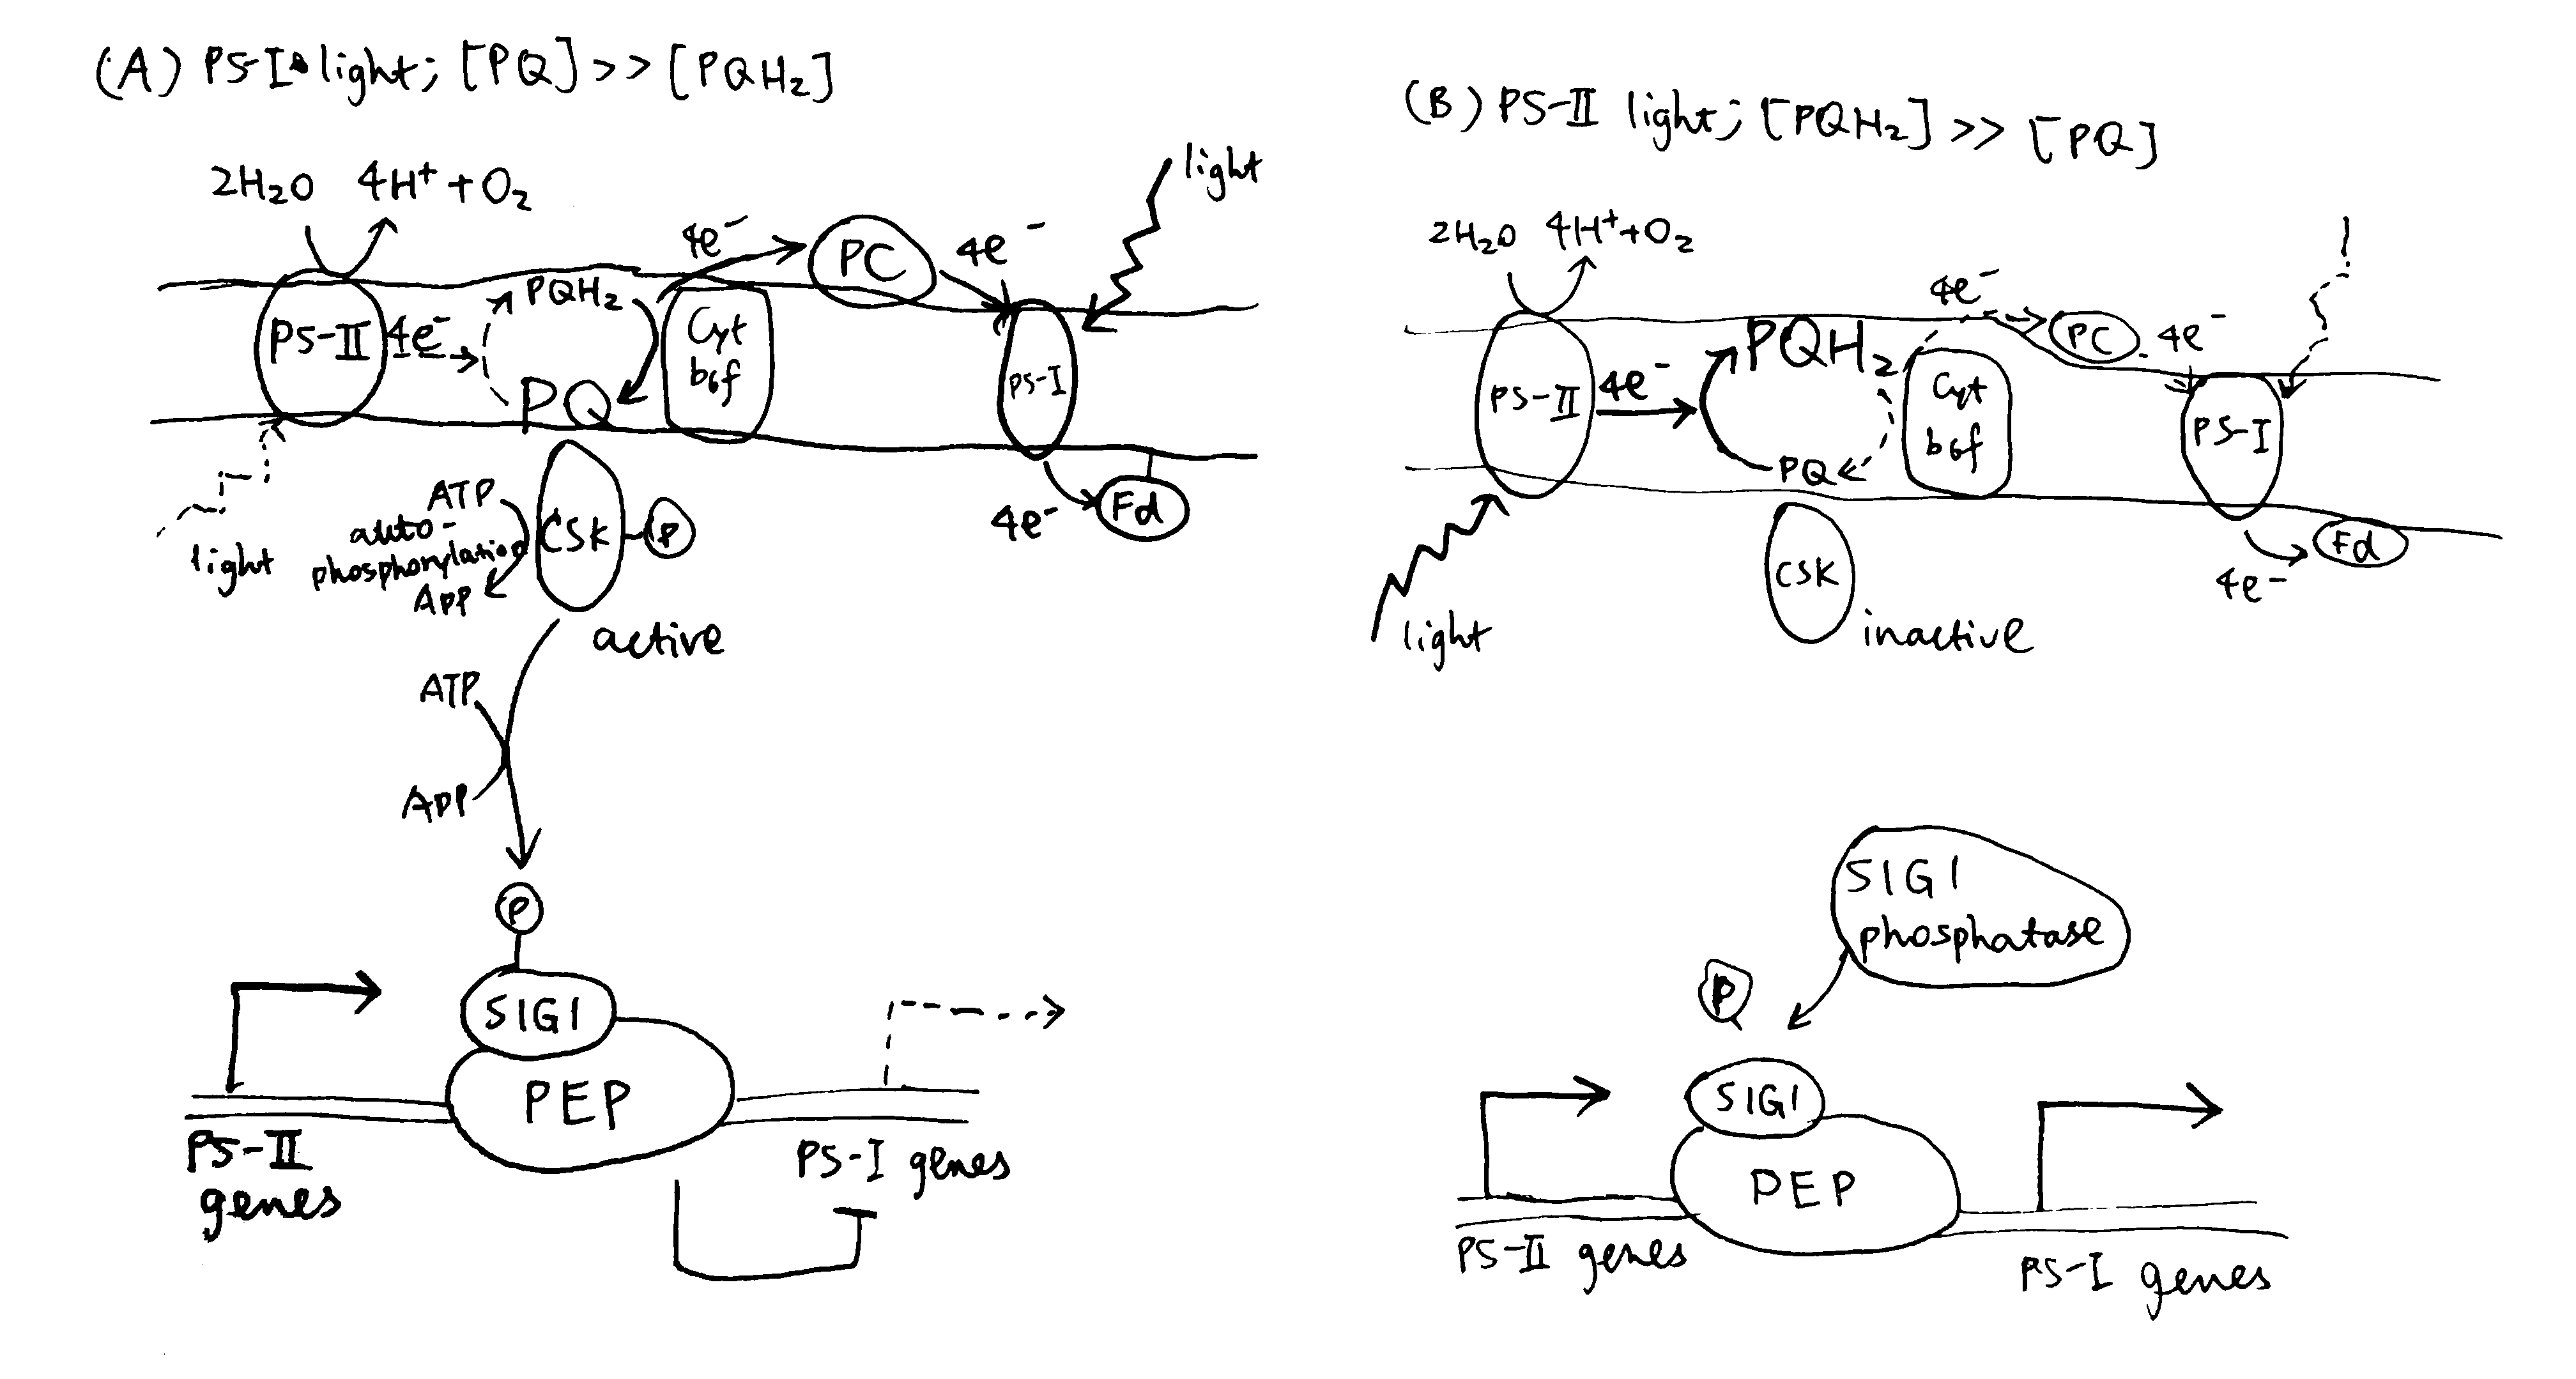
Figure 3.4: Transcriptional control of PS-I genes mediated by PQ, CSK, SIG1 and PEP.
3.3.1 How does SIG1 phosphorylation confer phhotosystem promoter specificity?
Bacterial sigma factors contain the region 1.1 at the extreme N-terminus. Region 1.1 is a poorly-conserved, acidic region, which is associated with the positively charged catalytic cavity of RNA polymerase in the closed (non-transcribing) conformation. To begin transcription, (negatively-charged) DNA must replace region 1.1, and the efficiency of this replacement depends on how well the -10 and -35 elements of the promoter match the consensus sequence.
Chloroplast SIG1 also has an N-terminal un-conserved region (UCR), but it contains both acidic and basic patches. It is proposed that, in PS-II light, the basic patch and the acidic patch of the un-phosphorylated SIG1 form a complex through electrostatic interactions, thus preventing the association of the acidic patch with the basic catalytic cavity. In PS-I light, phosphorylation with the basic patch disfavours its complex formation with the acidic patches, thus allowing the acidic patch to associate with the catalytic cavity, where it acts as the gatekeeper and discriminates between strong and weak promoters.
By comparing the -35 and -10 regions of the promoters of psaA and psbA to the consensus sequence, it can be deduced that psbA (PS-II gene) has a stronger promoter and is therefore preferentially transcribed over PS-I under PS-I light, when SIG1 is phosphorylated and the discrimination mechanism is functioning.
4 Conclusion
Plants need to coordinate the efficiency of PS-II and PS-I in order to maximise the utilisation of light energy in linear electron flow. Upon change in light quality, activities of PS-II and PS-I are transiently unsyncronised, leading to change in oxidative state of PQ (i.e. accumulation of PQ or PQH2). This triggers two mechanisms used to regain the balance. First, PQH2 binding to Cytb6f activates STN7, which in turn causes phosphorylation of LHC-II and its migration from PS-II to PS-I. Second, PQ activates CSK, which phosphorylates SIG1, causing PS-II genes to be preferentially transcribed.
References
Andersson, Jenny, Mark Wentworth, Robin G Walters, Caroline A Howard, Alexander V Ruban, Peter Horton, and Stefan Jansson. 2003. “Absence of the Lhcb1 and Lhcb2 Proteins of the Light-Harvesting Complex of Photosystem Ii - Effects on Photosynthesis, Grana Stacking and Fitness.” Plant J 35 (3). UmeåPlant Science Centre, Department of Plant Physiology, UmeåUniversity, S-901 87 Umeå, Sweden. jenny.andersson@plantphys.umu.se: 350–61. https://doi.org/10.1046/j.1365-313x.2003.01811.x.
Barros, Tiago, and Werner Kühlbrandt. 2009. “Crystallisation, Structure and Function of Plant Light-Harvesting Complex Ii.” Biochimica et Biophysica Acta (BBA) - Bioenergetics 1787 (6): 753–72. https://doi.org/https://doi.org/10.1016/j.bbabio.2009.03.012.
Bellafiore, Stéphane, Frédy Barneche, Gilles Peltier, and Jean-David Rochaix. 2005. “State Transitions and Light Adaptation Require Chloroplast Thylakoid Protein Kinase Stn7.” Nature 433 (7028). Department of Molecular Biology, University of Geneva, 30, Quai Ernest Ansermet, 1211 Geneva, Switzerland.: 892–95. https://doi.org/10.1038/nature03286.
Buchanan, Bob B., Wilhelm Gruissem, and Russel L. Jones. 2015. Biochemistry & Molecular Biology of Plants. John Wiley & Sons.
Holloszy, John O., and Wendy M. Kohrt. 1996. “Regulation of Carbohydrate and Fat Metabolism During and After Exercise.” Annual Review of Nutrition 16 (1): 121–38. https://doi.org/10.1146/annurev.nu.16.070196.001005.
Horowitz, Jeffrey F, and Samuel Klein. 2000. “Lipid metabolism during endurance exercise.” The American Journal of Clinical Nutrition 72 (2): 558S–563S. https://doi.org/10.1093/ajcn/72.2.558S.
Jensen, Thomas E., and Erik A. Richter. 2012. “Regulation of Glucose and Glycogen Metabolism During and After Exercise.” The Journal of Physiology 590 (5): 1069–76. https://doi.org/10.1113/jphysiol.2011.224972.
Longoni, Paolo, Damien Douchi, Federica Cariti, Geoffrey Fucile, and Michel Goldschmidt-Clermont. 2015. “Phosphorylation of the Light-Harvesting Complex Ii Isoform Lhcb2 Is Central to State Transitions.” Plant Physiol 169 (4): 2874–83. https://doi.org/10.1104/pp.15.01498.
Maarbjerg, S. J., L. Sylow, and E. A. Richter. 2011. “Current Understanding of Increased Insulin Sensitivity After Exercise – Emerging Candidates.” Acta Physiologica 202 (3): 323–35. https://doi.org/10.1111/j.1748-1716.2011.02267.x.
Mittendorfer, Bettina, and Samuel Klein. 2003. “Physiological Factors That Regulate the Use of Endogenous Fat and Carbohydrate Fuels During Endurance Exercise.” Nutrition Research Reviews 16 (1). Cambridge University Press: 97–108. https://doi.org/10.1079/NRR200357.
Mullet, J E. 1983. “The Amino Acid Sequence of the Polypeptide Segment Which Regulates Membrane Adhesion (Grana Stacking) in Chloroplasts.” J Biol Chem 258 (16): 9941–8.
Puthiyaveetil, Sujith, T Anthony Kavanagh, Peter Cain, James A Sullivan, Christine A Newell, John C Gray, Colin Robinson, Mark van der Giezen, Matthew B Rogers, and John F Allen. 2008. “The Ancestral Symbiont Sensor Kinase Csk Links Photosynthesis with Gene Expression in Chloroplasts.” Proc Natl Acad Sci U S A 105 (29): 10061–6. https://doi.org/10.1073/pnas.0803928105.
Richter, Erik A., and Neil B. Ruderman. 2009. “AMPK and the biochemistry of exercise: implications for human health and disease.” Biochemical Journal 418 (2): 261–75. https://doi.org/10.1042/BJ20082055.
Taiz, Lincoln, and Eduardo Zeiger. 2010. Plant Physiology. Sinauer Associates.
Takahashi, Hiroko, Sophie Clowez, Francis-André Wollman, Olivier Vallon, and Fabrice Rappaport. 2013. “Cyclic Electron Flow Is Redox-Controlled but Independent of State Transition.” Nat Commun 4. Institut de Biologie Physico-Chimique, UMR 7141 CNRS-UPMC, 13 rue P et M Curie, 75005 Paris, France.: 1954. https://doi.org/10.1038/ncomms2954.
Thompson, Dylan, Fredrik Karpe, Max Lafontan, and Keith Frayn. 2012. “Physical Activity and Exercise in the Regulation of Human Adipose Tissue Physiology.” Physiological Reviews 92 (1): 157–91. https://doi.org/10.1152/physrev.00012.2011.
What effects do the intensity and duration of exercise have on fuel selection by mammalian muscle?
1 Introduction
During exercise, glucose and fatty acids are the fuels used by the muscle. Their origin and relative contribution depend on the intensity and duration of exercise, as well as on characteristics of individuals such as the level of physical training.
2 Overview
As shown in Figure 1, muscle contraction during exercise is powered by oxidation of glucose and fatty acids derived from a number of sources.
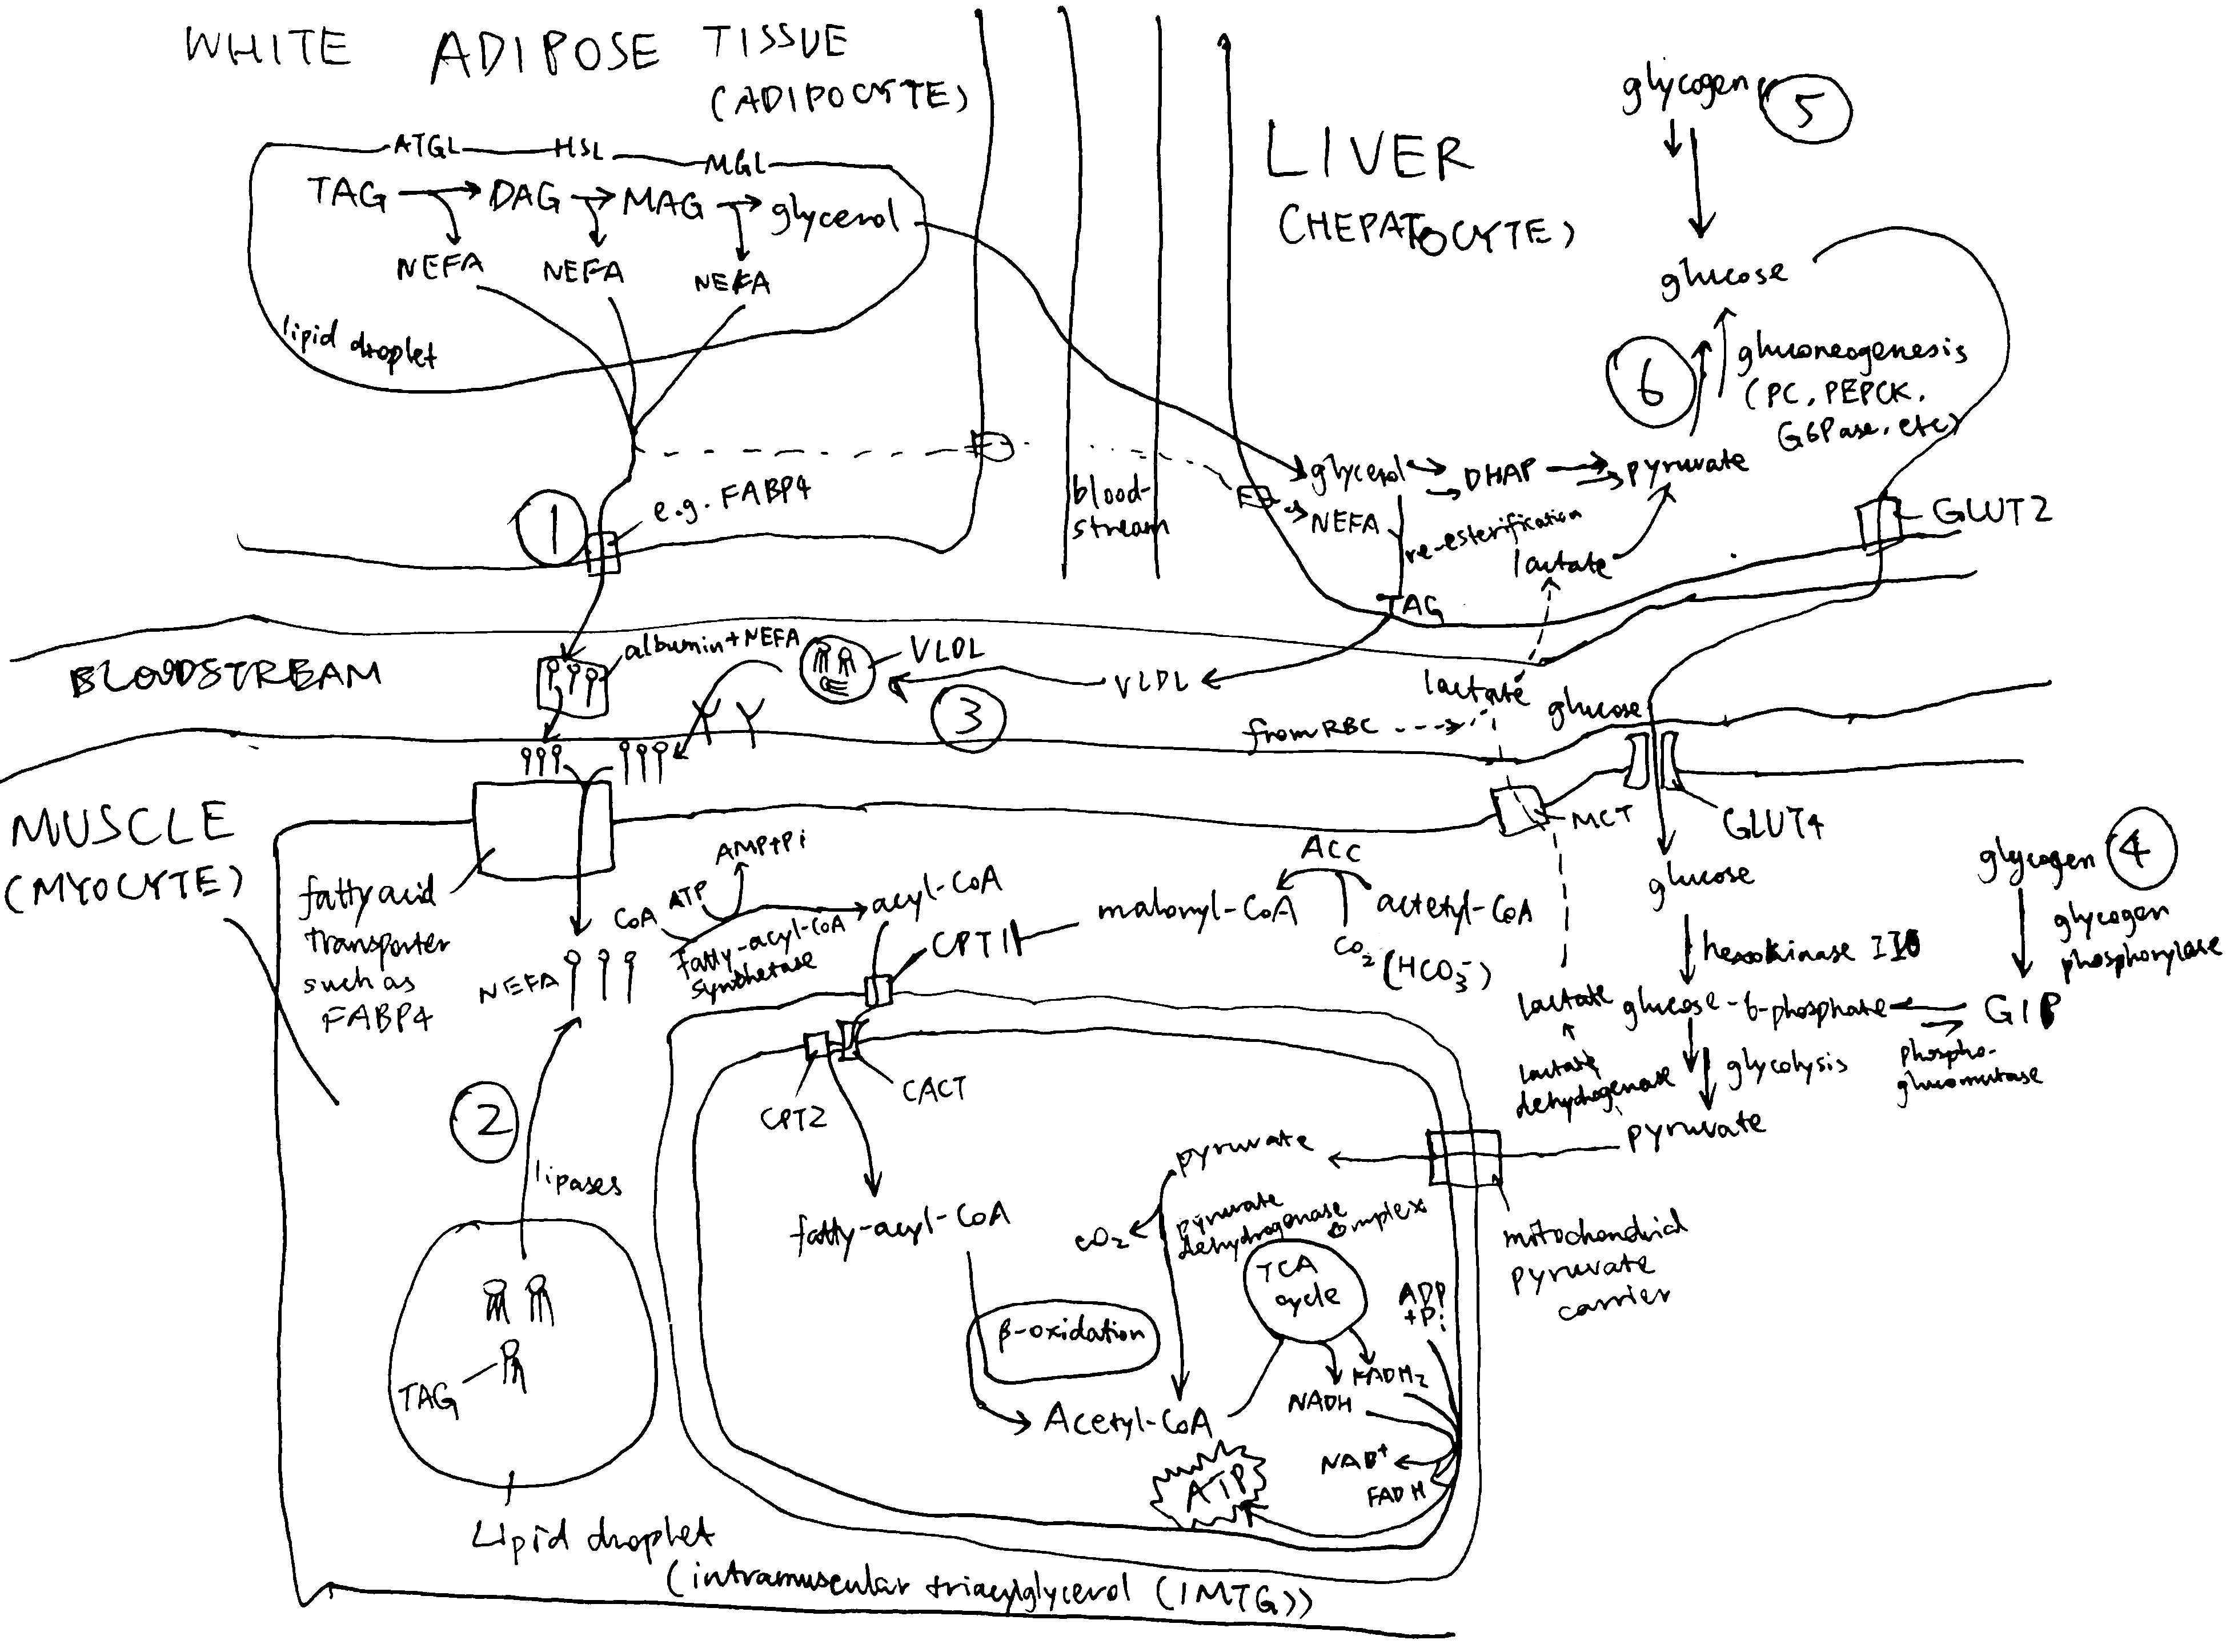
Figure 2.1: Sources of fuel during exercise. (1) white adipose tissue lipolysis; (2) intramuscular triglycerides (IMTG); (3) plasma TG (mainly contained in VLDL synthesised by the liver); (4) mucle glycogenolysis; blood glucose derived from liver glycogenolysis (5) and gluconeogenesis (6).
Immediately after the onset of exercise (0-30 s) energy is derived predominantly from anaerobic respiration. After this period, both excercise intensity and duration determine the choice of fuel used for oxidation. As shown in Figure 2, during the first 30 minutes of a low-intensity exercise bout, the vast majority of fuel used by muscle is plasma NEFA (non-esterified fatty acids) originated from adipose lipolysis with tiny contributions from IMTG (intramuscular triglyceride) and plasma glucose. For moderately intense exercise, the contribution from fat is lower: plasma NEFA and IMTG each represent about 25% of total energy expenditure, and glycogen and plasma glucose account for the remaining 40% and 10%. For high-intensity exercise, the contribution from muscle glycogen is even higher (60%), and fat and glucose represents 30% and 10% of the total, respectively. Overall, as exercise intensity increases, carbohydrates (especially muscle glycogen) progressively becomes the preferred fuel over triglyceride-derived fuel. As for TG-derived fuel, the ratio of IMTG to plasma NEFA is greatest during moderately intense exercise and lowest during low-intensity excercise. These are explained in detail later.
Figure 2 also shows that, during prolonged (low- or moderate-intensity) exercise, the contribution from plasma NEFA increases and the contribution from other fuels decreases, regardless of exercise intensity. This is due to the large amount of TG reserve in adipose tissue and the gradual depletion of other fuels.
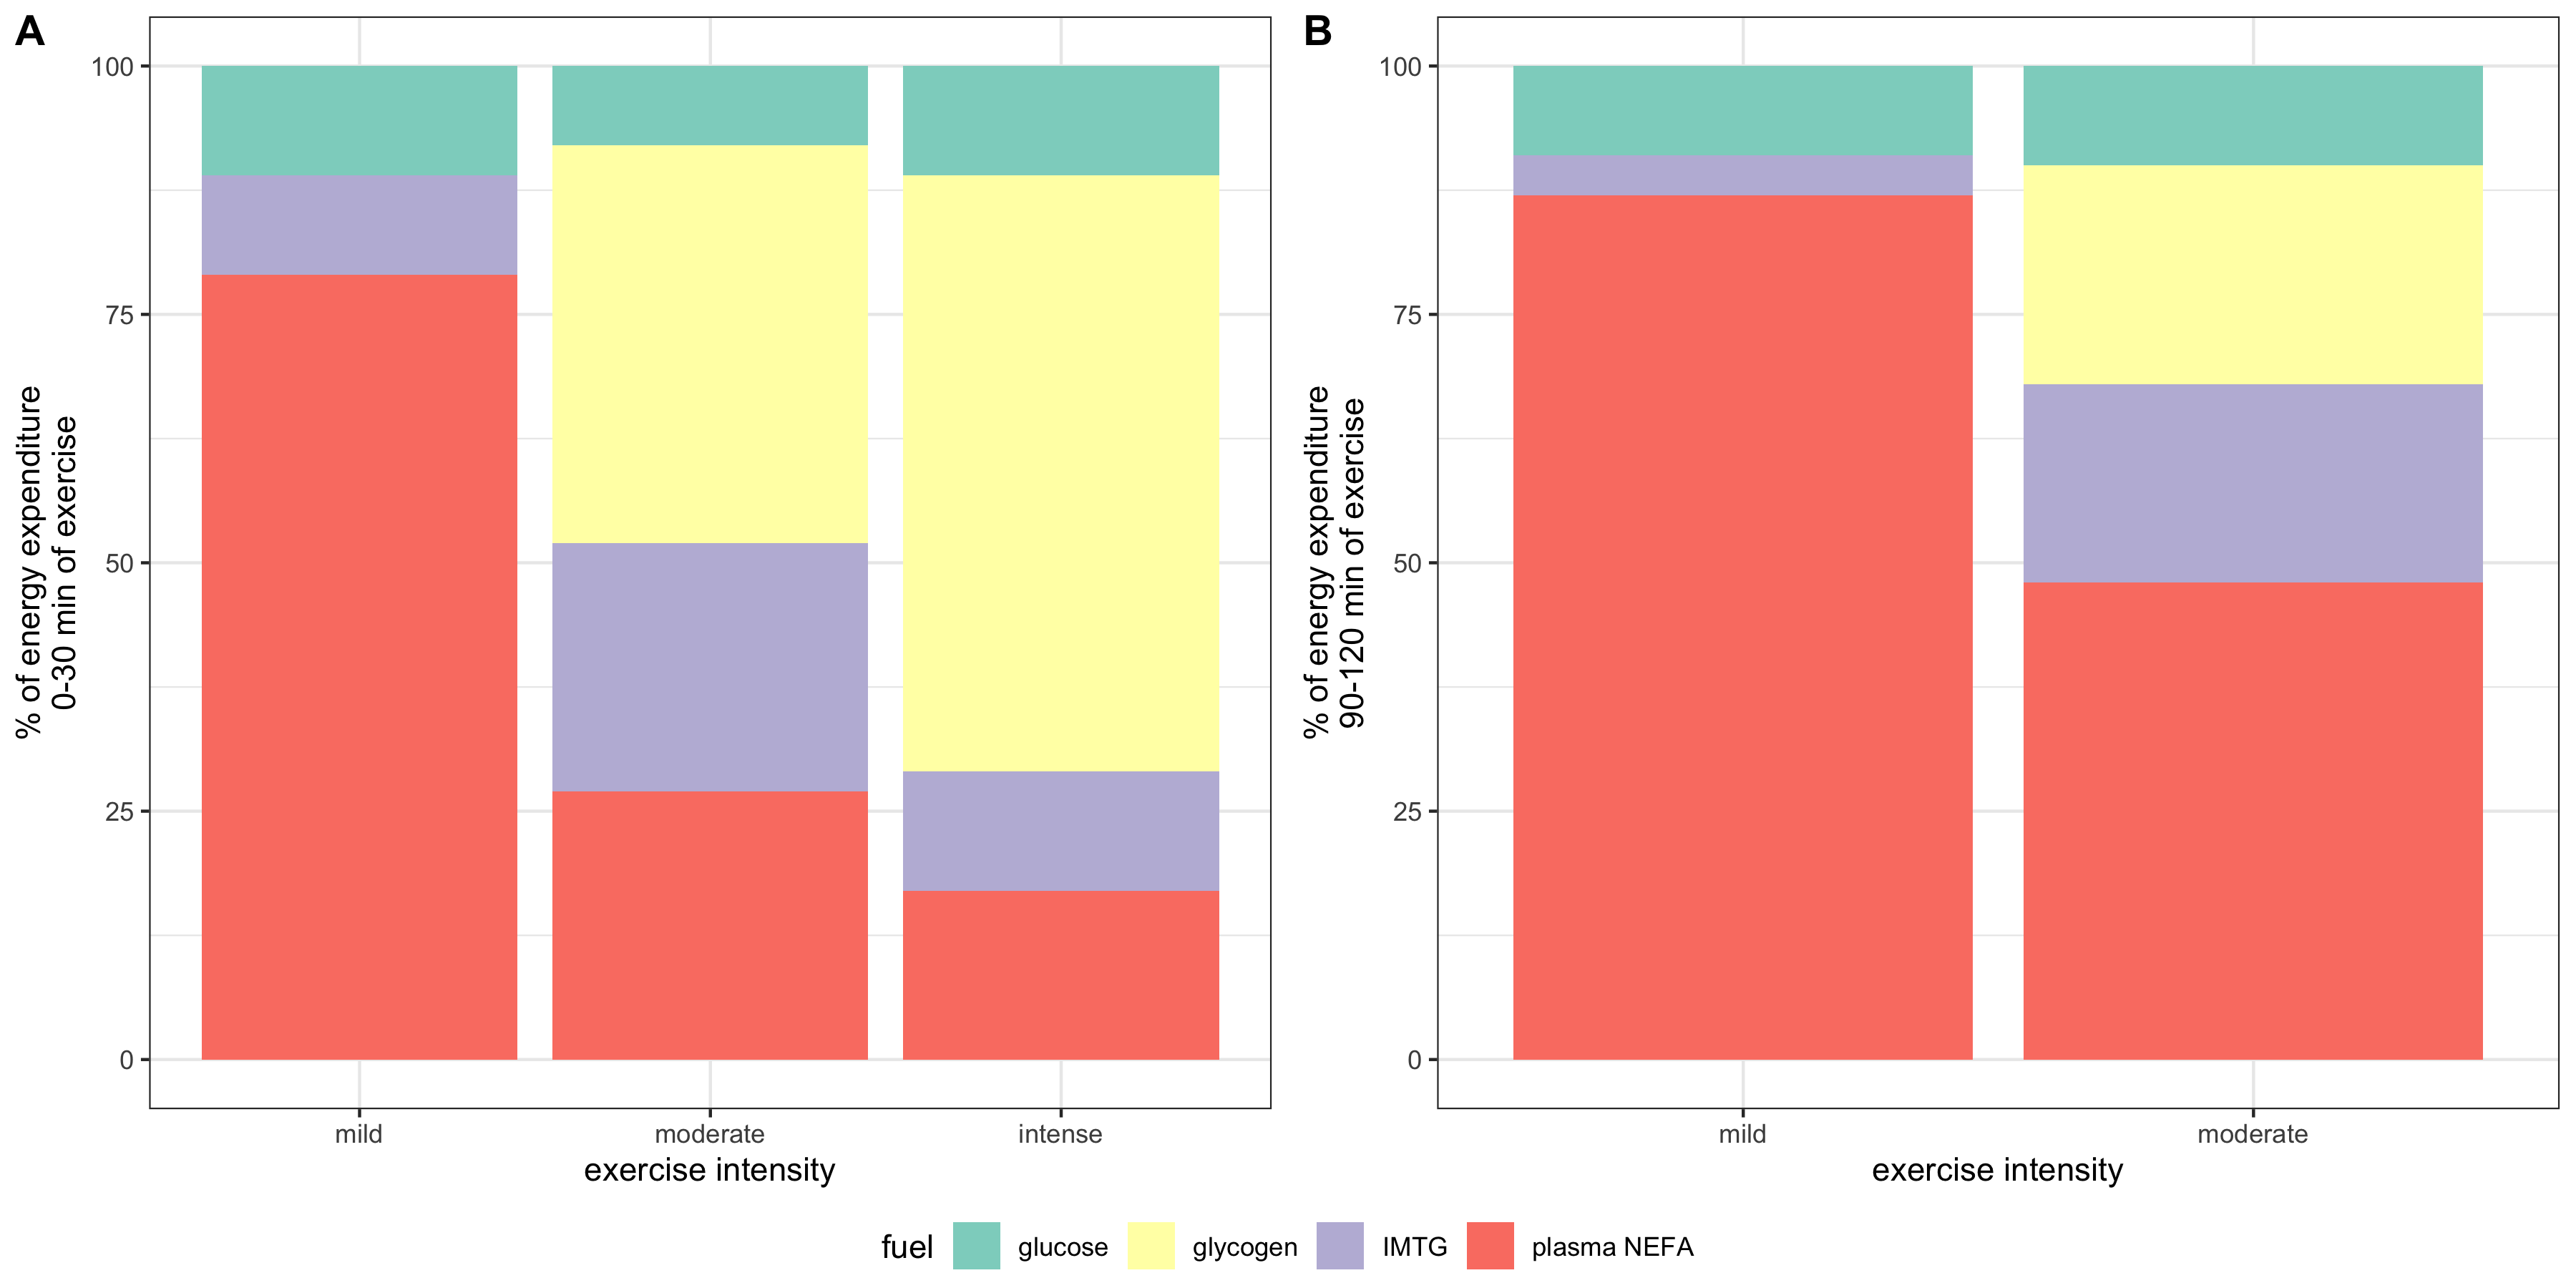
Figure 2.2: Effects of exercise intensity and duration on choice of substrates. ‘Percentage of VO2max’, where VO2max is the highest rate of ATP generation via oxidative phosphorylation attainable, is a normalised parameter used to measure relative exercise intensity. Exercise requiring less than 30% VO2max is considered low-intensity; 50%-70%, moderate intensity; 70-85%, high-intensity.
2.1 Glycogen and Glucose
2.1.1 Blood Glucose
During exercise, catecholamines stimulates pancreatic \(\alpha\) cells to secrete glucagon, which in turn promtotes hepatic glycogenolysis and gluconeogenesis. Both processes release glucose into the bloodstream.
Blood glucose is the predominant source of carbohydrate for oxidation in muscle. Its absolute amount of usage increases as excercise intensity increases (though proportionally remains largely unchanged), which is mediated by an increaed sensitivity to insulin (in part due to utilisation of IMTG) and thus increased translocation of GLUT4 to the cell surface membrane.
2.1.2 Regulation of Glycogenolysis
Glycogen phosphorylase (GP) and phosphorylase kinase (PhK) are central to the regulation of glycogenolysis. Activated PhK phosphorylates GP, thus converting it from the inactive b form to the active a form. GP in its a form then phosphorolyses glycogen, releasing glucose 1-phosphase available for oxidation.
PhK is activated (1) by phosphorylation on \(\alpha\) and \(\beta\) subunits by PKA and (2) by binding of Ca2+ to \(\delta\) subunit. PKA is activated upon catecholamine (mostly adrenaline) binding to cell surface receptors (via Gs, adenylyl cyclase, and cAMP), and Ca2+ is released upon muscle contraction (stimulated by acetylcholine).
Ca2+ released upon muscle contraction results in a burst of glycogenolysis. The large amount of glycogen breakdown exceeds muscle’s energy requirement and capacity of TCA cycle, resulting in accumulation of lactate. This probably explains the short period of anaerobic respiration at the onset of exercise. After a few minutes, the activation of phosphorylase reverses by a mechanism that is not fully understood.
Myocytes also respond, via \(\beta\) adrenergic receptors, to catecholamines that are produced proportionally to exercise intensity. This results in activation of PKA (via Gs, AC and cAMP), which in turn activates glycogenolysis.
The rate of glycogenolysis also depends on availability of Pi, the substrate of glycogen phosphorylase. At rest and during mild exercise, fatty acid oxidation is capable of generating sufficient ATP, resulting in low Pi concentration. Availability of Pi increases as exercise intensity increases because the rate of ATP hydrolysis exceeds the rate of convertion from ADP and Pi back to ATP by oxidation of fatty acids (and plasma glucose).
2.2 Fatty Acids
During exercise, the usage of fatty acids has an important role of delaying the onset of glycogen depletion and hypoglycemia. Its contribution to total energy expenditure increases as excercise proceeds. However, its usage is limited during strenuous exercise.
2.2.1 Adipose Tissue Lipolysis and Plasma NEFA
Compared to resting conditions, adipose tissue lipolysis occurs at a higher rate during mild- or moderate-intensity exercise. This is mainly mediated by increased \(\beta\)-adrenergic receptor activation by catecholamines released by the adrenal gland upon sympathetic nerve stimulation. Exercise also increases blood flow in adipose tissue (which prevents toxic regional accumulation of fatty acids) and in muscle, thus promoting transport of NEFA to myocytes. Passive uptake of NEFA by myocytes, which is proportional to plasma NEFA concentration, is thus increased. AMPK, which is activated upon transition from rest to exercise and during prolonged exercise, phosphorylates ACC2 and malonyl-CoA decarboxylase, inhibiting the former and activating the latter, thus resulting in a decrease of malonyl-CoA concentration and hence releasing CPT-1 from inhibition. This promotes transport of fatty acids into mitochondria for \(\beta\)-oxidation in muscle cells.
As the exercise intensity continue to increase, however, oxidation of NEFA derived from adipose tissue lipolysis in muscle decreases. This is in part caused by decreased rate of lipolysis due to lactate (through activation of an orphan GPCR, GPR81). Lactate can also increase re-esterification of fatty acids to TG in the liver. Raising plasma fatty acid concentrations by intravenously infusing a lipid emulsion and heparin during the exercise bout increases plasma NEFA oxidation by about 30% but does not completely restore it to the rate observed during moderate-intensity exercise. Thus, high-intensity exercise also decreases the capacity of skeletal muscle to oxidise fatty acids, which is in part caused by increased glycogen catabolism. As more acetyl-CoA concentration are produced via glycogen catabolism, they are converted to malonyl-CoA by ACC2 located on the outer mitochondrial membrane, and the malonyl-CoA then inhibits CPT-1 and hence fatty acid oxidation.
2.2.2 Intramuscular Triacylglycerol (IMTG)
Within myocytes, there are lipid droplets that stores TG. Their usage during exercise can be calculated by subtracting plasma fatty acid oxidation (determined by isotope tracers) from whole-body fat oxidation (determined by indirect calorimetry).
IMTG use is stimulated by catecholamines via \(\beta\) adrenergic receptors. This is supported by the finding that pharmarcological blockage of \(\beta_1 + \beta_2\) prevents the usage of IMTG.
2.2.3 Plasma TG (VLDL-TG)
The liver takes up plasma NEFA and glycerol and use some of them to resynthesise TG. These TG are packaged in VLDL and released into the bloodstream. Muscle can break down some VLDL by lipoprotein lipase and oxidise the resulting fatty acids. However, this only contributes to a small fraction of energy usage during exercise and might be more important for replenishing IMTG stores after exercise.
How does insulin regulate the pathways for the conversion of body fat into ketone bodies? Why are ketone bodies overproduced in uncontrolled diabetes and what are the metabolic consequences.
1 Introduction
Production of ketone bodies (ketogenesis) occurs in the liver (and the kidneys) as an response to prevent hypoglycemia during starvation, and this process is normally suppressed and stimulated by insulin and glucagon, respectively. In addition to its physiological role in fasting, ketogenesis also has high activity in diabetes patients, which may lead to the potentially lethal condition called diabetic ketoacidosis.
2 Regulation of Ketogenesis by Insulin
Insulin suppresses ketogenesis by several mechanisms.
The steps of ketogenesis are breifly shown in Figure 2.1. There are three control points by which ketogenesis can be regulated by insulin: (1) adipocyte lipolysis, (2) mitochondrial fatty acid entry in ketogenic cells (mainly hepatocytes), (3) channeling of Acetyl-CoA (AcCoA) into the ketogenic pathway, and (4) mitochondrial 3-hydroxy-3-methylglutaryl-CoA synthase (HMG-CoA synthase).
Figure 2.1: Production of ketone bodies from adipose-derived fatty acids.
2.1 Adipocyte Lipolysis
The major source molecules for ketogenesis are fatty acids obtained via lipolysis in white adipose tissues. Lipolysis involves the sequential hydrolysis of triacylglycerol (TAG) into 3 non-esterified fatty acids (NEFA) and glycerol by adipocyte triglyceride lipase (ATGL), hormone-sensitive lipase (HSL) and monoglyceride lipase (MGL). Activation of ATGL and HSL are dependent on PKA, which is activated by cAMP that are produced when catecholamines bind to cell-surface \(\beta\) adrenergic receptors.
Insulin is a potent inhibitor of lipolysis. It activates PKB via IRS and PI3K, and PKB in turn phosphorylates and activates phosphodiesterase 3B (PDE-3B). PDB-3B decyclises cAMP, thus diminishing PKA, and thus lipolytic, activity (Figure 2.2). During starvation, insulin levels are low, and adipocyte lipolysis is released from inhibition. Adipocytes are then able to release NEFA into bloodstream.
Figure 2.2: Left, regulation of lipolysis by insulin in adipocytes; right, regulation of uptake of long-chain fatty acids into mitochondria by insulin.
2.2 Regulation of CPT1
Once NEFA molecules arrive at hepatocytes, they are first broken down into AcCoA via \(\beta\)-oxidation before conversion into ketone bodies. Long chain fatty acids needs the carnitine shuttle to enter mitochondria where \(\beta\)-oxidation takes place, and thus the first enzyme of this shuttling system, carnitine palmitoyl transferase 1 (CPT1) is the rate limiting step and is under control. CPT1 is inhibited by malonyl CoA, which is the lipogenetic precursor produced by acetyl-CoA carboxylase (ACC). Insulin activates protein phosphotase 2A (PP2A, which is also activated by xylulose 5-phosphate during fed state), which dephosphorylates and activates ACC, thus promoting lipogenesis and suppressing \(\beta\)-oxidation and ketogenesis (Figure 2.2).
During starvation when insulin levels are low, the high fatty acid concentration in hepatocytes activates the transcription factor PPAR\(\alpha\) (activated by direct binding of fatty acids to PPAR\(\alpha\)), which in turn promotes transcription of several enzymes involved in lipid catabolism, including CPT1.
2.3 Channeling of Acetyl-CoA into Ketogenesis
AcCoA produced from NEFA via \(\beta\)-oxidation can either enter the Krebs cycle or the ketogenesis pathway. When the rate of production of AcCoA exceeds the capacity of citrate synthesis (when there is insufficient oxaloacetate), the surplus becomes the substrate for ketogenesis. This situation occurs during starvation, when insulin levels are low and glucagon levels are high, and gluconeogenesis active. Glucagon has several mechanisms to promote gluconeogenesis (and suppress glycolysis). For example, it activates PKA, which in turn activates the transcription factor CREB, which promotes transcription of gluconeogenenic enzymes such as PEP carboxykinase and glucose 6-phosphatase. Insulin, on the contary, suppresses gluconeogenesis. For instance, it activates PKB, which in turn phosphorylates and thus inactivates FOXO1, which is a transcription factor that promotes the transcription of a similar set of gluconeogenic enzymes. Insulin inhibits gluconeogenesis and thus ketogenesis.
2.4 Mitochondrial HMG-CoA Synthase
Mitochondrial HMG-CoA catalyses the irreversible step in ketogenesis, and therefore is a site of control.
Insulin promotes glycolysis and increases flux through the Krebs cycle. One of the Krebs cycle intermediate, succinyl-CoA, inactivates mitochondrial HMG-CoA by succinylation. Glucagon, on the contrary, activates gluconeogenesis, which causes depletion of Krebs cycle intermediates including succinyl-CoA, thus activating ketogenesis.
In addition, the transcription factor PPAR\(\alpha\) described previously also activates transcription of HMG-CoA synthase.
3 Diabetes and Ketone Bodies
3.1 Aetiology of Diabetes
Diabetes is characterised by insufficient insulin activity, which could be caused by either lack of insulin production or insulin resistance in target cells. Most diabetes cases fall into two categories, type 1 and type 2.
- Type 1 diabetes is caused by autoimmunity agaist pancreatic \(\beta\) cells, which leads to their death and inadequacy of insulin. The primary risk factor for type 1 diabetes is genetic, although several environmental risk factors, such as infection by viruses that show tropism to pancreatic islets.
- Type 2 diabetes begins with insulin resistance, but reduction of insulin production and number of \(\beta\) cells may also be implicated as the disease advances. Type 2 diabetes also has genetic risk factors, but environmental factors, such as sedentarity and obesity, are more important.
Whichever the type, ketogenesis is hyperactive in diabetes patients (although generally more severe in type 1) due to inadequate insulin activity.
3.2 Overproduction of Ketone Bodies
Given the fact that insulin suppresses ketogenesis and insulin activity is decreased in diabetic patients, it is easy to comprehend why ketone bodies are overproduced in diabetic individuals.
Lack of insulin activity upon adipocytes leads to uncontrolled lipolysis and subsequent release of non-esterified fatty acids. As fatty acids enter the liver, they are shuttled into mitochondria, broken down into acetyl-CoA via \(\beta\)-oxidation and converted to ketone bodies. This process is facilitated by the low insulin activity, which activates gluconeogenesis (e.g. via FOXO1-induced transcription of gluconeogenenic enzymes and phosphorylation of PFK2/FBPase2 bifunctional enzyme), which in turn releases the rate-limiting enzyme, HMG-CoA from succinylation inhibition and reduces usage of acetyl-CoA in Krebs cycle. The low insulin activity also inhibits ACC, thus activating CPT1 and hence \(\beta\)-oxidation. The high fatty acid concentration also leads to activation of PPAR\(\alpha\), which promotes transcription of ketogenic enzymes such as CPT-1 and HMG-CoA synthatase.
3.3 Consequences of Ketoacidosis
Diabetic ketoacidosis (DKA) the most common acute emergency in diabetes patients. It is a potentially lethal condition that is characterised by lowered blood pH due to accumulation of acidic ketone bodies (acetoacetate and 3-hydroxybutyrate). DKA is caused by lack of insulin and thus occurs mostly in uncontrolled type 1 diabetes (DKA is not commonly seen in type 2 diabetes, because even a tiny amount of insulin activity would inhibit ketogenesis; however, there is a small proportion of “ketosis-prone type 2 diabetes”). Often, DKA is triggered by stress or illness, which are associated with increase of ketogenesis-promoting hormones, glucagon and catecholamines.
Ketoacidosis has several consequences, as described below.
- Kussmaul breathing: initally, bicarbonate ions buffur protons dissociated from ketone bodies, but this buffering system quickly becomes overwhelmed. To compensate, blood CO2 concentration is reduced by deep, regular breaths known as Kussmaul breathing.
- Hypovolaemia: hyperglycemia and ketonaemia results in excretion of glucose and ketone bodies (which normally should be absorbed) in urine. Since they are osmotically active, their presence in urine causes osmotic diuresis, which further leads to hypovolaemia (decrease in body fluid volume).
- Electrolyte disturvance: as the the plasma pH falls, extracellular protons are exchanged for intracellular potassium ions. In addition, owing to hypovolaemia, the aldosterone concentration increases to retain water, but this hormone also leads to excretion of K+ and retention of Na+.
- The low plasma pH impair with many biological functions, especially in the brain, where potentially life-threatening coma and cerebral oedema may occur.
“Glucagon and insulin affect the body in opposite ways.” To what extent is this statement true?
1 Introduction
Glucagon and insulin are peptide hormones secreted by the endocrine cells (\(\alpha\) and \(\beta\) cells, respectively) of the islets of Langerhans in pancreas. Although these two hormones differ in their target tissues and mechanisms of action, the metabolic changes they bring about, at the whole-body level, have opposite effects, which helps to maintain energy homeostasis. Specifically, insulin results in adaptation to high blood glucose concentration and high energy status, which occurs after a meal, while glucagon results in adaptation to low blood glucose concentration.
2 Initial Steps of Glucagon and Insulin Signalling
Glucagon and insulin each has diverse effects in different tissues, but the initial steps are common. To avoid repetition, these step are described in this section.
2.1 Insulin Signalling
The insulin receptor belongs to the receptor tyrosine kinase (RTK) family. Upon insulin binding, the receptor dimer trans-autophosphorylates each other on tyrosine residues (pY). IRS1 (insulin receptor substrate 1) binds to pY via its SH2 (src homology 2) domain. Insulin receptor phosphorylates IRS1 on tyrosine, and then PI3K (phosphoinositide 3 kinase) binds to pY of IRS1 via SH2. PI3K converts PIP2 (PtdIns(4,5)P2) to PIP3 (PtdIns(3,4,5)P3), then PIP3 serves as the docking site for PDK1 (phosphoinositide dependent kinase 1) and PKB (Akt). PDK1 and mTOR2C activates PKB by phosphorylation, and PKB then phosphorylates other protein targets to bring about most insulin-induced metabolic changes. Among these effects, a significant porportion is mediated by PP1 (protein phosphatase 1), which is activated by PKB (Figure 2.1).
Figure 2.1: Overview of insulin signalling.
2.2 Glucagon Signalling
Glucagon receptors are G-protein coupled receptors (GPCR). Upon glucagon binding, the receptor acts as a guanine nucleotide exchange factor and replace GDP bound to the G protein with GTP. The activated heterotrimeric G protein dissociates into \(\beta\gamma\) and \(\alpha\) subunits. Some glucagon receptors are associated with Gs, and their \(\alpha\) subunit activates adenylyl cyclase, which produces cAMP, which in turn activates protein kinase A (PKA). Other glucagon receptors are associated with Gq, and their \(\alpha\) subunit activates phospholipase C, which converts PIP2 (phosphatidylinositol bisphosphate) to IP3 (inositol trisphosphate) and DAG (diacylglycerol). IP3 stimulates Ca2+ release from the smooth endoplasmic reticulum. PKA and Ca2+ then activates downstream proteins (Figure 2.2 ).
Figure 2.2: Overview of glucagon signalling.
3 Glucose Metabolism
Maintaining a glucose concentration of around 5 mmol/L is crucial to human survival. This glucose homeostatis is maintained by glucagon and insulin, where the former results in net increase in glucose concentration and the latter results in net decrease in glucose concentration.
3.1 Glycogen Metabolism in Liver
In liver, net synthesis of glycogen (in order to lower down blood glucose concentration) is stimulated by insulin and net consumption is promoted by glucagon.
3.1.1 Glucagon Activates Glycogenolysis in Liver
As described previously, glucagon signalling results in activation of PKA and release of Ca2+. PKA phosphorylates and thus activates phosphorylase b kinase. Ca2+ binds to phosphorylase b kinase, also activating it. Insulin inhibits glycogenolysis via PP1, which dephosphorylates phosphorylase kinase. Glucagon counteracts the effect of insulin in another way: PKA phosphorylates the R (regulatory) subunit of PP1, causing the dissociation of the C (catalytic) subunit, thus inactivating PP1 (Figure 3.1 ).
Figure 3.1: Effect of glucagon and insulin on hepatic glycogenolysis
3.1.2 Insulin Activates Glycogen Synthesis in Liver
Insulin activates glycogen synthesis in hepatocytes. Glycogen is synthesised by glycogen synthase (and branching enzymes), whose active (a) form is unphosphorylated. It is normally phosphorylated (inactivated) by caesin kinase 2 (CK2) and glycogen synthase kinase 3 (GSK3). Insulin-activated PKB phosphorylates (inavtivates) GSK3 and hence releases GS from inhibition (Figure 3.2).
Figure 3.2: Insulin stimulates glycogen synthesis in the liver.
3.2 Glycolysis and Gluconeogeneis in Liver
Insulin activates glycolysis and inhibits gluconeogenesis in liver. Glucagon has opposite effects.
3.2.1 Short-Term Control via PFK2/PBPase2 Bifunctional Enzyme
In liver, fructose 2,6-bisphosphate (F26BP) the key regulator of glycolysis and gluconeogenesis. It is an allosteric regulator of PFK-1 and FBPase-1 and have opposite effects on them. It significantly reduces the inhibitory effect of ATP on PFK-1—without F26BP, PFK-1 essentially has no activity in normal hepatocytes because hepatic ATP concentration is very high. In contrast, F26BP is an allosteric inhibitor of FBPase-1.
The PFK2/PBPase2 bifunctional enzyme (BFE) converts between fructose 6-phosphate (F6P) and F26BP. PFK2 is active in its unphosphorylated form while FBPase2 is active in its phosphorylated form. Insulin activates PP1, which dephosphorylates BFE (PP2A has the same effect), resulting in net production of F26BP, thus activating glycolysis and inhibiting gluconeogenesis. Glucagon activates PKA, which in turn phosphorylates BFE, reducing amount of F26BP and hence deactivating glycolysis and de-inhibiting (activating) gluconeogenesis (Figure 3.3 ).

Figure 3.3: Regulation of glycolysis and gluconeogenesis via F26BP in liver.
The isoform of pyruvate kinase (PK) present in liver is also phosphorylated and inactivated by PKA, and this also contributes to glucagon-induced inhibition of glycolysis.
3.2.2 Long-Term Transcriptional Control
Glucagon-triggered rise in cAMP concentration activates CREB (cAMP response element binding protein), which turns on synthesis of glucose 6-phosphatase and PEP carboxykinase, two key enzymes involved in gluconeogenesis.
Insulin activates PKB, which phosphorylates and inactivates other transcription factors, such as FOXO1, and thus reduces transcription of gluconeogenic enzymes.
3.3 Glucose Uptake into Muscle Cells
Insulin sigalling in muscle cells results in activation of PKB, which in turn causes translocation of GLUT4-containing vesicles to the cell surface. This significantly increases the rate of influx of glucose into muscle cells, thus reducing blood glucose concentration.
4 Lipid Metabolism
Glucagon is released when glucose is not abundant, thus its overall effect is to promote mobilisation and utilisation of the alternative fuel, triacylglycerides (TAG). Insulin has the opposite effect: it is released after a meal, when the nutrient concentration in blood is high, and it supresses TAG usage and promotes TAG storage.
4.1 Lipolysis in Adipocytes
Lipolysis is the process by which triacylglycerol molecules (TAG) stored in the lipid droplet of adipocytes in white adipose tissues are hydrolysed to 3 free (non-esterified) fatty acid molecules and 1 glycerol molecule and released into the bloodstream, resulting in net increase in free fatty acid concentration in blood plasma.
As shown in Figure 4.1, PKA is central to the activation of the lipolytic pathway. Catecholamines (adrenaline and noradrenaline), being the major activators of lipolysis, activates PKA via \(\beta\) adrenergic receptor, Gs, AC and cAMP. Glucagon has also been shown to activate lipolysis in vitro (via PKA), but there is no clear evidence that it acts in vivo.
Figure 4.1: Activation of lipolysis by catecholamines (adrenaline and noradrenaline) and, with less evidence, by glucagon. PKA is activated via the GPCR-Gs-AC-cAMP pathway described previously. Activated PKA has two roles. First, it phosphorylates HSL and increases enzymatic activity thereof. Second, it phosphorylates perilipin, which is the protein residing on the membrane of the lipid droplet (LD) providing protection against ATGL and HSL. The phosphate groups induce binding of HSL to perilipin, effectively translocating HSL from the cytosol to the LD. Phosphorylation also release CGI-58 from perilipin, and the free CGI-58 activates ATGL. TAG is hydrolysed to 3 fatty acids and a glycerol molecule stepwisely by ATGL, HSL and MGL.
Insulin inhibits lipolysis via PKB and PDE-3B, resulting in net decrease in blood fatty acid concentration (Figure 4.2).
Figure 4.2: Inhibition of lipolysis by insulin. Insulin activates PKB, which phosphorylates and thus activates the phosphodiesterase PDE-3B. PDE-3B de-cyclise cAMP, to AMP, thus reducing PKA activity and the lipolytic pathway downstream of PKA.
4.2 TAG Synthesis in Liver
TAG synthesis in liver is promoted after a meal. This is mainly mediated by de-phosphorylation (activation) of ACC (acetyl-CoA carboxylase) by PP2A as a result of elevated glucose concentration and pentose phosphate pathway activity. (Some books, such as Lehninger’s, say that insulin-activated PP1 also de-phosphorylates ACC). The product of ACC, malonyl CoA, inhibits CPT1 (carnitine palmitoyl transferase) and hence oxidation of fatty acids.
Long term regulation of lipogenesis is achieved via the transcription factors ChREBP and SREBP-1c. These two TFs both up-regulates enzymes involved in lipogenesis, but their regulation differ. ChREBP is activated by xylulose 5-phosphate, which happens when there is a large flux through the pentose phosphate pathway due to high glucose concentration. This effect is reduced by cAMP, whose production is induced by glucagon. In contrast, SREBP-1c is activated by atypical PKC (aPKC), which is another protein kinase activated by insulin (Figure 4.3 ).
Figure 4.3: Long-term regulation of lipogenesis via ChREBP and SREBP-1c.
4.3 TAG (Re-)Synthesis in Adipocytes
During fed state, adipocytes, with help from endothelial cells, break down chylomicrons (from the intestine) and VLDLs (from the liver), hydrolyse the containing triacylglycerol molecules, take up the resulting fatty acids, and re-synthesise the TAG. Adipocytes do not express glycerol kinase, thus they have to obtain glycogen 3-phosphate, one of the substrate in the first step of TAG synthesis, from dihydroxyacetone phosphte (by glycerol 3-phosphate), which is a glycolytic intermediate. Insulin promotes glucose uptake and hence glycolysis in adipocytes, thus promoting TAG resynthesis.
5 Conclusion
Although glucagon and insulin usually exert their effects on different enzymes, and sometimes in different tissues, the net results of their activity are opposite, which ultimately leads to energy homeostasis, where energy consumption and concentration of glucose in blood remain relatively constant while the pattern of food intake is changing.
Title: As starvation proceeds, how does the supply of fuels to the brain change? How is this change related to a requirement to conserve body protein?
Due to the blood-brain barrier, The human brain can only harness energy from catabolising either glucose or ketone bodies. Under normal circumstances, glucose of dietary origin is the predominant source of fuel for the brain. As starvation begins (during the postabsorptive phase), astrocytes in the brain break down their stored glycogen to supply fuel in the form of lactate to neurons, which is followed by hepatic glycogenolysis that continue to provide glucose for the brain for a short period. As starvation proceeds, upon depletion of glycogen, muscle protein is broken down for liver gluconeogenesis, which continues to provide glucose for the brain. Meanwhile, triacylglycerol-derived ketone bodies synthesised by the liver will represent an increasingly larger proportion of fuel for the brain.
As shown in Figure 1, starvation can be divided into 4 stages, each having a different strategy for supplying energy to the brain.

Figure 1: Left: Origin of blood glucose and rate of glucose utilisation at different stages of starvation. Right: Concentrations of fuel molecules in blood plasma as starvtion proceeds.
Stage I (Absoption) and II (Post-absorption): Glycogenolysis
Soon after a meal, glucose obtained from food is absorbed from the gut into the bloodstream. The abundant glucose is the exclusive fuel used by the brain. The high blood glucose level also stimulates the \(\beta\) cells in the islets of Langerhans in the pancreas to release insulin, which in turn promotes uptake and storage of glucose (as glycogen, in liver, muscle, actrocytes, and other tissues) and triacylglycerol (in lipid droplets in adipocytes).
During the post-absorptive phase, blood glucose concentration drops. Islets of Langerhans respond by reducing production of insulin in \(\beta\) cells and increasing production of glucagon in \(\alpha\) cells.
The principal effect of glucagon is to promote glycogenolysis in liver.
On the plasma membrane of hepatocytes, glucagon binds to its receptors, which are G-protein coupled receptors (GPCR), on hepatocyte cell surface membrane. Upon glucagon binding, the receptor acts as a guanine nucleotide exchange factor and replace GDP bound to the G protein with GTP. The activated heterotrimeric G protein dissociates into \(\beta\gamma\) and \(\alpha\) subunits.
Some glucagon receptors are associated with Gs, and their \(\alpha\) subunit activates adenylyl cyclase, which produces cAMP, which in turn activates protein kinase A (PKA). PKA phosphorylates phosphorylase kinase, thus activating it. Other glucagon receptors are associated with Gq, and their \(\alpha\) subunit activates phospholipase C, which converts PIP2 (phosphatidylinositol bisphosphate) to IP3 (inositol trisphosphate) and DAG (diacylglycerol). IP3 stimulates Ca2+ release from the smooth endoplasmic reticulum, then Ca2+ binds to phosphorylase kinase, also activating it.
Activated phosphorylase kinase phosphorylates glycogen phosphorylase b (inactive form), converting it to glycogen phosphorylase a (active form). Then, with help from the debranching enzyme, glycogen phosphorylase a break down glycogen into glucose 1-phosphate, which can be converted by phosphoglucose mutase to glucose 6-phosphate, which is then dephosphorylated by glucose 6-phosphatase. The resulting glucose is released into the bloodstream via GLUT2 transporter down the concentration gradient.
Glycogenolysis occurs not only in liver but also in astrocytes. Unlike liver glycogenolysis, however, 1-phosphoglucose in astrocytes are converted to lactate instead of glucose. Lactate is transported via monocarboxylate transporter (MCT) and supplied to neurons.
During this period, the brain still uses glucose-derived fuel (glucose and lactate) as the sole fuel at the same rate, so do other parts of the body.
Stage III (Early Starvation): Gluconeogenesis
As the glycogen storage become depleted, most tissues start to use fatty acids released by white adipose tissue as the fuel, but the brain continue to use, almost exclusively, glucose, which are now derived from gluconeogenesis.
In the human body, the principal substrates for gluconeogenesis are lactate, glucogenic amino acids and glycerol. During starvation, lactate is not an important gluconeogenic substrate for net gain of glucose, because it is produced mostly by anaerobic glycolysis of glucose itself.
During starvation, body protein is the only source of amino acids for gluconeogenesis. These amino acids are initially supplied by hepatic proteolysis and later predominantly provided by muscle proteins. Although the composition of muscle proteins is rather heterogenous, the majority of the release amino acids are alanine and glutamine. Most alanine is taken up by the liver for gluconeogenesis, while the role of glutamine is more varied—it is used by the kidney for acid-base balance during starvation, for example.
Glycerol, the other source molecule for gluconeogenesis during starvation, is produced by the adipocytes in the white adipose tissue in a process known as lipolysis (fat mobilisation). Lipolysis involves the sequential removal of the three fatty acids of a TAG molecule by adipose triglyceride lipase (ATGL), hormone sensitive hormone (HSL), and monoglyceride lipase (MGL), and the removal of the first two fatty acids by ATGL and HSL is under hormonal control (MGL is always active).
Catecholamines (adrenaline/noradrenaline), which are released upon activation of the sympathetic nervous system at the early stages of starvation, are the major activators of lipolysis. They do so via the GPCR-Gs-AC-cAMP-PKA pathway, similar to that used by glucagon. Activated PKA has two roles. First, it phosphorylates HSL and increases enzymatic activity thereof. Second, it phosphorylates perilipin, which is the protein residing on the membrane of the lipid droplet (LD) providing protection against ATGL and HSL. The phosphate groups induce binding of HSL to perilipin, effectively translocating HSL from the cytosol to the LD. Phosphorylation also release CGI-58 from perilipin, and the free CGI-58 activates ATGL.
Insulin is the major inhibitor of lipolysis. Insulin activates PKB (Akt), which in turn activates phosphodiesterase 3B (PDE-3B). PDE-3B de-cyclise cAMP, thus antagonising the PKA activity. Thus, during starvation, the low insulin level means de-inhibition of lipolysis.
The resulting glycerol and fatty acids are all released into the circulation, the former being used as a substrate for gluconeogenesis and the latter being used as the principal fuel by most tissues and well as a substrate for ketone bodies synthesis in the liver.
There are a number of mechanisms by which the liver ensures that gluconeogenenic precursors are used for gluconeogenesis rather than oxidation. For example, the large amount of acetyl-CoA obtained via \(\beta\)-oxidation inhibits pyruvate dehydrogenase complex, the activity of which would result in irreversible loss of gluconeogenic precursors. As an another example, the low insulin level has a long-term effect on gluconeogenesis by altering gene expression. Insulin leads to activation of PKB, and PKB inactivates (by phosphorylation) the transcription factor FOXO1 that promotes transcription of gluconeogenenic enzymes such as PEP carboxykinase. Thus, the low insulin level during starvation effectively activates the transcription of these gluconeogenic enzymes.
Stage IV (Prolonged Starvation): Ketone Body Synthesis
During prolonged starvation, the brain gradually adopts ketone bodies (acetoacetate and 3-hydroxybutyrate) as an alternative fuel.
The ultimate origin of ketone bodies is the TAG stored in the white adipose tissue. As described above, low insulin level allows continuous lipolysis, resulting in release of fatty acids and glycerol into the bloodstream. Many fatty acid molecules are absorbed by adipocytes, in which they undergo \(\beta\)-oxidation in mitochondria, producing acetyl-CoA in the liver. A part of acetyl-CoA is used for respiration, and the excess is converted either to acetoacetate in a 3-step sequence of reactions involving thiolase, HMG-CoA synthetase and HMG-CoA lyase or, with an additional reduction step, to 3-hydroxybutyrate (in mitochondria). Ketone bodies are released via the monocarboxylate transporter (MCT).
The ketone bodies can cross the blood-brain barrier and reach the neurons (via MCT). In the mitochondria of neurons, ketone bodies are converted back to acetyl-CoA, which is used for respiration. The large amount of acetyl-CoA obtained from ketone bodies inhibits pyruvate dehydrogenase complex and thus restricts glucose utilisation in much the same way acetyl-CoA derived from \(\beta\)-oxidation in other tissues suppress glucose oxidation.
This gradual switching from glucose to ketone bodies as the fuel in the brain is important to the conservation of body proteins. As described previously, gluconeogenesis is the only source of glucose during starvation, and amino acids obtained from muscle proteolysis represent the majority of gluconeogenic precursors during starvation. Thus, conservation of body protein during starvation is equivalent to minimising the comsumption of glucose as fuel, specifically in the brain.
Prolonged starvation is accompanied by a gradual decrease in concentration of the active thyroid hormone, triiodothyronine (T3) over time, which in turn leads to a decrease in basal metabolic rate in most tissues. This reduces the overall consumption of energy of the body and thus also contributes to the sparing of muscle protein.
Conclusion
During a period of starvation, the origin and identity of fuel molecules supplied to the brain (neurons) change, according to this order: astrocyte glycogenolysis, liver glycogenolysis, gluconeogenesis, ketone body synthesis. At the later stages, gluconeogenesis and ketone body synthesis coexist, but the amount of ketone body synthesis gradually increase, in order to spare the functional muscle proteins. This metabolic adaptation to starvation is largely under hormonal control, where insulin, glucagon, thyroid hormone and catecholamines play the most promiment roles.
- 1 Introduction
- 2 The Big Picture: Components of the C. elegans EGF-Ras-MAPK Pathway Involved in Vulva Induction
- 3 Techniques for Studying EGFR-Ras-MAPK Signalling and Vulva Induction
- 4 Conclusion
- References
1 Introduction
The Caenorhabditis elegans vulva is one of the best studied models of organogeneis. Genetic screening revealed three signalling pathways, EGFR-Ras-MAPK, Notch and Wnt1, that are critical to the fate determination of the 6 vulval precursor cells (VPCs), P(3-8)p.
VPCs adopt either 1\(^\circ\) or 2\(^\circ\) fate upon receiving appropriate signals, or 3\(^\circ\) fate if undinduced. The 8 descentdents of the 1\(^\circ\) VPC and the 14 descendents (7 each) of the 2\(^\circ\) VPCs give rise to the vulva, while 3\(^\circ\) VPCs produces epidermal cells which fuse with the syncytial epidermis hyp7.
In the L1 stage, a Wnt signal form the posterior body region selects the six Pn.p cells to become the VPCs and form the vulval competentce group. Then in the L2 stage, LIN-3 (EGF) signal from the anchor cell (AC) in the somatic gonad selects P6.p to be the single 1\(^\circ\) VPC1,2, and contact-dependent LIN-12 (Notch) signalling causes the flanking P5.p and P7.p to become 2\(^\circ\) VPCs. These precise signalling events always results in an invariant spatial pattern of VPCs in wild-type (WT) C. elegans, namely 3\(^\circ\)-3\(^\circ\)-2\(^\circ\)-1\(^\circ\)-2\(^\circ\)-3\(^\circ\).
This essay illustrates how the LET-60 (Ras) signalling has been studied in C. elegans vulval development, specifically the 1\(^\circ\) fate determination, according to these selected work and reviews: 3; 4; 5; 6; 7; 8. A recent review article by 9 and a book chapter by 10 are also taken into account (the latter was the most helpful).
2 The Big Picture: Components of the C. elegans EGF-Ras-MAPK Pathway Involved in Vulva Induction
Figure 2.1 gives an overview of the pathways by which EGF-Ras-MAPK signalling leads to the 1\(^\circ\) fate in P6.p and 2\(^\circ\) fate in flanking P5.p and P7.p cells.
Figure 2.1: P6.p is the VPC closest to the AC, and it also expresses the highest levels of LET-23 on its basolateral membrane. Thus, P6.p receives most LIN-3 signalling and commits to the 1\(^\circ\) fate. Downstram of the LET-23 (EGFR) RTK, a canocical Ras-MAPK pathway transduces the signal into the nucleus. The scaffold proteins LIN-2 (CASK), LIN-7 (Veli), and LIN-10 (Mint-1) form a complex which helps to maintain basolateral localisation of LET-23. The SEM-5 (Grb2) adaptor protein11 uses its SH2 domain to anchor to LET-23 at phosphorylated tyrosines. The guanine exchange factor (GEF) SOS-112 then binds to SEM-5 (at SEM-5’s two SH3 domains), and it activates the membrane-anchored LET-60 (Ras)3. GTP-bound LET-60 then activates the LIN-45 (Raf)13, MEK-214 and MPK-1 (MAPK) kinase cascade, which is facilitated by the scaffold protein KSR. LIN-1 and forkhead LIN-31 transcription factors are the targets of MPK-115. In their unphosphorylated state, LIN-1 and LIN-31 forms a complex which represses 1\(^\circ\)-specific transcription of lin-39 and egl-1716. Phosphorylation makes the complex to dissociate, and phospho-LIN-31 is turned into an transcriptional activator. The 1\(^\circ\) P6.p also produces LAG-2 (Delta), which is the ligand for LIN-12 (Notch), thus transducing lateral signals to P5.p and P7.p. Notch signalling inhibits MAKP, and LET-60 in P5.p and P7.p cells uses a RAL-1 dependent pathway to commit to 2\(^\circ\) fate. A number of modifiers and negative regulators of the EGFR pathway has been identified, which include the tyrosine kinase Ark-117, the RTK phosphatase Dep-118. Adapted from 10 with reference to 19 and 20.
3 Techniques for Studying EGFR-Ras-MAPK Signalling and Vulva Induction
3.1 Forward Genetics and Reverse Genetics
3.1.1 In Early Experiments, Forward Genetics Methods were Used Entensively
Studies on the molecular mechanisms of C. elegans development date back to the 1980s, when genetic manipulating techniques, especially gene cloning, were emerging, but the complete genome sequencing (of C. elegans and other model organisms) had yet to start. Therefore, those pioineering studies relied heavily on forward genetics, where worms were subjected to mutagens, and abnomal phenotypes were identified, isolated, amplified (by self-fertilisation) and the respective genotypes were determined. Differential interference contrast (DIC)/Nomarski microscopes were commonly used to examine the phenotypes because of their superior imaging quuality for live and unstained samples. There were also cellular methods for manipulating gene expression (which especially aided in eludidating cell-cell interactions). First, observing fates of the cells among varying individuals. Second, using laser beams to ablate cells suspected to interact with the cell of interest. Third, isolation of cells of interest, or rearrangement of their surrounding cells.
These extensive genetic screens led to identification of a number of genes that cause abormal cell lineage (the lin# genes) phenotypes, notably vulvaless (Vul)/Egg-laying defective (Egl) or multivulva (Muv) (Figure 3.1). Epistasis analyses of these phenotypes grouped these genes into distinct pathways (notably EGFR-Ras-MAPK and Notch) and helped elucidating where each component functions in the respetive pathway. The general idea is that, if the phenotype of gene A masks the phenotype of gene B, then gene A is likely to act downstream of gene B.
Figure 3.1: Egg-laying defective (Egl) and Multivulva (Muv) phenotypes caused by LET-23 EGFR-Ras-MAPK signalling mutants. (a): Wild type. Eggs are neatly arranged in the uterus. (b) and (c): Defective LIN-10 (which helps to localise LET-23) can lead to disorganisation of eggs (b) and the bag-of-worms phenotype (c), in which self-fertilised eggs hatch and larvae fills up their mother’s carcass. (d): let-60 gain-of-function results in Ras signalling in all VPCs, resulting in a Muv phenotype. Reproduced from 10.
Figure 3.2 shows the earliest expetiments that demonstrated the role of the AC and the LET-60 protein in vulval induction.
Figure 3.2: (a) in wild-type cells, signals from the AC results in the invariant VPC pattern 3\(^\circ\)-3\(^\circ\)-2\(^\circ\)-1\(^\circ\)-2\(^\circ\)-3\(^\circ\); (b) ablation of the AC renders a Vul phenotype, where all 6 VPCs adopts the 3\(^\circ\) fate, this shows that the AC positively regulates vulval induction; (c) inactive LET-60 (Ras) also renders a Vul phenotype even in the presence of the AC, therefore LET-60 should be downstream of the signal from the AC; (d) LET-60 hyperactivity leads to a Muv phenotype, further demonstrating LET-60 as a positive regulator of vulval induction.
3.1.2 RNAi and Reverse Genetics Since 1998
Early mutagenesis studies relied on chance to generate individuals with mutations for certain genes, which is laborious and not specific—usually some genes/DNA regions other than the genes of interest are also mutated, and studies on them can lead to confounding results.
Reverse genetics in C. elegans has become much more prevalent since 1998, when C. elegans became the first multicellular eukaryote to have its genome sequenced21, and it was shown that introdcution of dsRNA into worms results in inactivation of an endogenous gene with corresponding sequence22. This technique, known as RNA interference (RNAi), enables rapid, site-specific gene inactivation and has been rapidly embraced as a reverse-genetic tool and has dramatically accelerated the pace at which new gene functions are discovered.
3.2 Observing Cell Fates
3.2.1 Microscopic Analysis
Observing Val and Muv phenotypes is generally sufficient for ordering the components of the Ras pathway, but cell-cell interaction analyses require the ability to identify differentiated or undifferentiated individual VPCs. The boundaries between cells are not visible by DIC optics and thus cells are identified by the location, size, and morphology of the nucleus and nucleoli. Undifferentiated VPCs at the Pn.p stage each have a characteristic oblong nucleus with a round nucleolus.
3.2.2 Transcriptional Reporters
Several transcriptional targets of LET-23 (EGFR) signalling in P6.p, such as egl-17 and lag-2, have been identified and can be used as transcriptional reporters to identify vulval cell fates. By using a highly sentitive Ras-responsive reporter gene, egl-17::CFP, 8 showed that the Ras pathway is transiently activated in P5.p and P7.p, and that LIN-12 (Notch) activation in these two cells antagonises Ras signalling.
Single molecule fluorescence in situ hybridisation (smFISH) can also be used to monitor expression of cell fate determinants. It reveals subtle changes in gene expression and has been used, for example by 23, to visualise the dynamics of Ras-induced lag-2 expression, which demonstrates the cellular control of EGF-Ras induced gene expression by changing sensitivity to the EGF gradient .
3.3 Cross-Species Genomic Analysis Reveals Homology and Helps to Elucidate Roles of Proteins with Greater Accuracy
As sequencing techniques mature, complete genome sequences of more organisms are becoming available. This is accompanied by advance in computing power and bioinformatic algorithms, and they allow identification of a significant amount of homology among species.
The studies on C. elegans Ras signalling also benefitted from these developments. For example, MPK-1 was initially identified as a suppressor of Ras and was named SUR-1 before being identified as an Erk1/2 homologue. The scaffold protein KSR-1 was originally named SUR-3 due to the same reason. With homology available, one can easily guess the function of a novel gene/protein identified in one organism, if its sequence is found homologous with another gene with known functions.
3.4 Studying EGFR Localisation and Trafficking
The LET-23 EGFR upstream of LET-60 Ras has a polarised localisation in VPCs: vuval induction requires that EGFR to be expressed on the basolateral membrane. Immunostaining and live imaging can be used to monitor LET-23 trafficking and identify regulators involved.
3.4.1 Immunostaining
Immunostaining can be used to visualise subcellular localisation of components of regulators of the EDGR-Ras-MAPK pathway. This technique was used by 24 to establish the role of LIN-2/7/10 complex binding to LET-23 C-terminuc in regulating LET-23 basolateral localisation (Figure 3.3).
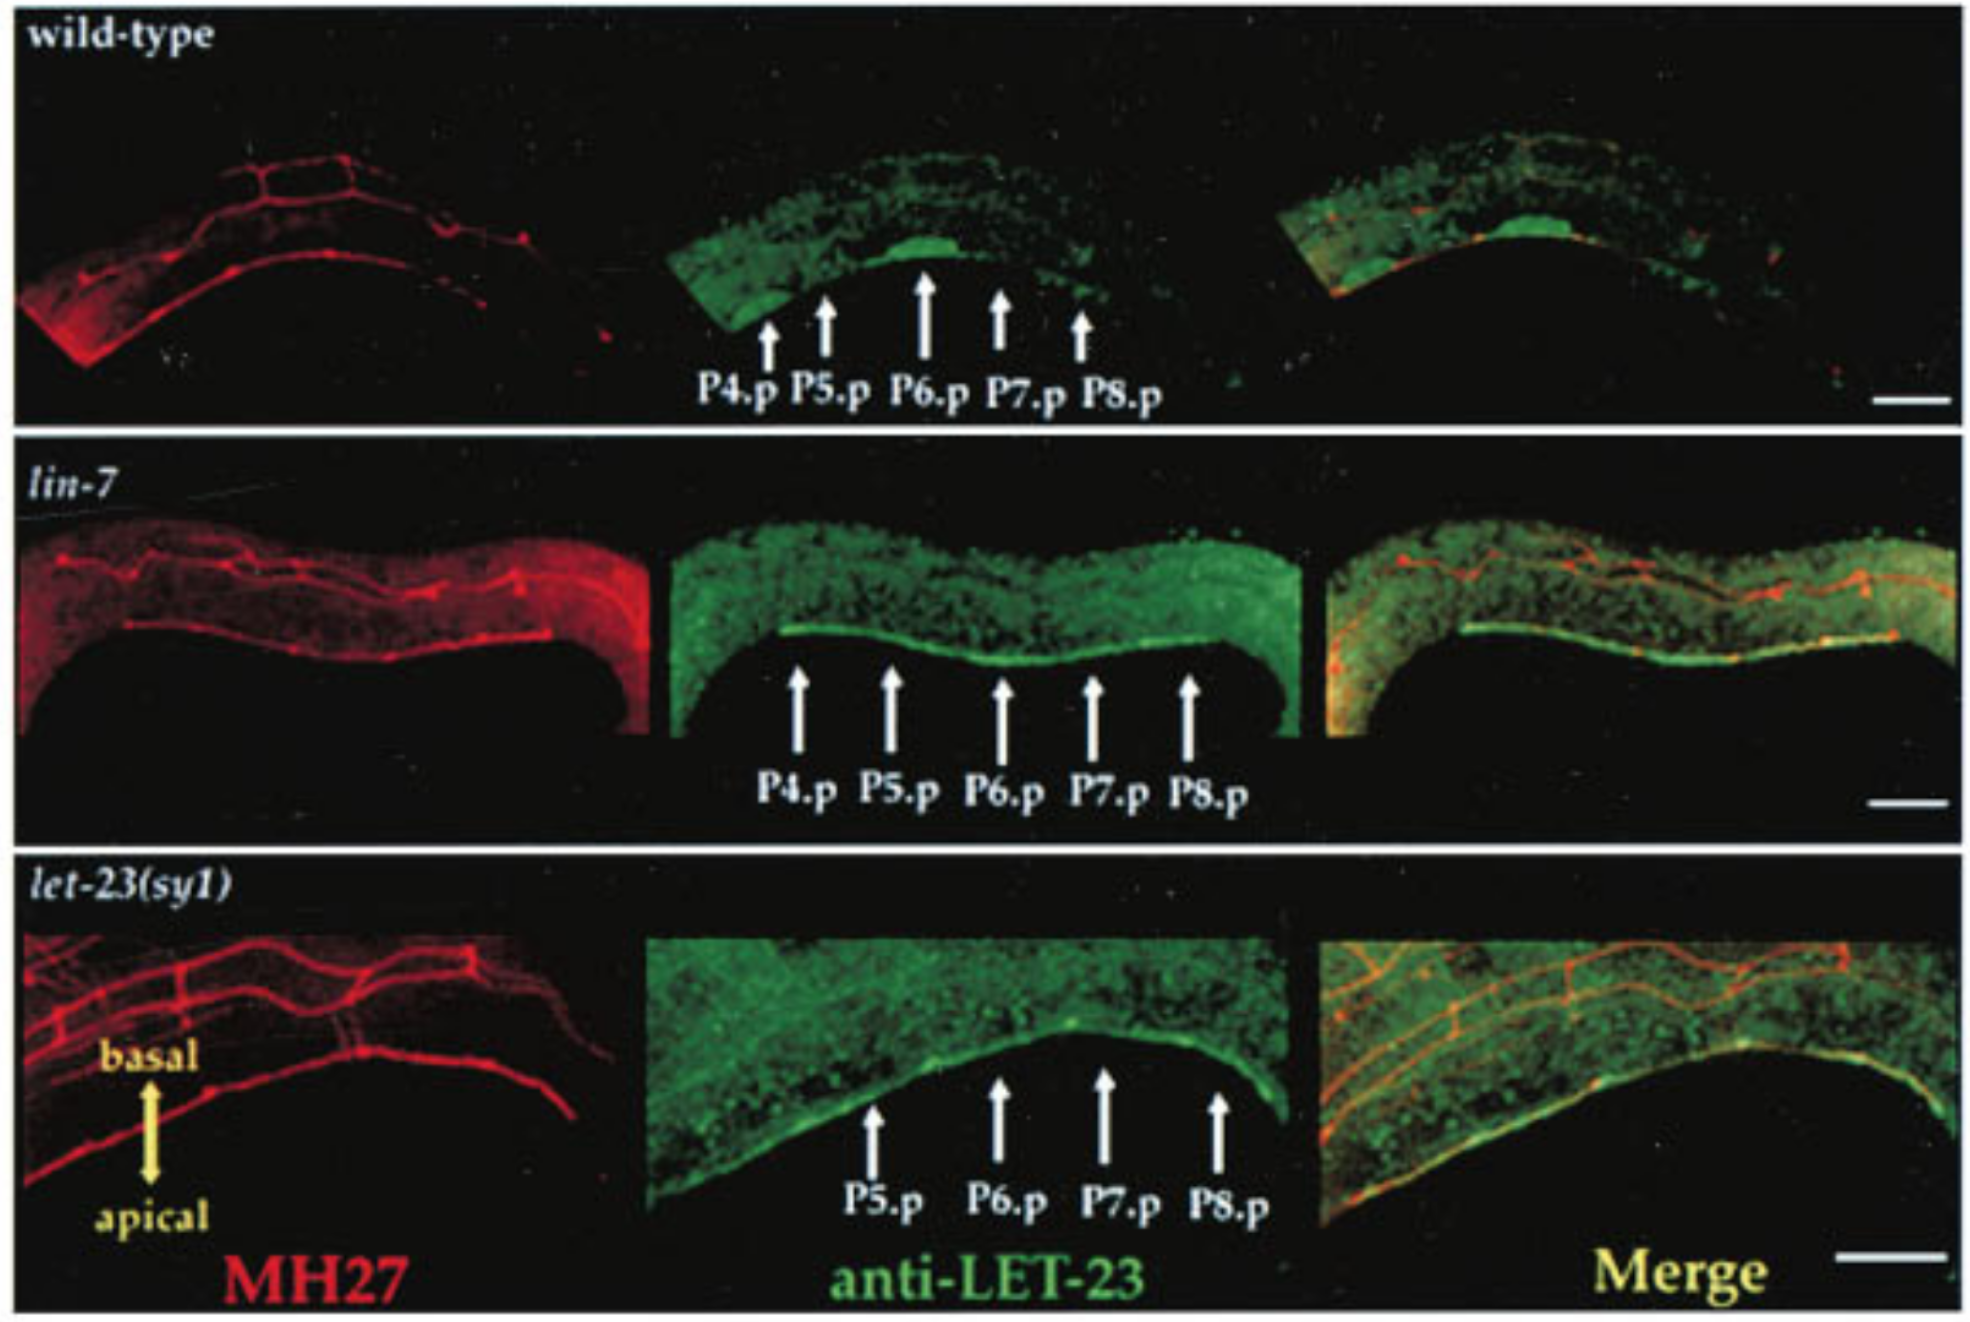
Figure 3.3: Top: LET-23 are localised to the basolateral membrane of VPCs in wild-type C. elegans; Middle: lin-7 mutant shows mislocalisation of LET-23 to the apical membrane; Bottom: let-23(sy1) mutant, in which a premature stop codon removes 6 C-terminal amino acids of LET-23, similarly resulted in mislocalisation of LET-23. LET-23 staining is shownin green, and staining for the cell junctions using the monoclonal antibody MH27 is shown in red. Reproduced from 24.
3.4.2 Live Imaging
Modern imaging techniques, notably confocal and epifluorescence microscopy, allow the subcellular localisation and trafficking of LET-23 to be observed in vivo, in real time. These studies often involve fusion proteins with fluorescence tags. For example, 25 used time-lapse imaging and fluorescence recovery after photobleaching to identify ERM-1 (the Ezrin homologue) as a temporal regulator of LET-23 localisation.
4 Conclusion
The understanding of the EGFR-Ras-MAPK signalling pathway is importnat because of its involvement in many human diseases, especially cancer. Vulva induction in C. elegans has been a valuable in vivo model for elucidating the identities and mechanisms of the components and regulators in this pathway. Studies on C. elegans traditionally relied on forward genetics, but new experimental techniques and bioinformatic are now solving previously unanswered questions in this field.
References
1. Hill, R. & Sternberg, P. The gene lin-3 encodes an inductive signal for vulval development in c. Elegans. Nature 358, 470–476 (1992).
2. Sternberg, P. W. & Horvitz, H. The combined action of two intercellular signaling pathways specifies three cell fates during vulval induction in c. Elegans. Cell 58, 679–693 (1989).
3. Beitel, G. J., Clark, S. G. & Horvitz, H. R. Caenorhabditis elegans ras gene let-60 acts as a switch in the pathway of vulval induction. Nature 348, 503–509 (1990).
4. Thomas, J. H., Stern, M. J. & Horvitz, H. R. Cell interactions coordinate the development of the c. Elegans egg-laying system. Cell 62, 1041–1052 (1990).
5. Sternberg, P. W. & Han, M. Genetics of ras signaling in c. Elegans. Trends Genet 14, 466–472 (1998).
6. Kornfeld, K. Vulval development in caenorhabditis elegans. Trends Genet 13, 55–61 (1997).
7. Sundaram, M. V. Vulval development: The battle between ras and notch. Current Biology 14, R311–R313 (2004).
8. Yoo, A., Bais, C. & Greenwald, I. Crosstalk between the egfr and lin-12/notch pathways in c. Elegans vulval development. Science 303, 663–666 (2004).
9. Schmid, T. & Hajnal, A. Signal transduction during c. Elegans vulval development: A neverending story. Current Opinion in Genetics & Development 32, 1–9 (2015).
10. Gauthier, K. & Rocheleau, C. E. C. Elegans vulva induction: An in vivo model to study epidermal growth factor receptor signaling and trafficking. in ErbB receptor signaling: Methods and protocols (ed. Wang, Z.) vol. 1652 43–61 (Humana Press, 2017).
11. Clark, S., Stern, M. & Horvritz, H. C. Elegans cell-signalling gene sem-5 encodes a protein with sh2 and sh3 domains. Nature 356, 340–344 (1992).
12. Chang, C., Hopper, N. & Sternberg, P. Caenorhabditis elegans sos-1 is necessary for multiple ras-mediated developmental signals. EMBO Journal 19, 3283–3294 (2000).
13. Han, M., Golden, A., Han, Y. & Sternberg, P. C. Elegans lin-45 raf gene participates in let-60 ras-stimulated vulval differentiation. Nature 363, 133–140 (1993).
14. Kornfeld, K., Guan, K. L. & Horvitz, H. R. The caenorhabditis elegans gene mek-2 is required for vulval induction and encodes a protein similar to the protein kinase mek. Genes Dev 9, 756–768 (1995).
15. Lackner, M. R., Kornfeld, K., Miller, L. M., Horvitz, H. R. & Kim, S. K. A map kinase homolog, mpk-1, is involved in ras-mediated induction of vulval cell fates in caenorhabditis elegans. Genes Dev 8, 160–173 (1994).
16. Leight, E. R., Glossip, D. & Kornfeld, K. Sumoylation of lin-1 promotes transcriptional repression and inhibition of vulval cell fates. Development 132, 1047–1056 (2005).
17. Hopper, N. A., Lee, J. & Sternberg, P. W. ARK-1 inhibits EGFR signaling in C. elegans. Molecular Cell 6, 65–75 (2000).
18. Berset, T. A., Hoier, E. F. & Hajnal, A. The c. Elegans homolog of the mammalian tumor suppressor dep-1/scc1 inhibits egfr signaling to regulate binary cell fate decisions. Genes Dev 19, 1328–1340 (2005).
19. Alberts, B. et al. Molecular biology of the cell. (Garland Science, 2014).
20. Sternberg, P. W. Vulval development. in WormBook (ed. Research Community, T. C. elegans) (WormBook, 2005). doi:doi/10.1895/wormbook.1.6.1.
21. Stein, L. D. Internet access to the c. Elegans genome. Trends in Genetics 15, 425–427 (1999).
22. Fire, A. et al. Potent and specific genetic interference by double-stranded rna in caenorhabditis elegans. Nature 391, 806–811 (1998).
23. Zon, J. S. van, Kienle, S., Huelsz-Prince, G., Barkoulas, M. & Oudenaarden, A. van. Cells change their sensitivity to an egf morphogen gradient to control egf-induced gene expression. Nature Communications 6, 7053 (2015).
24. Kaech, S. M., Whitfield, C. W. & Kim, S. K. The lin-2/lin-7/lin-10 complex mediates basolateral membrane localization of the c. Elegans egf receptor let-23 in vulval epithelial cells. Cell 94, 761–771 (1998).
25. Haag, P. A. B., Andrea AND Gutierrez. An in vivo egf receptor localization screen in c. Elegans identifies the ezrin homolog erm-1 as a temporal regulator of signaling. PLOS Genetics 10, 1–13 (2014).
26. Gilbert, S. F. & Barresi, M. J. F. Developmental biology. (Sinauer Associates, 2016).
27. Slack, J. M. W. Essential developmental biology. (WIley-Blackwell, 2018).
In this essay, the names of the actual C. elegans proteins and their (more commonly known) vertebrate/Drosophila homologues are used interchangeably. Here is a translation between them: (Drosophila: C. elegans) EGF: LIN-3; EGFR: LET-23; Grb2: SEM-5; Ras: LET-60; Raf: LIN-45; MEK: MEK-2; MAPK/Erk: MPK-1; Notch: LIN-12; Frizzled and Ryk (WNT-receptors): LIN-17 and LIN-18. C. elegans protein naming follows the WormBase convention↩
Title: What is the point of studying developmental biology?
The main theme of developmental biology is the fate determination of cells, their division, differention and death, as well as the resulting higher level processes, including morphogenesis and organ formation. I’ll illustrate how this knowledge can help with preventive and public healthcare as well as modern medical research.
Prenatal Care (Preventing Teratogenesis)
Teratogen and congenital anomaly
According to the US’ National Research Council, ~3% of live births suffer from major developmental aberrations, ~70% of neonatal deaths are due to developmental defects.
- exogenous agents that cause birth defects are teratogens, they can be chemicals, radiations, or viral infections, and so on
- thalidomide
- used to treat anxiety
- malformed arms and legs
- thee first major evidence that drugs could induce congenital anomalies
- led to the development of greater drug regulation and monitoring in many countries
- alcohol interferes with fetal neural development and is shown to cause mental retardation in the newborn
- fetal alcohol syndrome
- abnormal facial development
- most prevalent type of congenital mental retardation syndrome in the US
- in pregnant women, Zika virus directly infects the neural progenitor cells of the fetal cortex (vertically transmitted infection), resulting in the death of these cells
- Model organisms such as Xenopus and Denio, are often used to screen compound that have a high probability of being hazardous, because the early development of these organisms rely on the same basic paracrine factors and TFs as humans do.
- studies on model organisms have revealed three probable pathways for alcohol teratogenesis. first, generation of superoxide redicals; second, downregulation of Sonic hedgehog; third, intereference of the cell adhesion molecule L1
Nutrients
to sustain normal development of the fetus, healthy diet is needed. This is quite obvious, however, there is one vitamin, that cannot be obtained with enough amount just from food, it is folic acid
- Folic acid
- it is found to significantly reduce the chance of neural tube defects in infants, but only at high doses
- it’s recommended, by NHS, that all pregnant women should take a daily supplement of 400 migrograms of folic acid before they’re pregnant and during the first 12 weeeks of pregnancy, when the baby’s spine is developing
Stem Cell
an important subdomain of developmental biology is stem cell biology, which has many applications in research and medicine. here I’ll focus on pluripotent stem cells
ES Cells
- ES cells are the natural source of pluripotent cells
- ICM (embryoblast) and trophoblast
- the study of the normal sequence of embryonic inductions yielded the methods for induced differentiation of these cells
- derived from the inner cell mass of blastocysts from IVF clinic
- harvesting human ES cells means destroying human embryos (5 days after fertilisation)
- raised ethical controversy
iPS cells
- Reverting to undifferentated state
- functionallty equivalent to embryonic stem cells
- capable of differentiating into almost all cell types
- Shinya Yamanaka factors: Oct4, Klf4, Sox2, c-Myc
- screened 22 factors
- Regenerative Medicine
- SMA clinical trial in Japan
- Organoids
- An organoid is a miniaturized and simplified version of an organ produced in vitro in three dimensions that shows realistic micro-anatomy
Cancer as a Disease of Development
- carcinogenesis can be viewed as a disease of development because it involes aberrations of the processes that underlie cell division, differentiation and morphogenesis
- once it was thought that carcinogenesis and metastasis were caused by cells that had acquired mutations enabling them to proliferate independent of the enviornment.
- but it turns out that this is not the complete explanation
- cancer cells can actuallt modify their environment, turning it into a cancer-promoting niche
- this means the progression of many cancers depends on reciprocal interactions between hte cancer cells and the supporting cells of their tissue environment
Indeed, carcinogenesis appears to recapitulate steps of normal development, including the formation of a niche in which to proliferate, using the same or closely related signalling pathways
- Defects in cell-cell conmmunication
- studies have shown that tumours can be cuased by altering hte structure of the surrounding tissue, and that these tumors can be suppressed by restoring an appropriate tissue envionment
- althogh 80% human tumors are from epithelial cells, the cells that carcinogens act on are often not the epithelial cells themselves, but the mesenchymal stromal cells that surround and sustain the epithelia
- there was a study in which normal and carcinogen-treated epithelia and mesenchyme in rat mammary glands are recombined, and it turns out that, tumor growth occurred not in carcinogen-treated epithelia, but in epithelia placed in combination with carcinogen-treated mesenchyme
- in this case, the mesenchyme fails to give instructions to the epithelia to form normals structures, and epithelial cells exhibited a loose control of cell proliferation
- Defects in paracrine pathways
- Several key signaling pathways involved in embryogenesis, such as Hedgehog, Notch and Wnt, also have crucial roles in carcinogenesis when improperly activated in adults through sporadic mutatiions or other mechanisms
- many tumors, secrete the paracrine signalling factor Shh, which can act in two ways
- the same chemicals that can cause teratogenesis by blocking a pathway in embryonic development may be useful in blocking the activation of cancer cells (cancer stem cells, as I will describe next)
- Cyclopamine and other antagonists of the Shh pathway, for instance, appear to be useful in preventing hte generation and proliferation of meedulloblastoma stem cells
- Cancer stem cells
- an aspect of viewing cancers as diseases of development is that the properties of tumors may emerge because of a population of cells that are analogous to adult stem cells
- this is shown in studies on rat intestinal adenomas
- the lumen of the mice intestine is made up of villi and crypts
- at the bottom of the crypts there reside two important cells, Lrg5+ cells and Paneth cells, Lgr5+ is the stem cell and Paneth cell is the
- lineage tracing revealed that
- the stem cells of rat intestinal adenomas also expresses Lgr5 and has the same interact with P cell as normal stem cells do
References
Gilbert, Scott F., and Michael J. F. Barresi. 2016. Developmental Biology. 11th ed. Sinauer Associates.
Slack, Jonathan M. W. 2018. Essential Developmental Biology. 3rd Ser. WIley-Blackwell.
Song, Wen AND Wei, Zhou AND Yue. 2011. “Sonic Hedgehog Pathway Is Essential for Maintenance of Cancer Stem-Like Cells in Human Gastric Cancer.” PLOS ONE 6 (3). Public Library of Science: 1–13. https://doi.org/10.1371/journal.pone.0017687.
Takeo, Makoto, and Takashi Tsuji. 2018. “Organ Regeneration Based on Developmental Biology: Past and Future.” Current Opinion in Genetics & Development 52: 42–47. https://doi.org/https://doi.org/10.1016/j.gde.2018.05.008.
1 Circular Dichorism (CD)
Reference: Ranjbar and Gill (2009); Kelly, Jess, and Price (2005);Whitmore and Wallace (2008)
Circular dichorism measures the difference in absorption of left-hand and right-hand circularly polarised light by optically active (chiral) molecules (usually biological macromolecules). It serves as a rapid way to assess structural information on proteins, carbohydrates, nucleic acids, pharmaceuticals, liquiud crystals, etc., in the solution state.
1.1 Physical Principles
Electromagnetic waves (EM waves) has an electrical (E) component and a magnetic (M) component perpendicular to each other and both are perpendicular to the axis of propagation. Usually, only the E component is depicted for simplicity.
Most light sources have E components in all orientations, and when they pass through a slit, they become plane polarised, and can be represented by a simple sinusoidal wave. Adding up two plane polarised light perpendicular to each other produces interesting resultant waves, which can be visualised with plotly in R (Sievert 2018) (which is an uncommon use ‘invented’ by me1). Assuming we are superposing two sinusoidal waves of the same amplitude and frequency with various phase differences, we can then compute the pattern of the resultant wave as a function of the phase difference:
library(plotly)
library(tibble)

calc_waves <- function(phase_diff = 0){
  # compute y and z values for given x values of the waves
  # first arbitrarily choose evenly-spaced points on the x_axis
  x_axis = x=seq(1,20,0.1)
  # compute the y, z values of the first sin wave on the xy plane
  sin1 <- tibble(x=x_axis,y=sin(x),z=0)
  # compute the y, z values of the second sin wave on the xz plane,
  # taking the phase difference into account
  sin2 <- tibble(x=x_axis,y=0,z=sin(x + phase_diff))
  # compute the axes of the resultant wave
  # each y and z value is the sum of corresponding values in the 2 component waves
  resultant <- tibble(x=x_axis, y = sin1$y+sin2$y, z = sin1$z+sin2$z)

  return(list(sin1, sin2, resultant))
}

plot_waves <- function(wave_list, components = c('sin1', 'sin2'), resultant = 'resultant'){
  # plotting
  plot_ly() %>%
    add_trace(x=~x, y=~y, z=~z, name=components[1], data = wave_list[[1]], type='scatter3d', mode='lines') %>%
    add_trace(x=~x, y=~y, z=~z, name=components[2], data = wave_list[[2]], type='scatter3d', mode='lines') %>%
    add_trace(x=~x, y=~y, z=~z, name=resultant, data = wave_list[[3]], type='scatter3d', mode='lines')
}
When phase difference is zero, the resultant wave is also sinusoidal, and the plane in which it resides is oriented at 45\(^\circ\) to each component wave, as shown in Fig. 1.1 (this is an interactive HTML widget so you can rotate, drag and zoom! Unfortunately it cannot be rendered in LaTeX, so please visit ../tutorial/three-biophysical-methods.html if you are reeading the LaTeX PDF output).
calc_waves(phase_diff=0) %>% plot_waves()Figure 1.1: 0 phase difference results in a sinusoidal wave
As shown in 1.2, When the phase difference is \(\pi/2\), the resultant wave is helical and is said to be circularly polarised (for other phase differences, the pattern is helical but ellipised.
L <- calc_waves(phase_diff=pi/2)
plot_waves(L, resultant = 'resultant: left circularly polarised')
Figure 1.2: Formation of left circularly polarised wave.
L <- L[[3]] # the third tibble represents the resultant, which will be used laterNote the handedness of the resultant wave: when the phase difference is \(\pi/2\), it is left-handed and it becomes right-handed when the phase difference is \(-\pi/2\). The latter is drawn in Fig. 1.3.
R <- calc_waves(phase_diff=-pi/2)
plot_waves(R, resultant = 'resultant: right circularly polarised')
Figure 1.3: Formation of right circularly polarised wave.
R <- R[[3]]As shown in Fig. 1.4 If we add up the left and right circularly polarised light, the resultant is a plane polarised light. Thus it can be said that a plane polarised light can be viewed as being made up of two circularly polarised components of equal magnitude and frequency.
plot_waves(list(L, R,
  resultant=tibble(x=L$x, y = L$y+R$y, z = L$z+R$z)),
  components = c('left circularly polarised', 'right circularly polarised'),
  resultant = 'plane polarised')
Figure 1.4: Addition of two identical waves of oppsite handedness results in a plane polarised wave.
CD measures differential absorption of these components. If the two components are absorbed to the same extent, clearly the resultant will still be planar as shown above. If there is differential absorption, as I simulate in Fig. 1.5, the resultant wave will be elliptical polarised. Here the R component is absorbed more than the L component, and the resultant ellipsed wave is left-handed. The CD signal (formally \(\Delta A=\Delta A_\text{L}-\Delta A_\text{R}\)) is generally reported in terms of the ellipticity, \(\theta\), of this resultant wave. \(\theta=\arctan(b/a)\) where b and a are the minor and major axes of the ellipse. \(\theta\) can be easily converted to \(\Delta A\) by the simple relationship: \(\theta=32.98\Delta A\). The CD spectrum is obtained when the CD signal \(\theta\) or \(\Delta A\) is measured as a function of wavelength.
L1 <- L %>% mutate(y = 0.9 * y, z = 0.9 * z) # 10% absorption of L
R1 <- R %>% mutate(y = 0.7 * y, z = 0.7 * z) # 30% absorption of R
plot_waves(list(L, R,
  resultant=tibble(x=L1$x, y = L1$y+R1$y, z = L1$z+R1$z)),
  components = c('left circularly polarised', 'right circularly polarised'),
  resultant = 'elliptical polarised')
Figure 1.5: Differential absorption of circularly polarised light. Here 10% of the L component and 30% of the R component is absorbed (90% and 70% transmitted, respectively).
A CD signal will be observed when a chromophore is chiral (either intrinsically chiral, bonded to a chiral atom, or due to asymmetric enviornment). In proteins, such chromophores include the peptide bond (absorption below 240 nm), aromatic amino acid side chains (absorption in the range 260~320 nm) and disulphide bonds (weak absorptoin around 260 nm).
1.2 Experimental Setup
The EM wave used in CD is UV, usually with \(\lambda\) in the range 170~320 nm. Traditionally Xe arc lamps have been used as the light source of UV, but they can hardly achieve a wavelength below 180 nm. Now, high frequency UV can be generated by modern synchrotrons, and extending of CD data into the far UV region improves reliability of secondary structure prediction (see Section 1.3).
There are various methods by which the CD effect can be measured in a spectropolarimeter:
- modulation, in which the incident readiation is continuously switched between the L and R ocmponents
- direct subtraction, in whiich the absorbances of the 2 components are measured separately and subtracted from each other
- ellipsometric, in which the ellipticity of the transmitted radiation is measured
The modulation method is most commonly used. The experimental setup is described as follows:
- plane polarised light is split into the L and R components by passage through a modulator subjected to an alternating electric field
- the modulator normally consists of a piezoelectric quartz crystal and a thin plate of isotropic material (e.g. fused silica) tightly coupled to the crystal.
- the alternating electric field induces structural changes in the quartz crystal; these make the plate transmit circularly polarised light at the extremes of the field
- as the transmitted radiation of switched between L and R components, these are detecred in turn by the photomultiplier.
1.3 Application of CD
Far UV and near UV regions of CD give different information about a protein.
Absorption in the far UV region (170-250 nm) is mainly due to the \(\pi\rightarrow\pi^*\) and \(n\rightarrow\pi^*\) transitions in the peptide bonds, which is dependent on \(\Psi\) and \(\Phi\) torsional angles. Thus different types of secondary structures, such as \(\alpha\)-helices, \(\beta\)-sheets, \(\beta\)-turns, each have their characteristic CD spectrum (Fig. 1.6). These standard curves can be linearly combined to estimate the proportion of each secondary structure in a protein of interest.

Figure 1.6: Experimental setup of CD; characteristic curves of some secondary structures
The spectra in the near-UV region (260-320 nm) arise from the aromatic amino acids, each with a characteristic CD profile. The actual shape of the near UV CD spectrum will depend on the number of each type of aromic amino acid present, their mobility, their residing environment. Thus it can serve as a fingerprint of the of the tertiary structure of a protein.
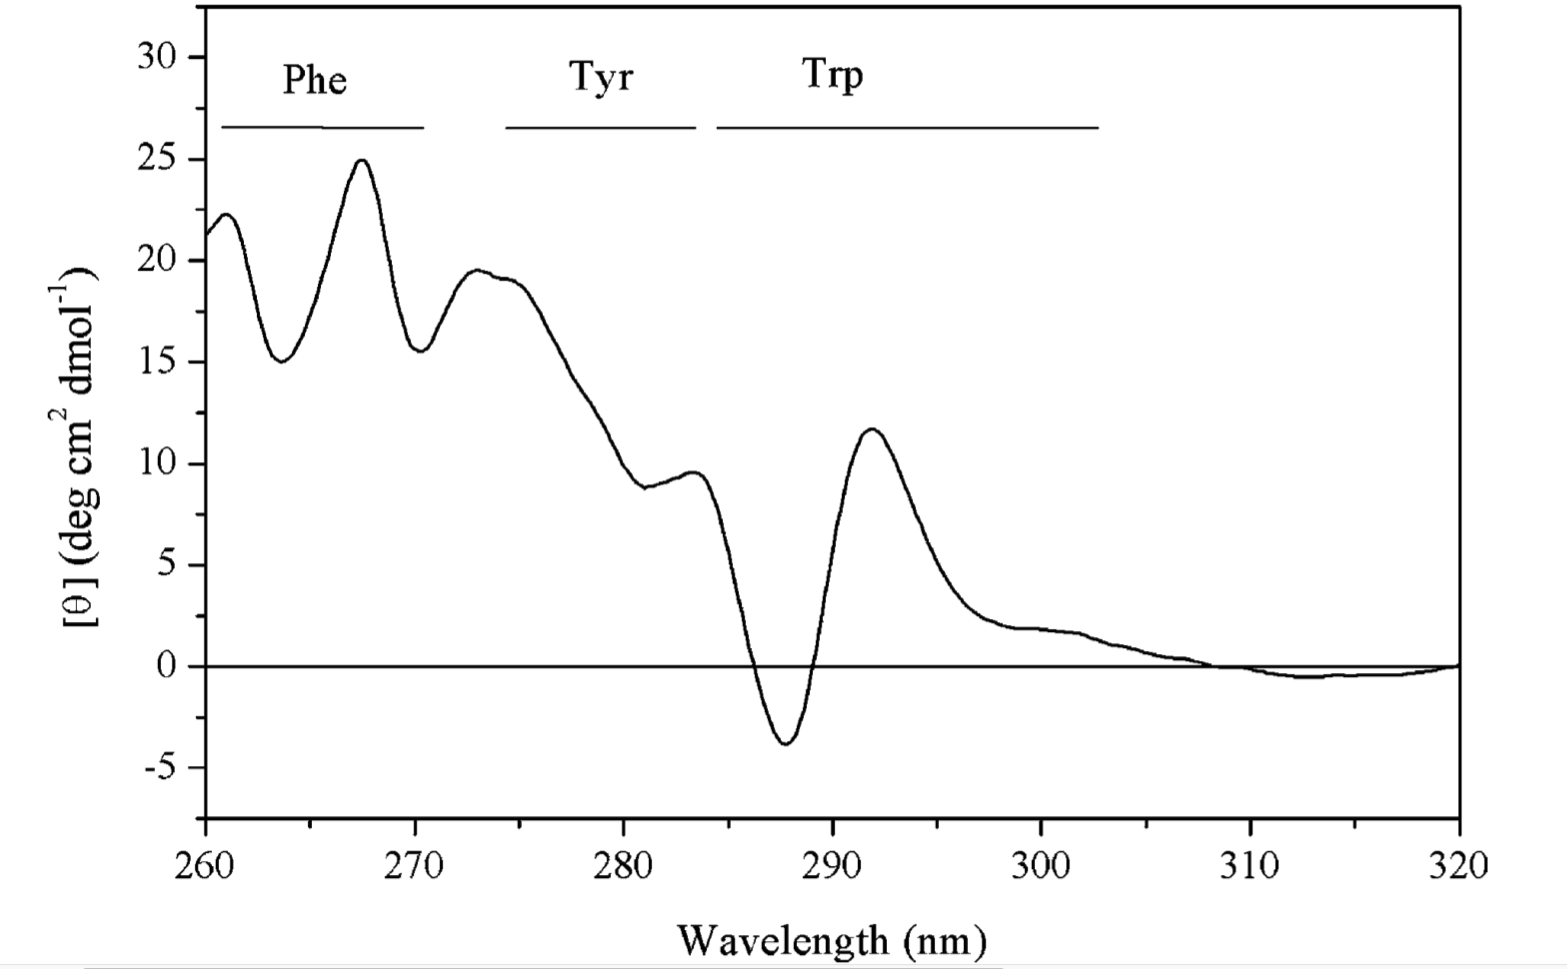
Figure 1.7: The near UV CD spectrum of a dehydroquinase, labelled with contribution from each aromatic amino acid side chain.
By combining the far- and near-UV CD spectra, we can obtain a summary of the overall structural features of the protein of interest. Although it gives little insight into the precise 3D structure of the protein, it serves at a rapid way to detect conformational differences between two similar proteins in solution. Specifically, it can be used to:
- monitor the progress of protein folding (especially the detectiion of molten globule-like structures)
- compare the wild type and mutant forms of a protein
- confirm a modification (tagging) will not affect the protein’s native conformation and normal function
- assess thermal stability (unfolding at high temperature)
- show the formation of amyloid \(\beta\) protein in Alzheimer disease (Barrow et al. 1992)
CD can not only be applied to proteins but also to other chiral molecules. Such applications include:
- determination of nucleic acid conformations (A-RNA, A-DNA, B-DNA, Z-DNA)
- determination of nucleic acid-ligand interactions, e.g. between cationic porphyrins and DNA (Pasternack 2003)
- conformational study of biomolecular interaction with nanoparticles, where the degree of protein or nucleic acid denaturation is estimated (Liu and Webster 2007)
1.4 Other CD-based Techniques
The experiment described above is the conventional electronic circular dichorism (ECD). During the past decades, many other CD-based techniques have been developed to solve more specific questions. These include magnetic CDs (MCD, magnetic vibrational circular dichroism (MVCD), XMCD), fluorescence detected CD (FDCD), near-infrared CD (NIR-CD), vibrational CDs (VCD, FTIR-VCD), HPLC-CD, stopped-flow CD, and synchrotron radiation CD (SRCD).
2 Small-angle X-ray Scattering (SAXS)
Reference: Kachala, Valentini, and Svergun (2015), Kikhney and Svergun (2015)
Small-angle X-ray Scattering (SAXS) detects the X-ray scattering pattern of macromolecules in the solution state. Information about particle shape and size can then be obtained from the angular dependence of scattering.
SAXS provides low resolution information on the structure, conformation and assembly state of proteins, nucleic acids and various macromolecular complexes. Importantly, it offers powerful means for the quantitative analysis of flexible systems, including intrinsically disordered proteins (IDPs) and multi-domain proteins with flexible linkers.
2.1 Physical Principles
The the X-ray used in SAXS has wavelength of about the same size as the macromolecules in the sample, which allows formation of interference pattern (Fig. 2.1).

Figure 2.1: (A) for an array (usually a crystal) of small scatterers whose size is small compared to the wavelength of the incident light, an interference pattern can be observed due to the fixed path differences (and hence phase differences) between any two scatterers; (B) in the solution state of such small particles, their random orientation and movement make scattering to occur in all directions (so that a pattern cannot be observed); (C) when the size of the scatterers is comparable to or greater than the wavelength, angle-dependent scatterings due the nuclei/electrons of pairs of atoms within individual particles can thus be observed (larger angle, larger path difference).
2.2 Experimentation and Data Processing
SAXS uses a collimated monochromatic X-ray beam to illuminate the sample, and the intensity of the scattered X-rays a is recorded. The scattering of the pure solvent is also collected and subtracted from the sample solution scattering. The resulting 2D scattering pattern is translated into a 1D I vs. q relationship (where I is intensity and \(q = 4\pi\sin(\theta/2)/\lambda\)), and the data is transformed and plotted in a variety of ways.
Several parameters can be calculated from SAXS data, including molecular weight, excluded particle volume, maximum dimension \(D_\text{max}\) and the radius of gyration \(R_g\).
\(R_g\) can be directly extracted from SAXS data using the Guinier approximation, which states that, when the incident angle is small (approaching 0), the angular dependence of scattering can be described by the equation \(I(q)=I_z\exp(-q^2R_g^2/3)\), where \(R_g\) is the radius of gyration of the particle. When \(\ln(I(q))\) is plotted against \(q^2\) (\(\ln(I(q)) = \ln{I_0}-(R_g^2/3)q^2\)), \(R_g^2/3\) is the slope of the resulting straight line.
\(R_g\) provides a measure of the overall size of the macromolecule. It is the average root-mean-square distance to the centre of density in the molecule weighted by the scattering length density.
Some plots can emphasised sample flexibility, e.g. a Kranky plot (\(IQ^2\) agianst \(Q\)) can help identify an unfolded protein, as shown in Fig. 2.2
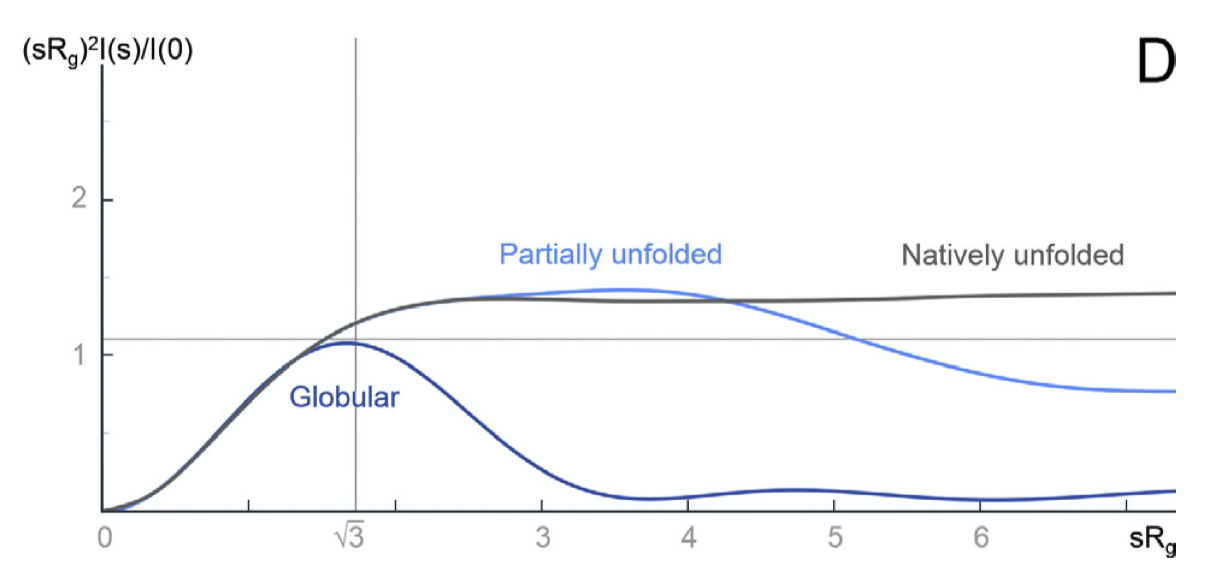
Figure 2.2: The Kratky plot
\(I(q)\) can be considered as a reciprocal space as a Fourier transform of \(p(r)\), which is the distribution of distances between pairs of atoms in real space. These two are related to each other by the equation:
\[p(r)=\dfrac{r^2}{2\pi^2}\int_0^\infty\dfrac{q^2I(q)\sin{(qr)}}{qr}ds\]
\(p(r)\) can be obtained from experimental data by indirect Fourier transformation. One such distribution is shown in Fig. 2.3.
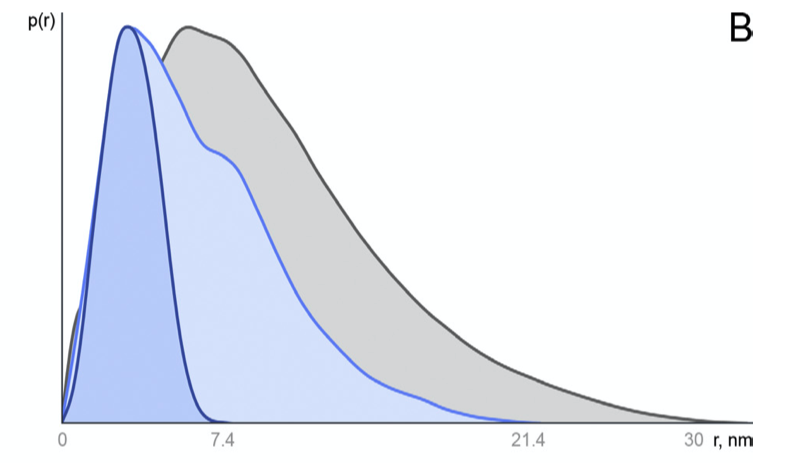
Figure 2.3: Distance distribution function p(r) vs. r. Globular compact particles have a more symmetric distribution while unfolded particles have an skewed distribution with an extended tail.
To produce meaningful results, SAXS requires that the samples to be monodisperse (non-aggregated), which can be verified by dynamic light scattering (DLS) or analytical centrifugation (AUC).
3 Analytical Ultracentrifuge (AUC)
Reference: Harding et al. (2015); Uchiyama, Noda, and Krayukhina (2018); Unzai (2018); Harding and Rowe (2010)
The analytical centrifuge (AUC) is a high speed (up to 60000 rpm) ultracentrifuge equipped with absorbance and interference detection systems, which allow the analysis of the redistribution of macromolecular solute under the influence of a centrifugal field. AUC is a convenient, matrix-free solution technique without requirement for immobilisation, columns, or membranes.
Typical AUC experiments can be classified into two types:
- sedimentation velocity experiment: record the change in concentration distribution over time (performed at high speed)
- sedimentation equilibrium experiment: record the steady state distribution of the macromolecular solute following equiilibration of centrifugal and diffusive forces (performed at lower speed)
These two methods can give information about a wide range of parameters of protein-protein interactions, including stoichiometry, reversibility, strength and, in some cases, dynamics.
Apart from protein-protein interactions, AUC is now applied to study interactions of a wider range of macromolecules, such as protein-like carbohydrate assocaition, carbohydrate-protein association (polysaccharide-gliadin), and nucleic acid protein (G-duplexes) interactions.
3.1 Choice of Optical System
Depending on the strengths of the interaction probed (and the concentration of the sample), different optical systems are used:
- for weak interactions (\(10^{-4}<K_\text{d}<10^{-1}\)), higher concentrations (>5 mg/ml) are required and the Rayleigh interference optical system is the most appropriate
- for moderate-strength interactions (\(10^{-7}<K_\text{d}<10^{-4}\), 0.1~0.5 mg/ml), either interference optics or UV absorption optics can be used
- for strong interactions (\(K_\text{d}<10^{-7}\)), dye-labelled proteins and fluorescence optics are necessary
3.2 Experiments
3.2.1 Sedimentation Velocity (SV)
In the SV experiment, measurements on the absorption (\(A\), which is proportional to local concentration) at different radial distances (\(r\)) from the rotation centre are made at fixed time intervals (\(t\)), producing a series of s-shaped curves that shift to higher \(r\) values as sedimentation proceeds (Fig. 3.1.
The spinning rotor generates a sedimentation force on a particle of \(m\omega^2r\) (\(m\) = particle mass; \(\omega\) = angular velocity; \(r\) = distance from the centre of rotation). In solution, the particle displaces solvent, so the sedimentation force acts on an effective mass, \(m_\text{eff}=m(1-\bar v\rho)\) that is less than \(m\) (\(\rho\) = solvent density; \(\bar v\) = partial-specific volume (in ml/g)). \(\bar v\) is usually calculated (for proteins, \(\bar v\) lies in the range 0.70-0.75, leading to \((1-\bar v\rho)\) of around 0.27 (in water)). At terminal velocity (acceleration = 0), the sedimentation force is balanced by the frictional force and the velocity can be described by the equation \(v=m(1-\bar{v}\rho)\omega^2r/f\), where \(f\) is the friction coefficient, which is related to the diffusion coefficient, \(D\), by \(f=RT/N_\text{A}D\). The equation can thus be arranged to \(v=DM(1-\bar{v}\rho)\omega^2r/RT\). By defining the sedimentation coefficient as \(s=v/\omega^2r\), the Svedberg equation can be written as \(s=\dfrac{DM(1-\bar{v}\rho)}{RT}\).
The sedimentation coefficient \(s\), which is experimentally determined in SV has the unit Svedberg (S) where 1 S = 10-13 seconds. The greater the molecular weight or more compact/spherical (less friction) the macromolecule is, the larger its \(s\) value. Usually the experimentally measured \(s_\text{exp}\) is standarised to \(s_{20, \text{w}}\), which is the value that would have been observed in water at 20\(^\circ\)C, using the relationship \(s_{20, \text{w}}=\dfrac{s_\text{exp}(\eta_\text{exp}(1-\bar{v}\rho_\text{20,w})}{(\eta_\text{20,w}(1-\bar{v}\rho_\text{exp})}\), where \(\eta\) and \(\rho\) refer to the viscosity and density of the buffer.
The Lamm equation, derived from Svedberg equation and Fick’s diffusion laws, describes the time dependence of the concentration:
\[\frac{\partial c}{\partial t}=D\left[\left(\frac{\partial^2 c}{\partial r^2}\right)+\frac{1}{r}\left(\frac{\partial c}{\partial r}\right)\right]-s\omega^2\left[r\left(\frac{\partial c}{\partial r}\right)+2c\right]\]
Solving this diffential equation leads to \(g(s)\), which is the distribution of \(s\). SEDFIT is one of the softwares specialised in solving this. SEDFIT can either give the uncorrected \(g(s)\) versus \(s\) profile, or it can give a distribution, known as \(c(s)\) vs. \(s\), which has been corrected for diffusion broadening (this assumes all particles have the same frictional ratio \(f/f_o\)). The \(g(s)\) vs. \(s\) or \(c(s)\) vs. \(s\) can further be converted to a molecular weight distribution, \(c(M)\) vs. \(M\), which is analogous to a mass spectrum (Fig. 3.1). SEDFIT is particularly good at evaluating homogeneity/heterogeneity of a prepation. Where the solution is heterogeneous, it can estimate the proportion of each sedimenting species and ascertain whether there is a reversible equilibrium.

Figure 3.1: Schematic of data processing in SV experiments. The raw data collected is a series of curves recorded at fixed intervals, each showing the variation of the absorbance with the distance from the rotation centre. By solving the Lamm equation, this is transformed to a g(s) vs. s plot, or c(s) vs. s plot if it is denoised by SEDFIT. It can be further transformed into a c(M) vs. M plot (distribution of molecular weights), assuming constant frictional ratio \(f/f_o\)
SV also gives information about the shape. The friction coefficient, \(f\), can be easily calculated from the terminal velocity (\(v=m(1-\bar{v}\rho)\omega^2r/f\)), and the friction ratio, \(f/f_o\) (where \(f_o=6\pi r\eta\)), shows diviation of the molecular shape from the sphere.
SV can also be applied for interaction analysis, and the simpest case is co-sedimentation. For example, the binding of adenosylcobalamin cofactor to the methylmalonyl-CoA mutase system from Propionibacterium shermanii was demonstrated by AUC with UV-absoption system. At a wavelength selected to detect the ligand only, in the presence of the mutase, all ligands sediment at the same rate as the protein, confirming the ligand is 100% bound.
In SV analysis, the emergence of new peaks at higher concentrations, shifts in the ratios of the peak areas, and/or shifts in peak positions are indicative of protein-protein interactions.
Fig. 3.2 shows an SV experiment which studies the binding between the Bacillus stearothermophilus 11-mer protein TRAP (trp RNA-binding attentuation protein) and Anti-TRAP (AT). As the TRAP:AT ratio increases froom 1:0 to 1:6, the peak representing TRAP shifts to higher s, indicating rapid and reversible binding between TRAP and AT (slow/irreversible interaction would result in separate peaks). The plot also shows that TRAP was saturated with AT at a 1:6 stoichiometry (as increasing ratio to 1:10 did not result in further shifts) and that the TRAP-AT complex was stable to excess AT (no negative feedback loop).
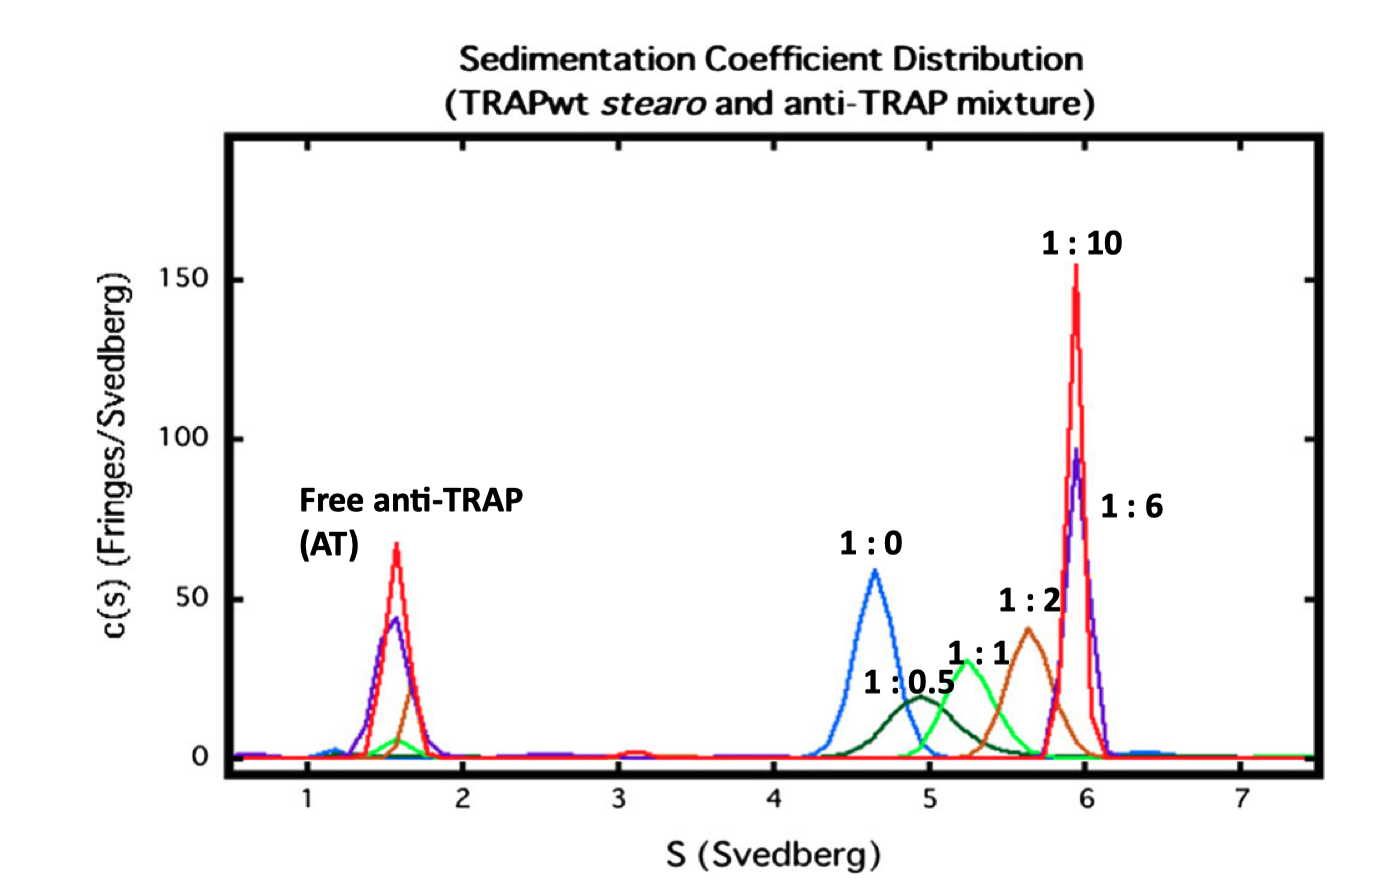
Figure 3.2: SV analysis of TRAP and AT. The TRAP concentratioin was fixed at 0.5 mg/ml, and varying amounts of AT (TRAP’s ligand) were added, with molar ratios of TRAP:AT labelled.
References
Barrow, Colin J., Akikazu Yasuda, Peter T.M. Kenny, and Michael G. Zagorski. 1992. “Solution Conformations and Aggregational Properties of Synthetic Amyloid β-Peptides of Alzheimer’s Disease: Analysis of Circular Dichroism Spectra.” Journal of Molecular Biology 225 (4): 1075–93. https://doi.org/https://doi.org/10.1016/0022-2836(92)90106-T.
Harding, Stephen E, Richard B Gillis, Fahad Almutairi, Tayyibe Erten, M Şamil Kök, and Gary G Adams. 2015. “Recent Advances in the Analysis of Macromolecular Interactions Using the Matrix-Free Method of Sedimentation in the Analytical Ultracentrifuge.” Biology 4 (1). MDPI: 237–50. https://doi.org/10.3390/biology4010237.
Harding, Stephen E., and Arthur J. Rowe. 2010. “Insight into protein–protein interactions from analytical ultracentrifugation.” Biochemical Society Transactions 38 (4): 901–7. https://doi.org/10.1042/BST0380901.
Kachala, Michael, Erica Valentini, and Dmitri I Svergun. 2015. “Application of Saxs for the Structural Characterization of Idps.” Advances in Experimental Medicine and Biology 870. United States: 261–89. https://doi.org/10.1007/978-3-319-20164-1{\_}8.
Kelly, Sharon M, Thomas J Jess, and Nicholas C Price. 2005. “How to Study Proteins by Circular Dichroism.” Biochimica et Biophysica Acta 1751 (2). Netherlands: 119–39. https://doi.org/10.1016/j.bbapap.2005.06.005.
Kikhney, Alexey G., and Dmitri I. Svergun. 2015. “A Practical Guide to Small Angle X-Ray Scattering (Saxs) of Flexible and Intrinsically Disordered Proteins.” FEBS Letters 589 (19, Part A): 2570–7. https://doi.org/https://doi.org/10.1016/j.febslet.2015.08.027.
Liu, Huinan, and Thomas Jay Webster. 2007. “Nanomedicine for Implants: A Review of Studies and Necessary Experimental Tools.” Biomaterials 28 (2): 354–69. https://doi.org/https://doi.org/10.1016/j.biomaterials.2006.08.049.
Pasternack, Robert F. 2003. “Circular Dichroism and the Interactions of Water Soluble Porphyrins with Dna—a Minireview.” Chirality: The Pharmacological, Biological, and Chemical Consequences of Molecular Asymmetry 15 (4). Wiley Online Library: 329–32.
Ranjbar, Bijan, and Pooria Gill. 2009. “Circular Dichroism Techniques: Biomolecular and Nanostructural Analyses—a Review.” Chemical Biology & Drug Design 74 (2). England: 101–20. https://doi.org/10.1111/j.1747-0285.2009.00847.x.
Sievert, Carson. 2018. “Plotly for R.” 2018.
Uchiyama, Susumu, Masanori Noda, and Elena Krayukhina. 2018. “Sedimentation Velocity Analytical Ultracentrifugation for Characterization of Therapeutic Antibodies.” Biophysical Reviews 10 (2). Springer Berlin Heidelberg: 259–69. https://doi.org/10.1007/s12551-017-0374-3.
Unzai, Satoru. 2018. “Analytical Ultracentrifugation in Structural Biology.” Biophysical Reviews 10 (2). Springer Berlin Heidelberg: 229–33. https://doi.org/10.1007/s12551-017-0340-0.
Whitmore, Lee, and B A Wallace. 2008. “Protein Secondary Structure Analyses from Circular Dichroism Spectroscopy: Methods and Reference Databases.” Biopolymers 89 (5). United States: 392–400. https://doi.org/10.1002/bip.20853.
suprisingly, this graphing library originally not designed for math plotting worked pretty well, and is much easier to use (and more powerful in terms of interactivity) than other professional math plotting libraries. I even used plotly to plot proteins and it worked quite decently!)↩
Compare the strengths and limitations of Electron Microscopy and X-ray crystallography. Which types of biological specimen can be studied with the respective methods, and how can cryo-EM and X-ray crystallography be combined to obtain novel structural information?
Introduction
Being able to solve macromolecular strucutures at atomic resolution, X-ray crystallography has long been the most powerful tool in structural biology. As of Feb 16 2019, 167943 molecular structures have been deposited into the Protein Data Bank (PDB) since its launch in 1971. However, recent improvements in the field of electron microscopy, especially the introduction of the use of cryocooling, have revolutionised the way cellular material is viewed. In conjunction with computational methods, cryo-EM can now solve macromolecular structures at sub-atomic or even atomic resolution. The structures publicised on Electron Microscopy Data Bank (EMDB) has grown exponentially over the last two decades, from only 8 in 2002 to more than 10000 on Feb 16 2020. In this breif narrative, I introduce the basic principles of both methods, their strengths and limitations, and how they can complement each other in modern structural biology studies.
X-Ray Crystallography
In short, structural determination using X-ray crystallography involves making the appropriately-sized crystals of the protein of interest, gaining electron density maps by deciphering X-ray diffraction patterns obtained from these crystals, and filling the map with amino acids (and prosthetic groups or other ligands).
Prior to the X-ray experiment, the protein must be crystallised. This is often the most laborious and time-consuming step, involving numerous trial-and-errors. In modern high throughput methods, a wide range of crystallisation constructs are designed (which involves truncation the protein of interest, expression with a fusion partner, binding with a ligand, use of different detergents, etc.), and robots are used to deploy these crystallisation conditions in multiwell plates and to monitor the growth of crystals. One of the critial factors in the sucess of crystallisation is aqueous solubility, which represents the major bottleneck in solving membrane protein structures (Parker and Newstead 2016).
In the X-ray experiment, the crytal is mounted on a support which can be rotated in any direction, and is cryocooled in order to minimise radioactive damage and random thermal vibration, thus improving signal-to-noise-ratio (contrast). For every orientation of the crystal, a monochromatic X-ray is applied, and the detector records the position and intensity of the reflections (points) in the diffraction pattern.
Crystallisation is needed for two reasons. First, the diffraction signal given by a single protein molecule is too weak to be detected. Second, incoherent scattering causes serious chemical damage to protein molecules, and if we try to image a single molecule with X-rays, it would be destroyed as soon as it scattered one or two photons and no longer represent the native protein structure. Crystallisation forms an array of a substantial number of protein molecules arranged in the same orientation (so that their diffraction properties are the same) so the radiation damage in a small number of molecules becomes negligible. Every molecule in the array gives the same diffraction signal, thus achieving amplification.
X-rays with wavelengths within the range 0.5-1.6Å are used in crystallography. X-rays above this range are ‘soft X-rays’ that penerate crystals without scattering. Generally, X-rays of shorter wavelengths are more preferable because of two reasons. First, this generally gives better resolution. According to this rearranged form of Bragg’s equation, \(\dfrac{n_{max}}{d}\propto\dfrac{1}{\lambda}\), as wavelength (\(\lambda\) decreases), smaller \(d\) (distance between crystal lattice planes) can be distinguished with the same \(n\) (number of constructive interference). Second, X-rays with shorter \(\lambda\) are scattered more, thus producing stronger signals for a fixed amount of sample, which allows crytals of smaller sizes to be studied. However, using X-rays of too short wavelengths (and using too small crystals) have the disadvantage that a greater proportion of proteins would be damaged due to the higher energy of the X-ray and the smaller sample size. Traditional X-rays sources are characteristic radiations from a Cu anode (CuK\(\alpha\), \(\lambda\)=1.54Å) or a Mo anode (MoK\(\alpha\), \(\lambda\)=0.71Å) when bombarded by electrons beams at appropriate potential difference from the cathode. Since the 1960s, synchrotrons (e.g. Diamond Light Source in Oxfordshire) have become available as more intense and X-ray sources. In these giant devices, electrons travel on a circular track in vacuum, emitting intense X-rays in tangential directions. Electrical disturbances in synchrotron allow for production of X-rays with any \(\lambda\) within the useful range 0.5-1.6Å, and this makes it possible to use multiple anomalous dispersion (MAD) method to solve the phase problem.
The diffraction patterns only give information on the position amplitude of every reflection, but an additional parameter, phase, is required to do the inverse Fourier transform that would give the electron density map. Single/multiple isomorphous replacements (SIR/MIR) using heavy metals represent the earliest attempts to solve the phase problem. Later, with the advent of synchrotrons, multi-wavelength anomalous dispersion (MAD) became the more popular phasing strategy. Recently, thank to the numerous experimental structures solved previously and publicised in PDB, molecular replacement (MR) has become the most efficient way to solve the phase problem.
After solving the first electron density map using inverse Fourier transform, the structure is refined by optimising the parameters of the model to fit the observations in a iterative process.
Today, abundant software packages are available for data collection and processing, structure solution, refinement and validation.
Cryo-Electron Microscopy
Electron microscopy (EM) is mechanistically similar to light microscopy (LM). Electron beams (which is analogous to visible light beams in LM) hit the sample, and their path is regulated by a set of electromagnets (analogous to lens in LM) so that they finally converge onto a plane where an enlarged image of the sample can be detected.
Unstained samples have a very poor singal-to-noise ratio (contrast) under EM, and traditionally heavy metal are applied to improve contrast. However, this often leads to unwanted artefacts and can only achieve resolutions at 20-40Å. High electron dose improves contrast but causes damage to the specimen.
Cryo-EM partially solves this problem by reducing the effect of radiation damage using low temperature. In cryo-electron microscopy, protein solutions are applied onto a support grid, and is then plunge-frozen with liquid ethane. The process is so fast that the water adopts a vitreous form instead of crystallises into ice. The vitrified sample is then maintained at low temperature with liquid nitrogen during storage and EM studies.
Another challenge of cryo-EM is the movement of the particles when being hit by the electron beam, which leads to blurred images on conventional CCD/photographic films (because they are less sensitive and need a long time of exposure). This is solved by the more sensive and faster direct electron detectors which can record movies at a rate of many fps. The traces of molecules recorded in the movies can be computationally processed to give much sharper images. The motion is in part due to the different thermal expansion coefficients between the metal grid and the carbon film, and choosing metals that have similar thermal properties with carbon (e.g. titanium, molybdenum or tungsten instead of copper or gold) can minimise this effect (Sgro and Costa 2018).
There are two major strategies of constructing 3D models using cryo-EM, namely electron tomography and single-particle cryo-EM. In electron tomography, the specimen is tilted in all directions and respective EM images are recorded, which are combined (similar to CT) into a 3D model. It is commonly used to visualise one-of-a-kind, structurally heterogeneous entities (such as viruses and whole bacterial cells) at resolutions 50-100Å. Single-particle cryo-EM are usually used to study smaller entities such as the ribosome and proteins. In this approach, a large number (tens or hunders of thousands) of 2D images are extracted from EM images. These heterogeneous low-resolution ‘snapshots’ are computationally sorted and aligned (sometimes called in silico purification), and finally used to synthesise the 3D model using Fourier transform.
Comparison of Strengths and Limitations
The most significant advantage of X-ray crystallography is its resolution. 2.05Å is the median resolution for X-ray crystallographic results in the protein data bank (as of May 19, 2019, according to Proteopedia, but I will do the analysis myself on Monday. I have downloaded all the entire PDB repository.). The protein backbone and most sidechains can be identified unambiguously under this resolution. Strikingly1, however, this long unrivalled strength of X-ray crystallography is now challeged by cryo-EM—Wu el al.2 claimed cryo-EM solution of mouse heavy chain apoferritin at 1.75Å!
A major advantage of cryo-EM over X-ray crystallography is the ease and speed of sample preparation, as the proteins need not to be crystallised and only a small amount is needed. Another related merit is its forgiveness of heterogeneity, as robust computational methods can ‘purify’ proteins in silico. Furthermore, cryo-EM are suited for studying membrane proteins and multiprotein supra-assemblies/RNP machines, which are difficult to crystallise in their native states. However, it should be noted that during the process of specimen preparation, delicate protein complexes may become associated so that they no longer represent their in vivo state.
Combining X-ray and Cryo-EM studies
Today, it is common to combine the results of X-ray crystallography and cryo-EM studies for structural determination. There are two major ways in which these two methods can complement each other. First, a low-resolution cryo-EM map can provide an overall shape of the macromolecule, whose sub-components are solved at a high resolution by X-ray crystallograhy and docked onto the EM map. Second, the cryo-EM model may help to solve the phase problem in X-ray crystallography by serving as a search model in molecular replacement (MR).
The docking methods can be classified into two categories: rigid-body docking and flexible docking. Both are used to find the optimal position and orientation of sub-component X-ray structures in the cryo-EM map, but the the latter entails additional algorithms such as normal mode analysis and molecular dynamic simulation that introduce minor conformational changes within stereochemistry limits in X-ray structures to minimise local conformational discrepancy between the X-ray and cryo-EM models. The docking is useful to define the protein location and protein-protein interface within a complex and new interaction modes that are not revealed by X-ray crystallography.
The electron density map (strictly speaking, Coulomb potential density map) obtained by Cryo-EM, albeit at a low resolution, has information about the phase, and thus can be used as an initial phasing model for X-ray studies. Once the search EM map has been positioned, theoretical phases can be calculated by Fourier transform up to the EM model resolution.
Concluding Remarks
The past decade has witnessed a resolution revolution in single particle cryo-EM, making them another powerful tool in solving biological macromolecules after X-ray crystallography. The different perspectives provided by these two methods is helping us to gain a more complete understanding of molecualr mechanisms that underlie the principle of life.
References
Cheng, Yifan. 2018. “Single-Particle Cryo-Em—How Did It Get Here and Where Will It Go.” Science 361 (6405). American Association for the Advancement of Science: 876–80. https://doi.org/10.1126/science.aat4346.
Earl, Lesley A, Veronica Falconieri, Jacqueline LS Milne, and Sriram Subramaniam. 2017. “Cryo-Em: Beyond the Microscope.” Current Opinion in Structural Biology 46: 71–78. https://doi.org/https://doi.org/10.1016/j.sbi.2017.06.002.
Elmlund, Dominika, Sarah N Le, and Hans Elmlund. 2017. “High-Resolution Cryo-Em: The Nuts and Bolts.” Current Opinion in Structural Biology 46: 1–6. https://doi.org/https://doi.org/10.1016/j.sbi.2017.03.003.
Jain, Deepti, and Valerie Lamour. 2010. “Computational Tools in Protein Crystallography.” Methods in Molecular Biology (Clifton, N.J.) 673. United States: 129–56. https://doi.org/10.1007/978-1-60761-842-3_8.
Kühlbrandt, Werner. 2014. “Microscopy: Cryo-Em Enters a New Era.” eLife 3. eLife Sciences Publications, Ltd: e03678. https://doi.org/10.7554/eLife.03678.
Milne, Jacqueline L S, Mario J Borgnia, Alberto Bartesaghi, Erin E H Tran, Lesley A Earl, David M Schauder, Jeffrey Lengyel, Jason Pierson, Ardan Patwardhan, and Sriram Subramaniam. n.d. “Cryo-Electron Microscopy–a Primer for the Non-Microscopist.” The FEBS Journal 280 (1): 28–45. https://doi.org/10.1111/febs.12078.
Nogales, Eva. 2018. “Cryo-Em.” Current Biology 28 (19): R1127–R1128. https://doi.org/https://doi.org/10.1016/j.cub.2018.07.016.
Parker, Joanne L, and Simon Newstead. 2016. “Membrane Protein Crystallisation: Current Trends and Future Perspectives.” Advances in Experimental Medicine and Biology 922. Springer International Publishing: 61–72. https://doi.org/10.1007/978-3-319-35072-1_5.
Powell, Harold R. n.d. “X-Ray Data Processing.” Bioscience Reports 37 (5). Portland Press Ltd.: BSR20170227. https://doi.org/10.1042/BSR20170227.
Rhodes, Gale. 2006. “An Overview of Protein Crystallography.” In Crystallography Made Crystal Clear, edited by Gale Rhodes, 3rd ed., 7–30. Complementary Science. Burlington: Academic Press. https://doi.org/https://doi.org/10.1016/B978-012587073-3/50004-0.
Rupp, Bernhard. 2010. Biomolecular Crystallography: Principles, Practice, and Application to Structural Biology. Garland Science.
Sgro, Germán G, and Tiago R D Costa. 2018. “Cryo-Em Grid Preparation of Membrane Protein Samples for Single Particle Analysis.” Front Mol Biosci 5. Departamento de Bioquı'mica, Instituto de Quı'mica, Universidade de São Paulo, São Paulo, Brazil.; Department of Life Sciences, Imperial College London, MRC Centre for Molecular Microbiology; Infection, London, United Kingdom.: 74. https://doi.org/10.3389/fmolb.2018.00074.
Wang, Hong-Wei, and Jia-Wei Wang. 2017. “How Cryo-Electron Microscopy and X-Ray Crystallography Complement Each Other.” Protein Science 26 (1): 32–39. https://doi.org/10.1002/pro.3022.
Whitford, David. 2005. “Physical Methods of Determining the Three-Dimensional Structure of Proteins.” Book. In Proteins: Structure and Function. Sussex, England: John Wiley & Sons.
Xiong, Yong. 2008. “From electron microscopy to X-ray crystallography: molecular-replacement case studies.” Acta Crystallographica Section D 64 (1): 76–82. https://doi.org/10.1107/S090744490705398X.
I was REALLY shocked when when facing the search results on EMDB website. According to reviews written in 2014, 4.5Å was still the best resolution ever achieved at that time, and in less than 6 years cryo-EM is becoming able to provide atomic resolution as does X-ray crystallography!↩
1 Introduction
The modes of bacterial cell division vary, but the most common one is binary fission (Stahl 2019), and its mechanism, especially in rod-shaped model organisms Escherichia coli and Bacillus subtilis, has been studied extensively. Despite the characterisation of most proteins required for divisome, their coordination at the molecular detail remain largely unclear (Tsang and Bernhardt 2015). The question of how bacteria divide is further complicated by variations in proteins involved, and even in the physical nature, among different bacterial species (Eswara and Ramamurthi 2017)
This essay introduces FtsZ as a highly conserved protein involved in septum formation and its regulation in model organsisms, and gives examples on diviations from these rules that mainly comes from studies on nonmodel organisms.
2 Preparation for Cell Division
The chromosome must be replicated once and only once prior to cell devision, and it must be ensured that each daughter cell receives one copy of the chromosome.
2.1 Chromosome Replication
Chromosome replication is principally regulated by DnaA in E. coli. DnaA initiates replication by binding its active, GTP-bound form (DnaA-ATP) to OriC. Its inactivation upon initiation of replication ensures one round of replication per cell cycle1. Such mechanisms include competition for OriC binding by SeqA, repression of dnaA expression (also by SeqA), and inactivation of DnaA-ATP by the ATPase HdaA.
2.2 Chromosome Segregation
Segregation of chromosomes and plasmids is achieved while they are being replicated by using the Par system in some bacteria such as the budding bacteria Caulobacter crescentus, as illustrated in Figure 2.1. popZ proteins anchors the chromosome at its parS sequence (near oriC) to the old pole, which is mediated by parB. As replication starts, more parB binds to parS sequence of the newly synthesised chromosome, and is pulled to the new cell pole by the ATPase activity of ParA.
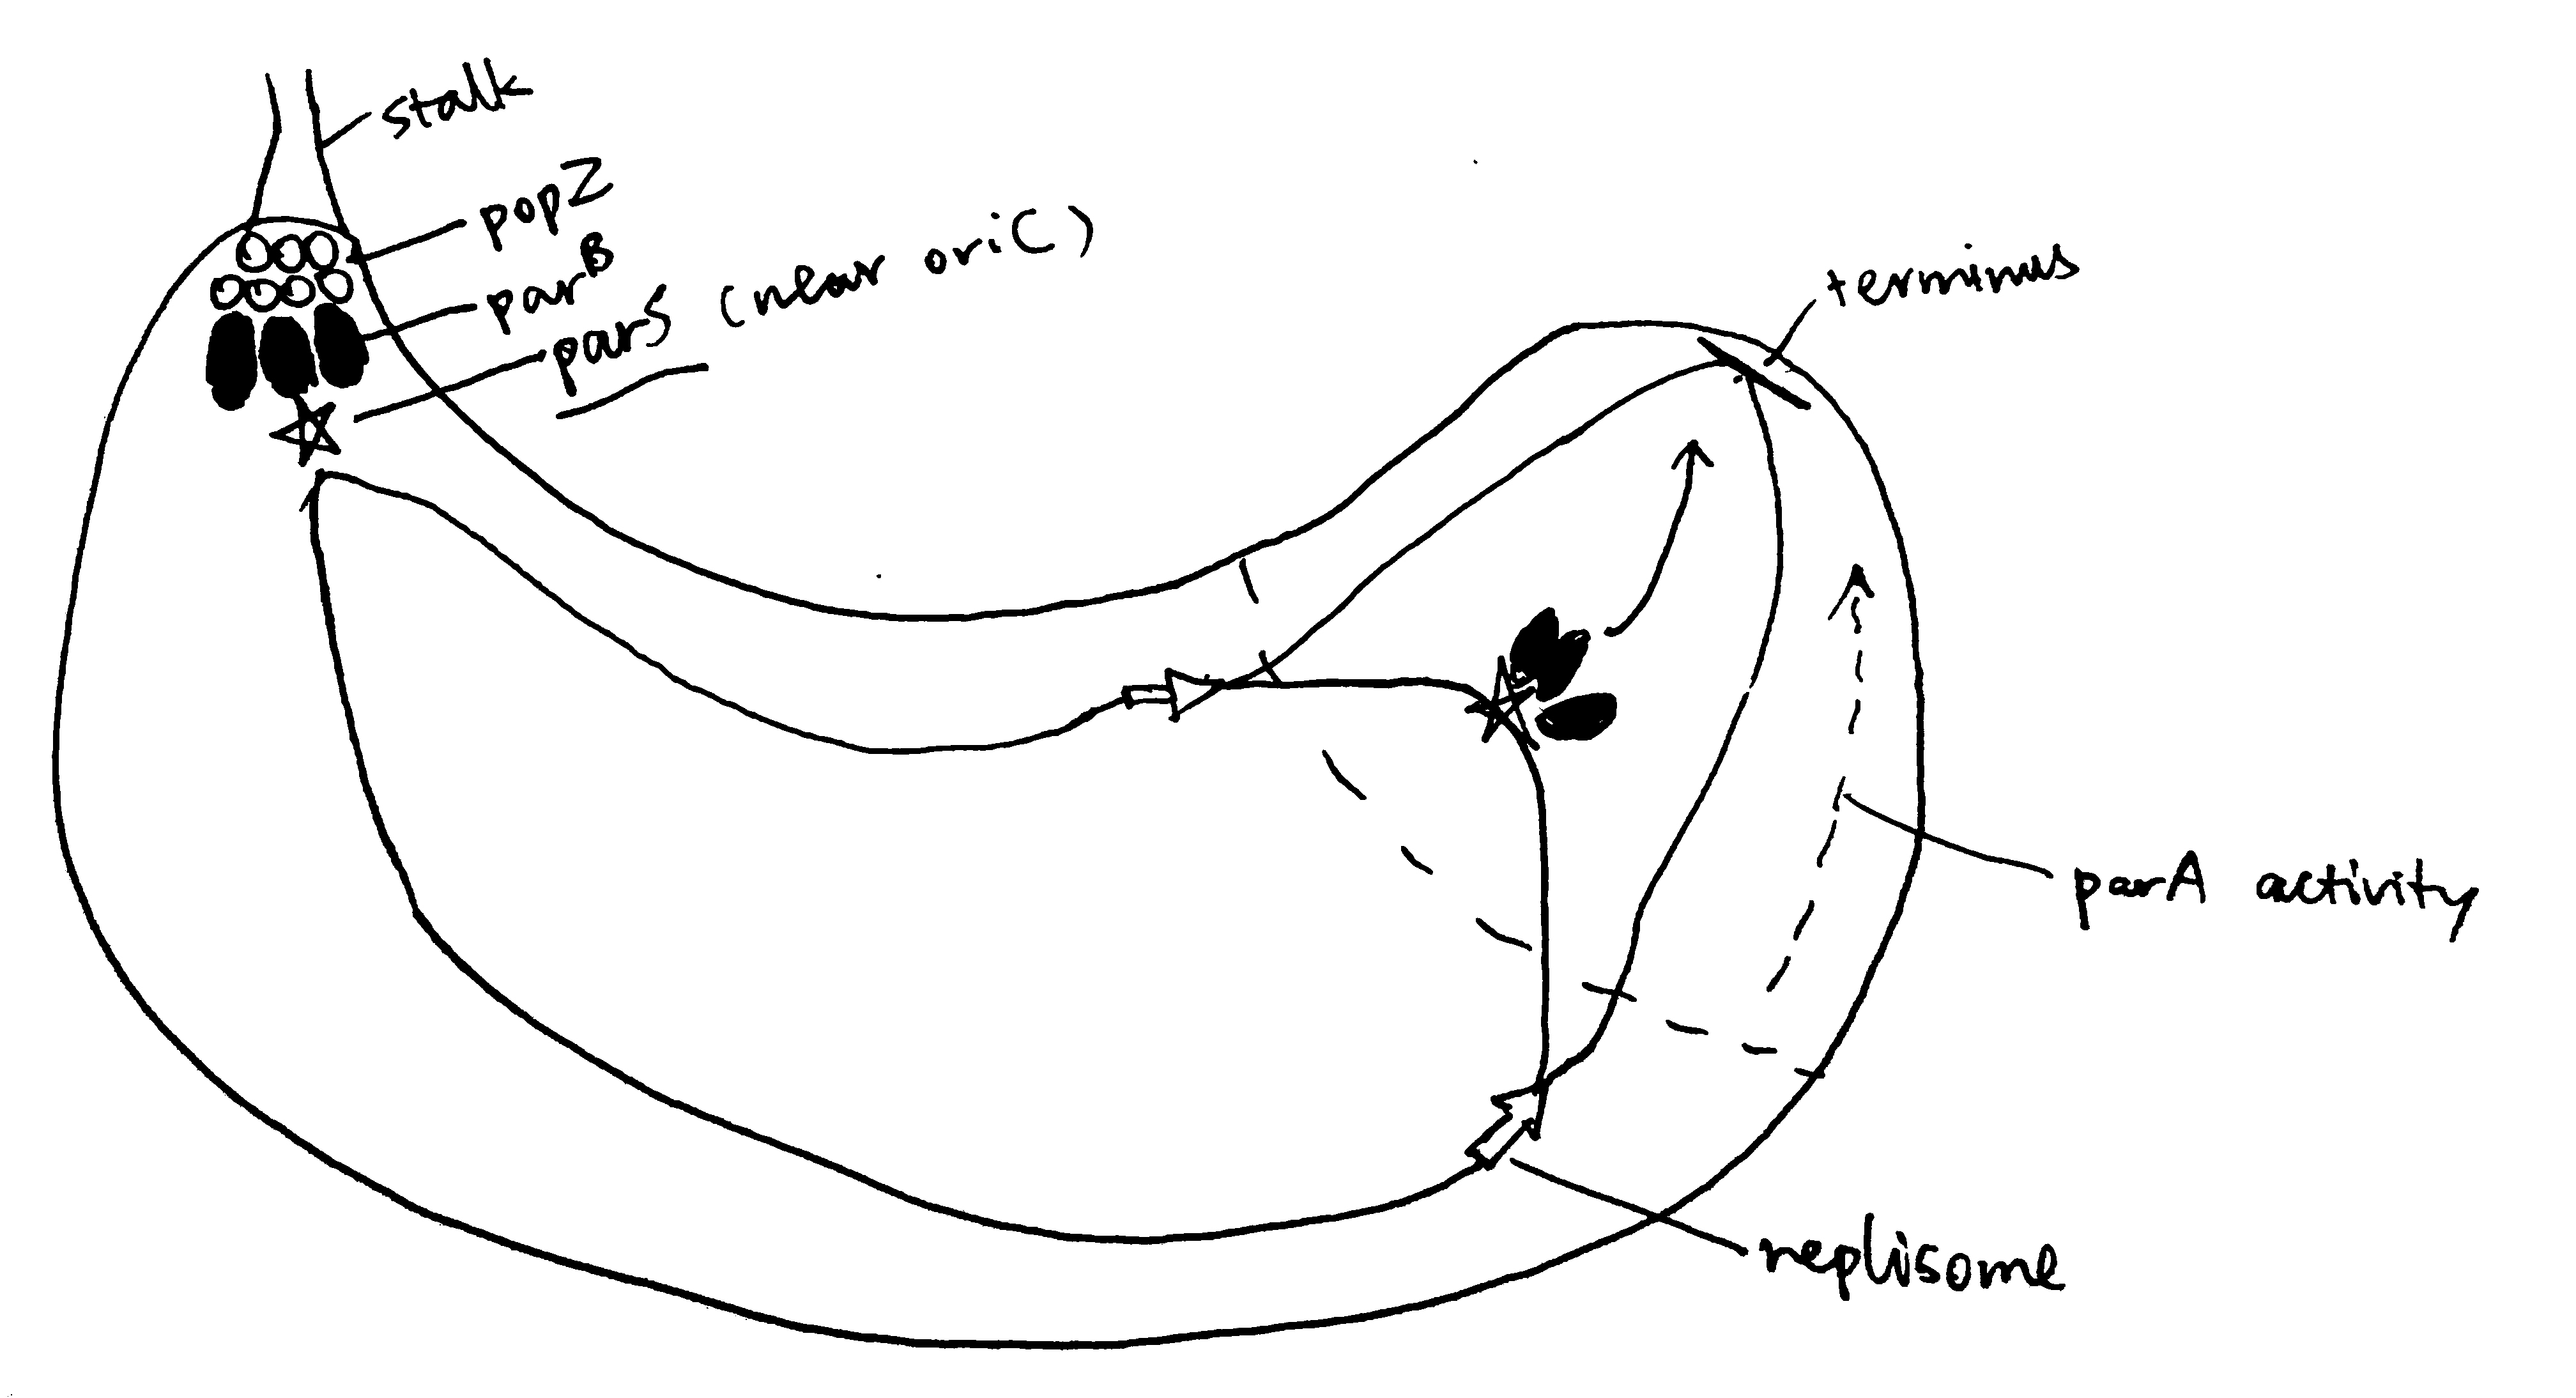
Figure 2.1: The Par system segregates replicated chromosomes in Caulobacter crescentus.
The mechanism of chromosome segregation in E. coli, which lacks Par, is not well characterised.
3 FtsZ and the Z-ring
Central to almost all bactrial division is the FtsZ protein. FtsZ is a homolog of tubulin found in most bacteria and some archaea. Like tubulin, FtsZ is a GTPase and can polymerise into filaments. During cell division, FtsZ filaments assemble into a ring (Z-ring) at the site where the septum forms. The FtsZ ring then recruits other proteins of the divisome, allowing division to proceed. The Z-ring contracts as the bacterium divides, forming an invagination which finally divides the bacterium in two.
The GTPase activity accounts for the rapid turnover dynamics of the FtsZ filaments that form the Z-ring. It has also been proposed that FtsZ’s GTPase activity energises the constriction of the ring and the invagination of the cell membrane and the cell wall, but this notion is challenged by the observation of mutants that are severely impoaired in GTP hydrolysis still capable of dividing, and mathematical modelling that shows force generation could be achieved independenly of GTPase activity, but instead with hydrolysis (Adams and Errington 2009).
3.1 Z-ring Placement
The site of cell division in rod-shaped bacteria is usually at the centre of the cell, which is dependent on the corrent placement of the Z-ring. As shown in Figure 3.1, this is typically achieved using two mechanisms, nucleoid occlusion (NO), and the Min system, which are well characterised in E. coli and B. subtilis. It should be noted, however, that there is increasing evidence showing Z-ring positioning may be determined by other factors, and Min and NO systems may primarily function to ensure the efficient utilisation of this site. Such evidence include the observation of precise midcell Z-ring formation in Min- and Noc-null B. subtilis by Rodrigues and Harry (2012).
3.1.1 The Min system
The MinC, MinD and MinE proteins interact to prevent Z-ring formation at the poles (Ghosal et al. 2014; Ramm, Heermann, and Schwille 2019). MinC is the effector of the system owing to its inhibitory effect on FtsZ ring assembly. MinD is an ATPase which recruit MinC to the membrane. MinCD complex together inhibit Z-ring formation. MinE is an ATPase-activating protein which has an anti-MinCD domain and a topological specificity domain (which confines its anti-MinCD activity only at midcell). The three proteins MinCDE form an oscillation cycle from pole to pole (driven by MinDE), causing the time-averaged concentration of MinCD complexes to be lowest at the midcell, which favours Z-ring formation there. B. subtilis also has a Min system but it is not involved in the placement of the Z-ring.
3.1.2 Nuclear Occlusion
Nuclear occlusion prevents Z-ring formation atop of nucleoids. It is mediated by SlmA in E. coli and Noc in B subtilis. Neither are normally essential in their respective organisms, but both are synthetically lethal with mutatations of Min, due to chaotic FtsZ assembly.
According to Adams, Wu, and Errington (2015), Noc has a sequence-specific DNA-binding domain and a membrane-associating domain. Noc is thought to oligomerise using their two dimerisation domains, bind to DNA at specific sequences, and then insert into the inner leaflet of the cytoplasmic membrane.
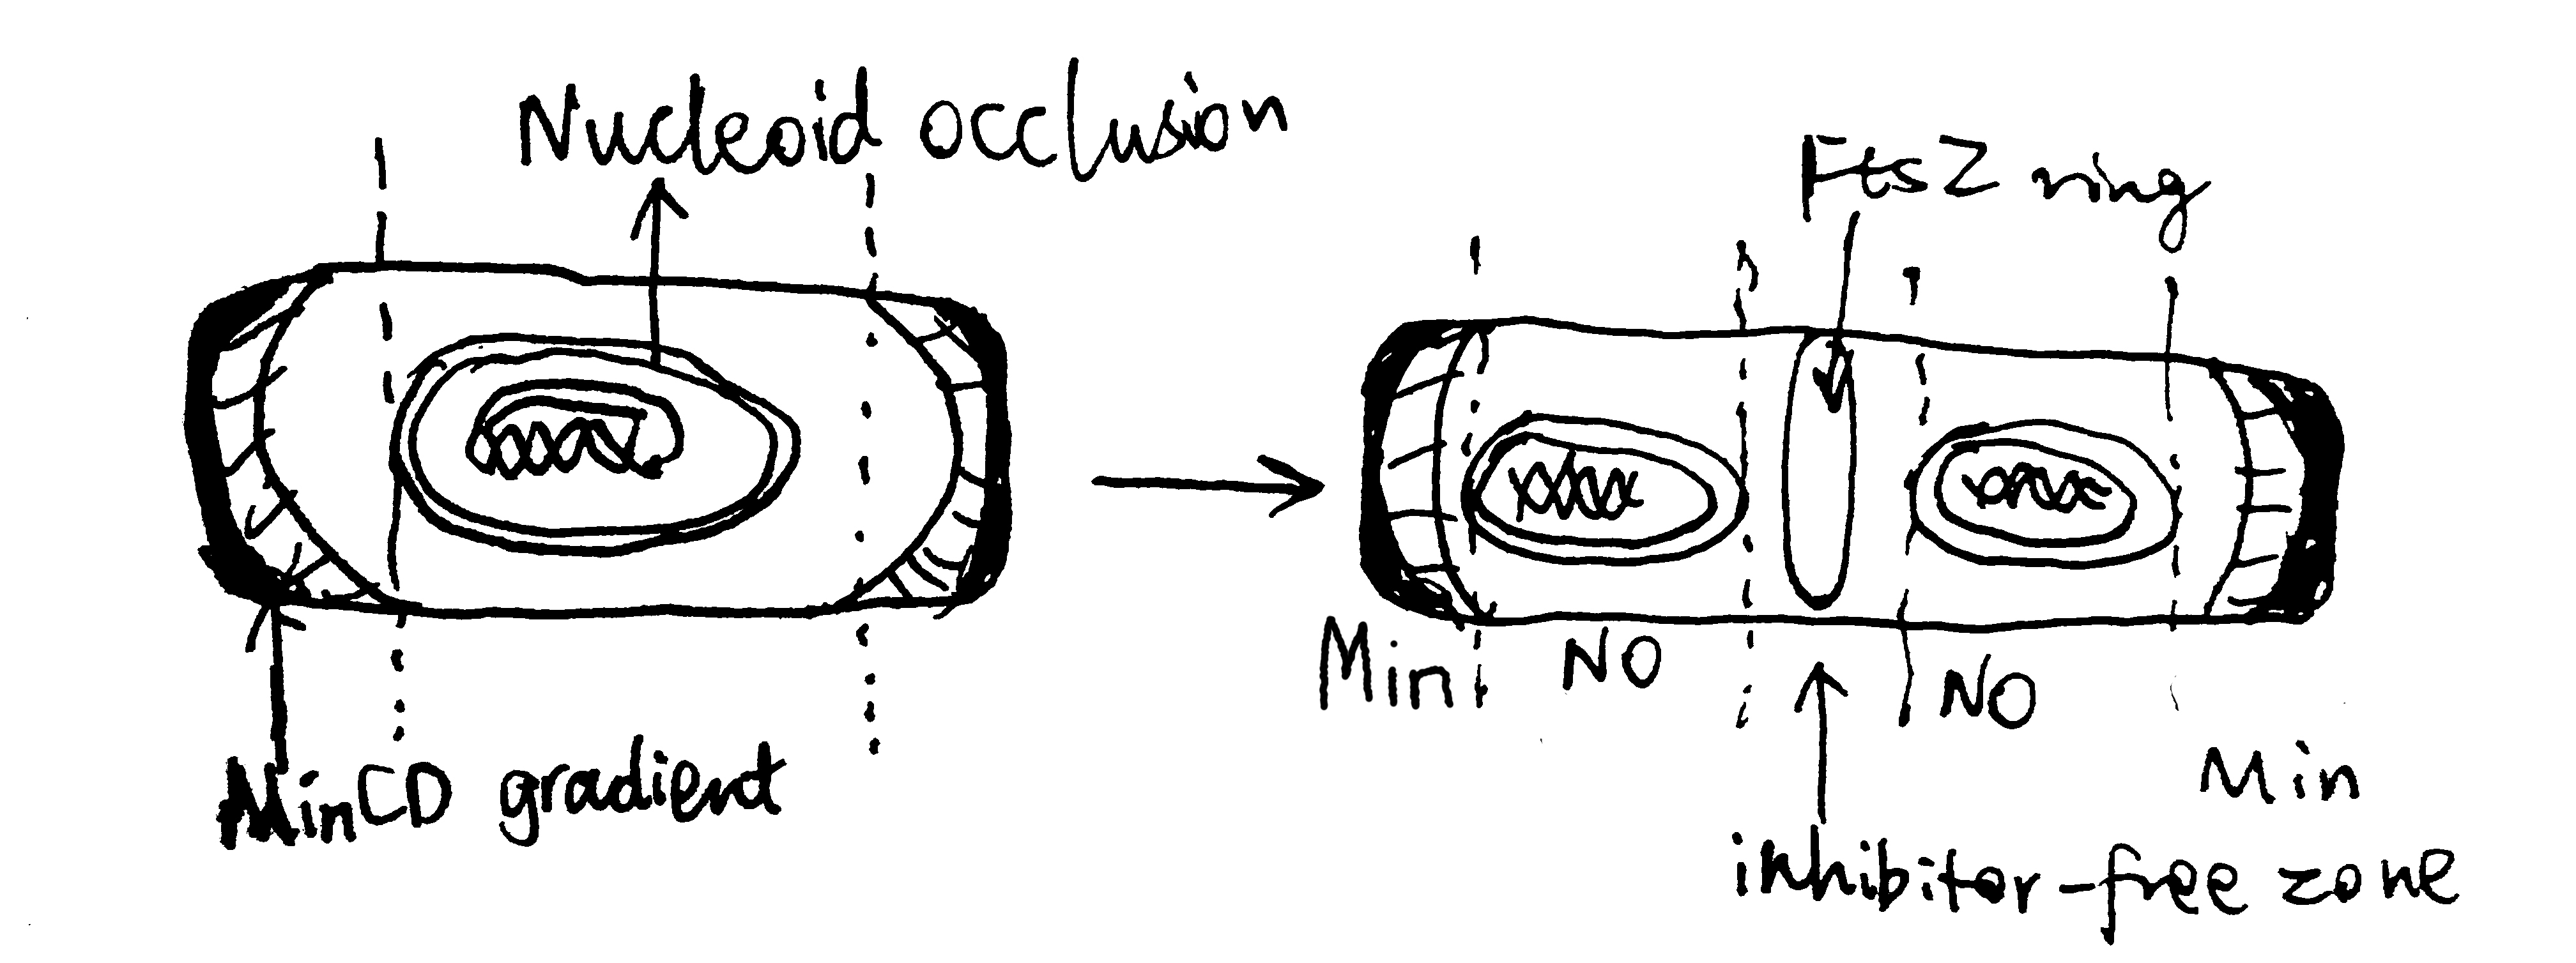
Figure 3.1: Negative regulation by nuclear occulation and the Min system ensures formation of the FtsZ ring in E coli.
3.2 Other Key Proteins in the Divisome
A fully functional divisome requires a combination of proteins in addition to the FtsZ ring. Most of these proteins have close association with the Z ring. In E. coli, It was thought that the recruitment of these proteins appears to have a linear dependecy pathway which starts with FtsA/ZipA and ends with FtsN, but a recent review by Du and Lutkenhaus (2017) shows evidence for the noon-sequential assembly of the divisome.
3.2.1 ZipA and FtsA
ZipA is acts to tether the FtsZ ring to the cytoplasmic membrane. It is not widely conserved outside of Gammaproteobacteria, and, in E. coli, its necessity in cell division is bypassed by a gain-of-function mutation in FtsA. FtsA, which is more widely conserved in bacteria, also anchors the Z ring to the membrane and coordinates its initial assembly (Adams and Errington 2009).
FtsA is related to actin, and, like actin, it binds ATP and is found to reversibly polymerise into corkscrew-like helices in Streptococcus pneumoniae. Its ATPase activity is reported in B. subtilis but not in S. pneumoniae. Mutagenesis studies suggest that nucleotide binding may be required for FtsA’s ability to interact with itself and with FtsZ, (Pichoff and Lutkenhaus 2007) but its exact role is unknown.
FtsA differs from actin in that it is missing the 1B domain and it has an unrelated subdomain called 1C. The 1C domain is involved in recruiting downstream components of the divisome to the Z ring.
3.2.2 Downstream Proteins Recruited by the FtsZ Ring
Upon assembly of the FtsZ ring, other downstream proteins, notably those involved in peptidoglycan biosynthesis, are recruited to form the divisome.
FtsI, also known as penicillin binding protein 3 (PBP3), is one such protein in E. coli. It is required specifically for peptidoglycan synthesis at the septum (Chen and Beckwith 2001). Its recruitment is dependent on FtsK, which appears to be a bifunctional protein, with the C-terminal domain facilitating segregation of chromosome and the N-terminal domain carrying out a necessary, but undefined, function in septum development.
A summary of the divisome components is shown in Figure 3.2
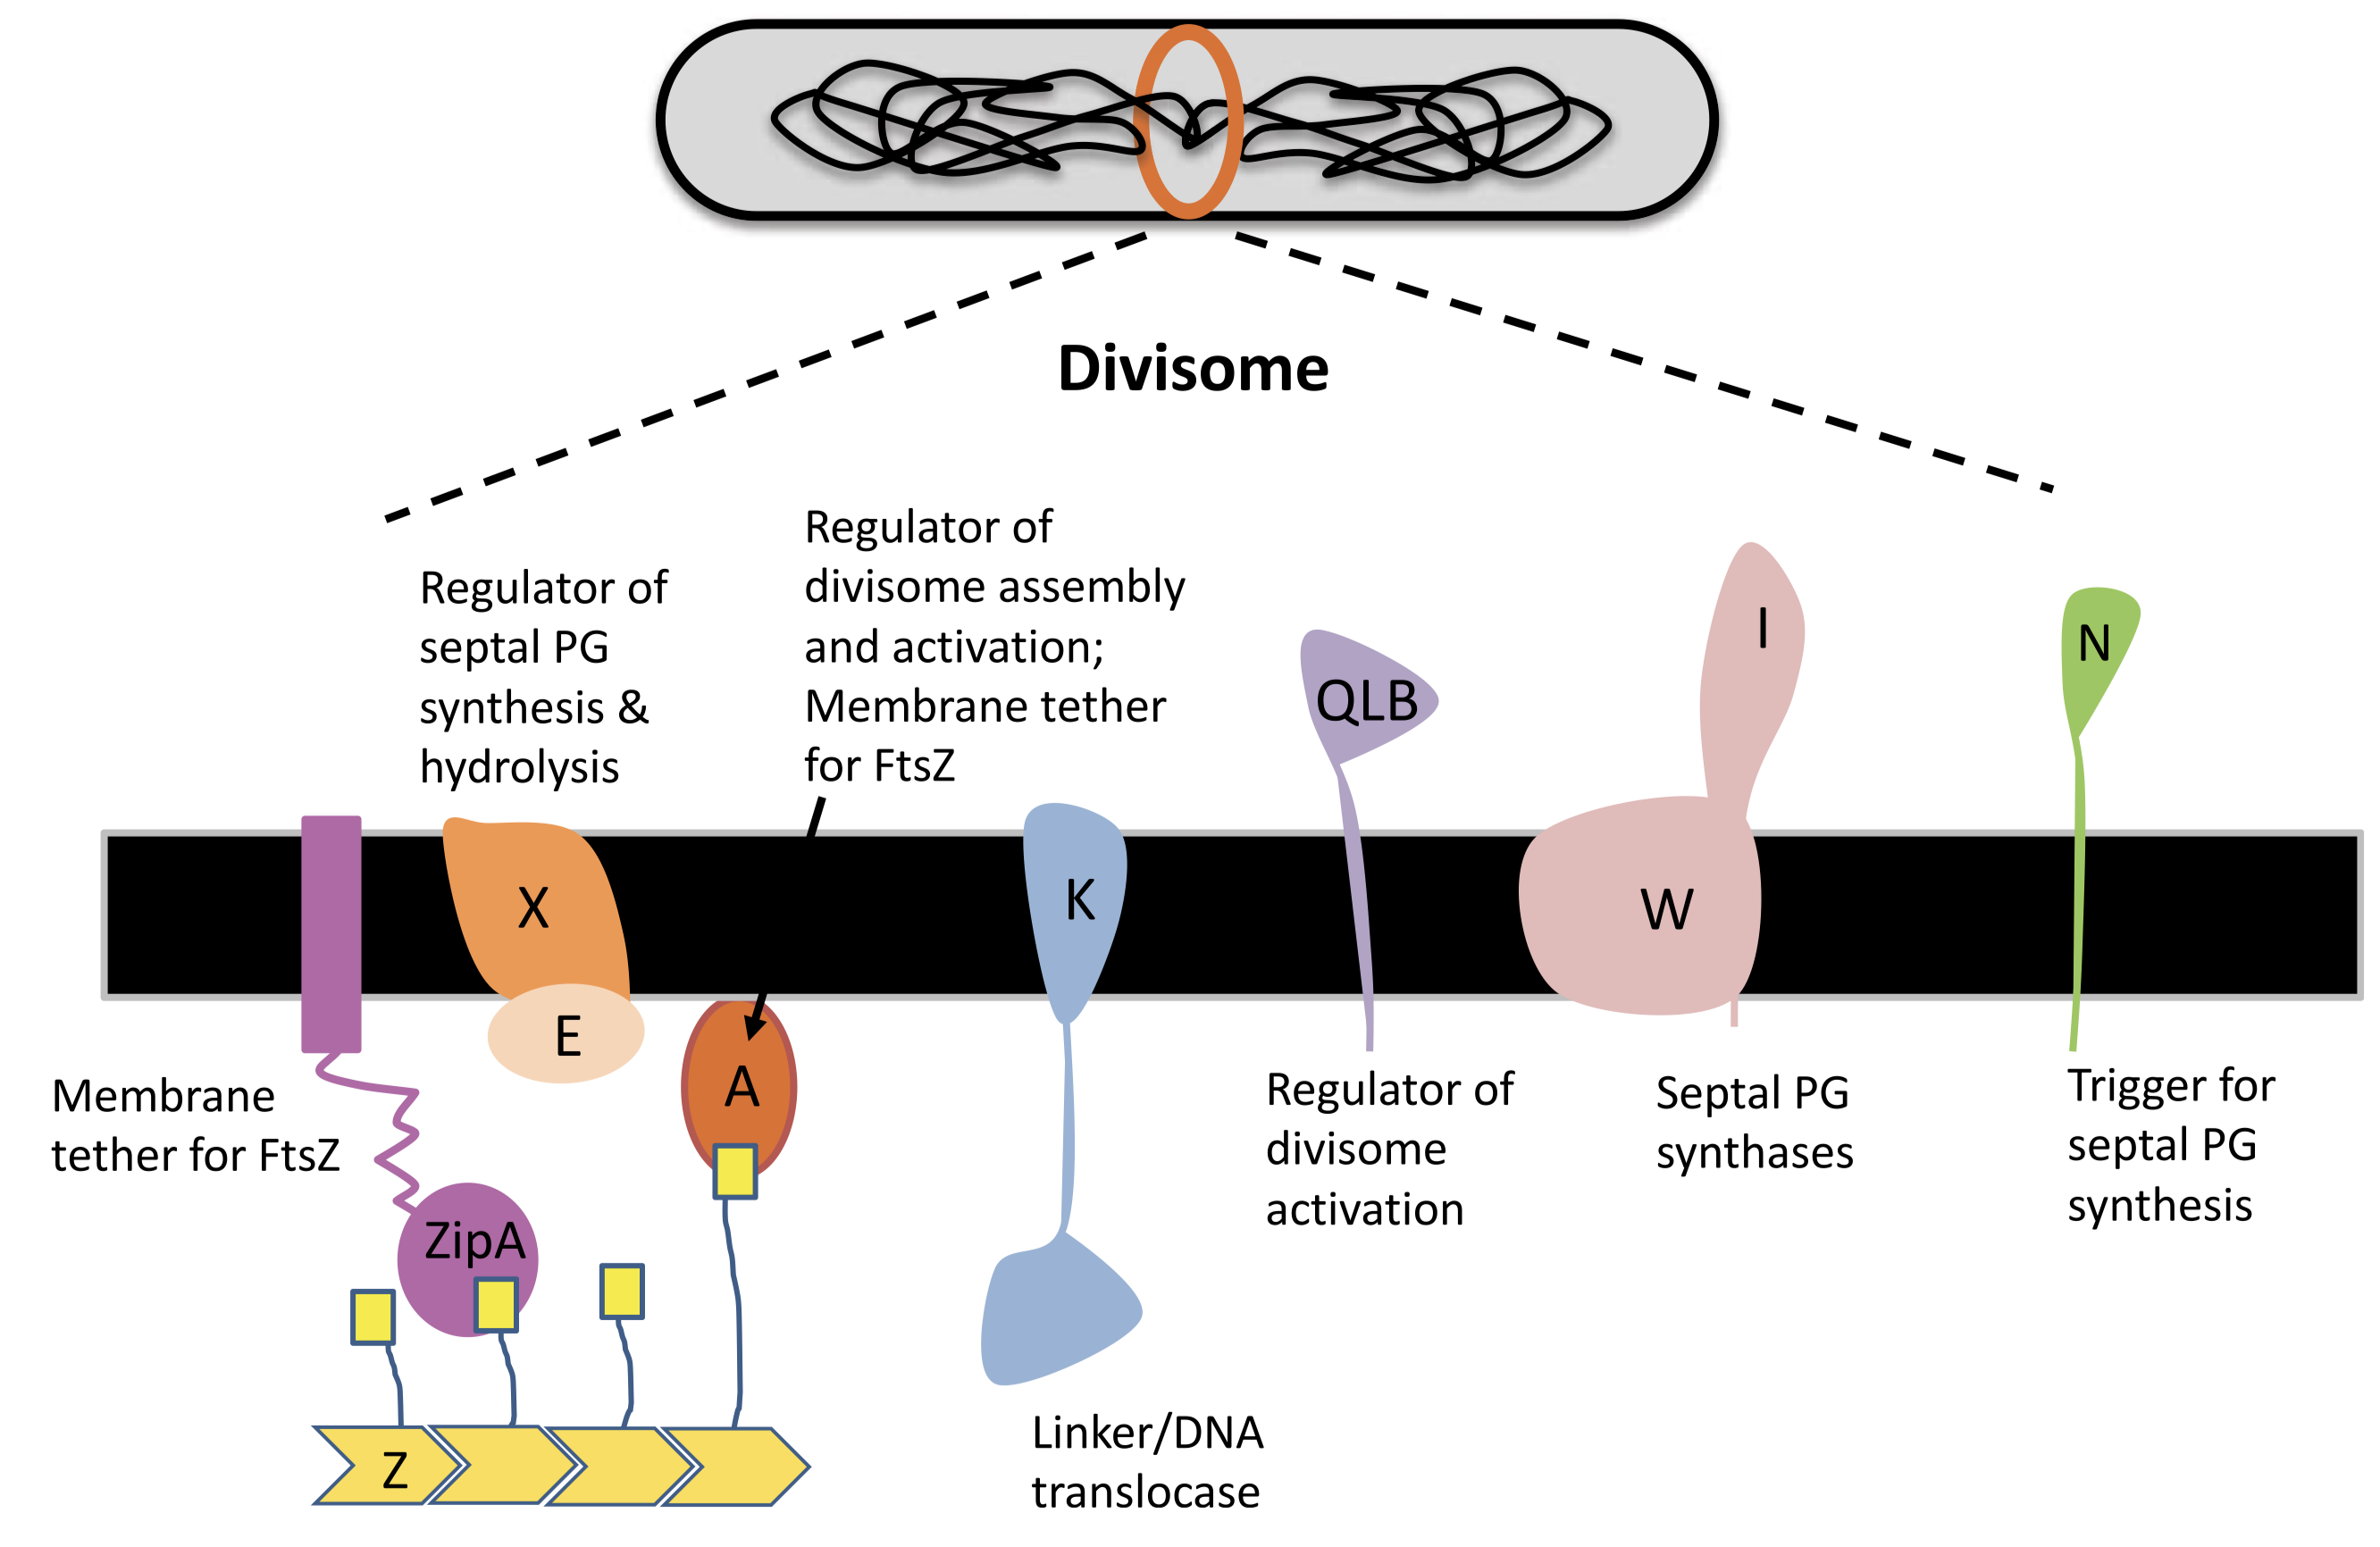
Figure 3.2: Components of the divisome.
3.2.3 FtsN
In E. coli, FtsN is the last component of recruited to the divisome. Once it arrives at the Z ring, the divisome begin to actively synthesising septal peptidoglycan to divide the cell. It has been suggest that FtsA-FtsN interaction may trigger cell constriction in a positive feedback loop (Tsang and Bernhardt 2015), but the exact mechanism remain elusive.
4 Alternative Strategies for Bacterial Cell Division
4.1 Alternative strategies of Binary Division
Binary division means dividing a bacterial cell into daughter cells with equal volume and physiology, which requires the FtsZ ring to form at the midcell. Apart form the NO and Min systems described above, there are other strategies to achieve this.

Figure 4.1: Alternative strategies of Binary Division
4.1.1 Caulobacter crescentus
The budding bacteria C. crescentus uses the MipZ gradient to regulate FtsZ ring placement (Figure 4.1 A). MipZ is translocated from the old pole to the new pole during chromosome replication and segregation, by directly interacting with the ParB-parS complex (see section 2.2). MipZ displaces FtsZ from polar regions, thus permitting ring formation only at midcell.
4.1.2 Campylobacter jejuni and Magnetotactic Bacterium
The amphitrichous2 bacteria Campylobacter jejuni uses the ATPase FlhG, which is a MinD/ParA homologue and a known regulator of flagellar number, to locate the Z ring placement, by expelling FtsZ from the two longitudinal poles where flagella grow.
By constrast, in the monotrichohus magnetotactic bacterium of the Gammaproteobacteria class, flagellum formation in the daughter cell is dictated by the septum (Figure 4.1 B and C).
4.1.3 Agrobacterium Tumefaciens
Most bacteria that exhibit binary division elongate their cells from the middle or at several locations perpenticular to the long axis (e.g. in E. coli, which is mediated by MreB). However, Agrobacterium Tumefaciens, which elongates unidirectionally, can still achhive binary division. As shown in Figure 4.1 D, after division, FtsA and FtsZ stay at the newly formed growth pole and facilitate polar growth. Upon elongation, they relocate to the midcell to initiate division.
4.2 Positive Regulation in Myxococcus xanthus
The NO and Min systems described above are both negative regulatory mechanisms, where regions of low activity of relevant proteins allows for foramtion of FtsZ ring. There is evidence in some nonmodel organisms of positive regulation, where FtsZ ring formation is promoted by presence of certain proteins. This is exemplified by the deltaproteobacterium M. xanthus, in which the ParA-like protein PomZ localises to midcell in an FtsZ-independent manner before FtsZ ring formation.
4.3 Cell Division without FtsZ
In some species of Mycoplasma (which are well known for their small genomes), the FtsZ homologue is absent (Lluch-Senar, Querol, and Piñol 2010). Although the cell division mechanisms in these organisms remain elusive, they lead to reassessments on the role of FtsZ in FtsZ-dependent cell division. For example, as reviewed by Xiao and Goley (2016), it is likely that the main driving force for membrane invagination and constriction is not directly provided by FtsZ, but by the peptidoglycan synthesis.
5 Concluding Remarks
There is an extensive repertoire of cell division strategies based on distinct families of proteins in the domain of bacteria. The lack of universal conservation and the ease of horizontal gene transfer among bacteria make cell division a suboptimal target of antibiotics. Indeed, most available antibiotics related to bacterial cell division target cell wall synthesis, and there is little progress made on developing drugs that interferes with other components of bacterial divisome.
References
Adams, David W., and Jeff Errington. 2009. “Bacterial Cell Division: Assembly, Maintenance and Disassembly of the Z Ring.” Nature Reviews Microbiology 7 (9): 642–53. https://doi.org/10.1038/nrmicro2198.
Adams, David William, Ling Juan Wu, and Jeff Errington. 2015. “Nucleoid Occlusion Protein Noc Recruits Dna to the Bacterial Cell Membrane.” EMBO J 34 (4): 491–501. https://doi.org/10.15252/embj.201490177.
Alberts, Bruce, Alexander Johnson, Julian Lewis, David Morgan, Martin Raff, Keith Roberts, and Peter Walter. 2014. Molecular Biology of the Cell. Book. 6th ed. Garland Science.
Chen, Joseph C., and Jon Beckwith. 2001. “FtsQ, Ftsl and Ftsi Require Ftsk, but Not Ftsn, for Co-Localization with Ftsz During Escherichia Coli Cell Division.” Molecular Microbiology 42 (2): 395–413. https://doi.org/10.1046/j.1365-2958.2001.02640.x.
Du, Shishen, and Joe Lutkenhaus. 2017. “Assembly and Activation of the Escherichia Coli Divisome.” Molecular Microbiology 105 (2): 177–87. https://doi.org/10.1111/mmi.13696.
Eswara, Prahathees J., and Kumaran S. Ramamurthi. 2017. “Bacterial Cell Division: Nonmodels Poised to Take the Spotlight.” Annual Review of Microbiology 71 (1): 393–411. https://doi.org/10.1146/annurev-micro-102215-095657.
Ghosal, Debnath, Daniel Trambaiolo, Linda A. Amos, and Jan Löwe. 2014. “MinCD Cell Division Proteins Form Alternating Copolymeric Cytomotive Filaments.” Nature Communications 5 (1): 5341. https://doi.org/10.1038/ncomms6341.
Lluch-Senar, Maria, Enrique Querol, and Jaume Piñol. 2010. “Cell Division in a Minimal Bacterium in the Absence of ftsZ.” Molecular Microbiology 78 (2): 278–89. https://doi.org/10.1111/j.1365-2958.2010.07306.x.
Pichoff, Sebastien, and Joe Lutkenhaus. 2007. “Identification of a Region of Ftsa Required for Interaction with Ftsz.” Molecular Microbiology 64 (4): 1129–38. https://doi.org/10.1111/j.1365-2958.2007.05735.x.
Ramm, Beatrice, Tamara Heermann, and Petra Schwille. 2019. “The E. Coli Mincde System in the Regulation of Protein Patterns and Gradients.” Cellular and Molecular Life Sciences 76 (21): 4245–73. https://doi.org/10.1007/s00018-019-03218-x.
Rodrigues, Christopher D. A., and Elizabeth J. Harry. 2012. “The Min System and Nucleoid Occlusion Are Not Required for Identifying the Division Site in Bacillus Subtilis but Ensure Its Efficient Utilization.” PLOS Genetics 8 (3). Public Library of Science: 1–20. https://doi.org/10.1371/journal.pgen.1002561.
Stahl, Michael T Madigan; Kelly S Bender; Daniel Hezekiah Buckley; W Matthew Sattley; David Allan. 2019. “Molecular Biology of Microbial Growth.” In Brock Biology of Microorganisms, Fifteenth edition, Global edition. Pearson.
Tsang, Mary-Jane, and Thomas G Bernhardt. 2015. “Guiding Divisome Assembly and Controlling Its Activity.” Current Opinion in Microbiology 24: 60–65. https://doi.org/https://doi.org/10.1016/j.mib.2015.01.002.
Xiao, Jie, and Erin D Goley. 2016. “Redefining the Roles of the Ftsz-Ring in Bacterial Cytokinesis.” Current Opinion in Microbiology 34: 90–96. https://doi.org/https://doi.org/10.1016/j.mib.2016.08.008.
For the second tutorial, I want you to try some proper molecular biology using online tools, just as we do every day in the lab. Try it out on your own first, though you may wish to discuss any issues you may be having with each other. Please bring files/printouts and if you have one, your laptop to the tutorial. You will find NCBI BLAST useful and various links within www.expasy.org (e.g. In proteomics section, Clustal, T-coffee, Translate, prot param etc). You may also like to download ApE or Snapgene viewer from the web but make sure you scan with e.g. Sophos before you open them. You can do full in silico cloning in ApE (but only in the expensive paid-for version of Snapgene) but Snapgene (even free viewer) offers much better visualization so you may want to use both but for different features. For structural productions, Swissprot is convenient, then for mutagenesis, move to Pymol or equivalent.
Mystery gene (lower case = non-coding, upper case = coding)

GTATTTTGCGTCCATTTCGATCAAAAGACTATTTCTCATTTCCTCCCACGATTTTAGATAATAATATTATCTTATGTCATGCACAGATGATAAGTGATGATGACGATCTACCATCTACTCGCCCGGGATCTGTGAATGAGGAATTACCAGAAACCGAACCCGAAGATAATGATGAGTTGCCTGAAACAGAACCTGAAAGCGATTCCGATAAACCTACCGTAACCTCGAATAAAACAGAAAACCAAGTTGCTGATGAAGATTATGATTCATTCGACGATTTTGTGCCCAGTCAAACACACACAGCCTCCAAAATACCTGTAAAAAATAAACGAGCCAAAAAGTGCACTGTAGAATCTGATTCATCATCTTCGGATGATTCCGATCAAGGAGATGATTGTGAATTTATCCCAGCTTGTGATGAGACACAGGAAGTTCCGAAAATCAAAAGAGGATACACTCTGAGAACTCGAGCAAGTGTAAAGAACAAATGTGATGATTCATGGGATGATGGAATAGACGAAGAAGATGTCTCAAAAAGATCAGAAGACACGTTAAATGATTCATTTGTTGATCCTGAATTCATGGATTCTGTTCTAGATAATCAATTAACGATCAAAGGCAAAAAGCAATTTCTCGATGATGGAGAGTTTTTCACAGACCGGAATGTTCCTCAGATTGATGAAGCTACAAAAATGAAGTGGGCATCAATGACGTCACCTCCTCAAGAAGCTTTGAACGCATTGAACGAATTCTTCGGTCATAAAGGATTCCGAGAAAAGCAGTGGGATGTTGTCAGAAATGTTTTGGGAGGAAAAGACCAATTTGTTCTTATGTCCACTGGTTATGGTAAAAGTGTATGTTATCAGCTACCATCACTTCTTCTCAATTCGATGACTGTCGTGGTATCTCCATTAATTTCATTGATGAATGATCAAGTAACTACATTGGTTTCTAAAGGTATTGATGCAGTGAAACTAGATGGACATTCTACACAAATTGAATGGGATCAAGTTGCGAATAATATGCACCGAATTAGGTTCATCTACATGTCACCTGAAATGGTTACGAGCCAAAAGGGTTTGGAATTATTAACTTCTTGCCGAAAACATATCTCCCTCCTCGCTATTGATGAAGCTCATTGTGTTTCTCAATGGGGACACGACTTTCGAAACTCGTACAGGCATCTCGCAGAAATTAGAAACCGATCTGATCTATGCAATATTCCAATGATTGCTCTTACCGCTACTGCCACAGTTAGAGTTCGTGATGACGTCATTGCTAATTTAAGACTCCGCAAGCCATTAATCACAACTACGTCGTTTGATAGAAAGAATCTCTACATTTCTGTGCATTCTTCAAAGGACATGGCTGAAGATTTAGGATTATTCATGAAAACCGATGAAGTTAAAGGAAGACACTTTGGTGGACCTACTATTATTTATTGCCAAACGAAACAAATGGTCGATGATGTGAACTGTGTTTTGAGAAGAATCGGAGTTCGTTCTGCTCATTATCACGCAGGACTCACTAAAAATCAACGAGAAAAAGCACACACCGATTTTATGAGAGATAAGATTACAACAATCGTTGCGACAGTTGCATTTGGTATGGGAATTGACAAACCCGACGTTCGAAATGTGATTCATTACGGATGCCCGAACAATATCGAATCATATTATCAAGAAATCGGAAGAGCTGGTCGAGATGGATCTCCAAGTATTTGTCGTGTATTCTGGGCTCCGAAAGATTTGAATACTATAAAATTTAAACTTCGAAATTCGCAGCAAAAAGAAGAAGTAGTTGAAAATCTTACAATGATGCTAAGACAACTCGAGTTGGTTCTGACAACCGTTGGATGTAGAAGATACCAACTTCTGAAGCACTTTGACCCATCATACGCGAAACCTCCAACTATGCAAGCTGATTGTTGTGATAGATGTACTGAAATGCTCAATGGAAATCAAGATTCATCATCCAGTATTGTTGATGTTACAACAGAATCGAAGTGGTTGTTTCAAGTTATTAACGAAATGTACAACGGGAAAACTGGTATCGGAAAACCAATCGAATTTCTGAGGGGATCGAGTAAAGAAGACTGGCGAATCAAGACCACATCTCAACAAAAATTGTTTGGAATTGGAAAACATATTCCTGATAAATGGTGGAAAGCACTTGCAGCATCACTTCGAATTGCTGGTTATCTTGGAGAAGTTAGGCTGATGCAAATGAAATTTGGAAGTTGTATCACTTTGTCCGAACTCGGGGAACGATGGCTTTTGACTGGAAAAGAGATGAAAATCGATGCGACACCGATTTTATTGCAAGGGAAGAAAGAAAAAGCCGCACCTTCAACTGTCCCCGGAGCTTCAAGATCTCAGTCAACTAAATCAAGTACAGAGATTCCAACCAAGATTCTCGGAGCGAATAAGATTCGTGAATACGAGCCTGCAAATGAAAACGAGCAGCTGATGAACTTGAAAAAGCAAGAAGTCACTGGTCTTCCAGAGAAGATTGATCAACTGCGCTCTCGTCTTGACGACATTCGTGTAGGAATTGCAAACATGCATGAAGTAGCACCATTCCAAATTGTATCGAATACTGTTCTTGATTGTTTTGCCAACTTGAGACCTACCTCAGCCTCGAATCTCGAAATGATTGATGGAATGTCGGCTCAGCAGAAATCTAGATACGGAAAACGATTTGTCGATTGTGTTGTACAATTTTCAAAGGAAACTGGCATTGCAACAAACGTCAATGCCAACGATATGATACCCCCTGAACTTATTTCAAAAATGCAGAAAGTTCTCTCGGATGCGGTGAGAAGAGTATACACAGAGCATCTTATTTCGAGATCCACTGCGAAAGAAGTGGCAACTGCTCGAGGAATTAGTGAGGGTACTGTATATTCATATCTCGCGATGGCGGTAGAAAAAGGATTACCTCTTCACTTAGACAAGTTAAATGTCTCCAGAAAGAATATTGCAATGGCTCTAAATGCAGTTAGAGTACATTTAGGATCAAATGTTGCCGTACTGACACCATGGGTTGAAGCTATGGGAGTCGTACCTGATTTTAATCAGTTGAAATTGATCCGGGCAATTCTTATTTACGAATATGGATTGGATACGAGTGAGAACCAAGAGAAGCCAGACATCCAATCTATGCCGTCCACTTCAAATCCATCCACCATCAAAACAGTTCCATCAACACCTTCATCCTCTCTCAGAGCTCCTCCATTGAAGAAATTCAAACTTTAAATTTCTTATATTTTTTTTAATCTGAATATCATAACTATACGGTCTCTTATTTTCAATCTCATCCCTGTCTATATGAATGCTGGTTATTCGATTTTCACTTATGAATTTTTAAAAACACTT
pIVEX2.3d Vector Sequence
TCGCGCGTTTCGGTGATGACGGTGAAAACCTCTGACACATGCAGCTCCCGGAGACGGTCACAGCTTGTCTGTAAGCGGATGCCGGGAGCAGACAAGCCCGTCAGGGCGCGTCAGCGGGTGTTGGCGGGTGTCGGGGCTGGCTTAACTATGCGGCATCAGAGCAGATTGTACTGAGAGTGCACCATATATGCGGTGTGAAATACCGCACAGATGCGTAAGGAGAAAATACCGCATCAGGCGCCATTCGCCATTCAGGCTGCGCAACTGTTGGGAAGGGCGATCGGTGCGGGCCTCTTCGCTATTACGCCAGCTGGCGAAAGGGGGATGTGCTGCAAGGCGATTAAGTTGGGTAACGCCAGGGTTTTCCCAGTCACGACGTTGTAAAACGACGGCCAGTGCCAAGCTTGCATGCAAGGAGATGGCGCCCAACAGTCCCCCGGCCACGGGGCCTGCCACCATACCCACGCCGAAACAAGCGCTCATGAGCCCGAAGTGGCGAGCCCGATCTTCCCCATCGGTGATGTCGGCGATATAGGCGCCAGCAACCGCACCTGTGGCGCCGGTGATGCCGGCCACGATGCGTCCGGCGTAGAGGATCGAGATCTCGATCCCGCGAAATTAATACGACTCACTATAGGGAGACCACAACGGTTTCCCTCTAGAAATAATTTTGTTTAACTTTAAGAAGGAGATATACCATGGCACATATGAGCGGCCGCGTCGACTCGAGCGAGCTCCCGGGGGGGGTTCTCATCATCATCATCATCATTAATAAAAGGGCGAATTCCAGCACACTGGCGGCCGTTACTAGTGGATCCGGCTGCTAACAAAGCCCGAAAGGAAGCTGAGTTGGCTGCTGCCACCGCTGAGCAATAACTAGCATAACCCCTTGGGGCCTCTAAACGGGTCTTGAGGGGTTTTTTGCTGAAAGGAGGAACTATATCCGGATATCCACAGGACGGGTGTGGTCGCCATGATCGCGTAGTCGATAGTGGCTCCAAGTAGCGAAGCGAGCAGGACTGGGCGGCGGCCAAAGCGGTCGGACAGTGCTCCGAGAACGGGTGCGCATAGAAATTGCATCAACGCATATAGCGCTAGCAGCACGCCATAGTGACTGGCGATGCTGTCGGAATGGACGATATCCCGCAAGAGGCCCGGCAGTACCGGCATAACCAAGCCTATGCCTACAGCATCCAGGGTGACGGTGCCGAGGATGACGATGAGCGCATTGTTAGATTTCATACACGGTGCCTGACTGCGTTAGCAATTTAACTGTGATAAACTACCGCATTAAAGCTTATCGATGATAAGCTGTCAAACATGAGAATTCGTAATCATGTCATAGCTGTTTCCTGTGTGAAATTGTTATCCGCTCACAATTCCACACAACATACGAGCCGGAAGCATAAAGTGTAAAGCCTGGGGTGCCTAATGAGTGAGCTAACTCACATTAATTGCGTTGCGCTCACTGCCCGCTTTCCAGTCGGGAAACCTGTCGTGCCAGCTGCATTAATGAATCGGCCAACGCGCGGGGAGAGGCGGTTTGCGTATTGGGCGCTCTTCCGCTTCCTCGCTCACTGACTCGCTGCGCTCGGTCGTTCGGCTGCGGCGAGCGGTATCAGCTCACTCAAAGGCGGTAATACGGTTATCCACAGAATCAGGGGATAACGCAGGAAAGAACATGTGAGCAAAAGGCCAGCAAAAGGCCAGGAACCGTAAAAAGGCCGCGTTGCTGGCGTTTTTCCATAGGCTCCGCCCCCCTGACGAGCATCACAAAAATCGACGCTCAAGTCAGAGGTGGCGAAACCCGACAGGACTATAAAGATACCAGGCGTTTCCCCCTGGAAGCTCCCTCGTGCGCTCTCCTGTTCCGACCCTGCCGCTTACCGGATACCTGTCCGCCTTTCTCCCTTCGGGAAGCGTGGCGCTTTCTCATAGCTCACGCTGTAGGTATCTCAGTTCGGTGTAGGTCGTTCGCTCCAAGCTGGGCTGTGTGCACGAACCCCCCGTTCAGCCCGACCGCTGCGCCTTATCCGGTAACTATCGTCTTGAGTCCAACCCGGTAAGACACGACTTATCGCCACTGGCAGCAGCCACTGGTAACAGGATTAGCAGAGCGAGGTATGTAGGCGGTGCTACAGAGTTCTTGAAGTGGTGGCCTAACTACGGCTACACTAGAAGGACAGTATTTGGTATCTGCGCTCTGCTGAAGCCAGTTACCTTCGGAAAAAGAGTTGGTAGCTCTTGATCCGGCAAACAAACCACCGCTGGTAGCGGTGGTTTTTTTGTTTGCAAGCAGCAGATTACGCGCAGAAAAAAAGGATCTCAAGAAGATCCTTTGATCTTTTCTACGGGGTCTGACGCTCAGTGGAACGAAAACTCACGTTAAGGGATTTTGGTCATGAGATTATCAAAAAGGATCTTCACCTAGATCCTTTTAAATTAAAAATGAAGTTTTAAATCAATCTAAAGTATATATGAGTAAACTTGGTCTGACAGTTACCAATGCTTAATCAGTGAGGCACCTATCTCAGCGATCTGTCTATTTCGTTCATCCATAGTTGCCTGACTCCCCGTCGTGTAGATAACTACGATACGGGAGGGCTTACCATCTGGCCCCAGTGCTGCAATGATACCGCGAGACCCACGCTCACCGGCTCCAGATTTATCAGCAATAAACCAGCCAGCCGGAAGGGCCGAGCGCAGAAGTGGTCCTGCAACTTTATCCGCCTCCATCCAGTCTATTAATTGTTGCCGGGAAGCTAGAGTAAGTAGTTCGCCAGTTAATAGTTTGCGCAACGTTGTTGCCATTGCTACAGGCATCGTGGTGTCACGCTCGTCGTTTGGTATGGCTTCATTCAGCTCCGGTTCCCAACGATCAAGGCGAGTTACATGATCCCCCATGTTGTGCAAAAAAGCGGTTAGCTCCTTCGGTCCTCCGATCGTTGTCAGAAGTAAGTTGGCCGCAGTGTTATCACTCATGGTTATGGCAGCACTGCATAATTCTCTTACTGTCATGCCATCCGTAAGATGCTTTTCTGTGACTGGTGAGTACTCAACCAAGTCATTCTGAGAATAGTGTATGCGGCGACCGAGTTGCTCTTGCCCGGCGTCAATACGGGATAATACCGCGCCACATAGCAGAACTTTAAAAGTGCTCATCATTGGAAAACGTTCTTCGGGGCGAAAACTCTCAAGGATCTTACCGCTGTTGAGATCCAGTTCGATGTAACCCACTCGTGCACCCAACTGATCTTCAGCATCTTTTACTTTCACCAGCGTTTCTGGGTGAGCAAAAACAGGAAGGCAAAATGCCGCAAAAAAGGGAATAAGGGCGACACGGAAATGTTGAATACTCATACTCTTCCTTTTTCAATATTATTGAAGCATTTATCAGGGTTATTGTCTCATGAGCGGATACATATTTGAATGTATTTAGAAAAATAAACAAATAGGGGTTCCGCGCACATTTCCCCGAAAAGTGCCACCTGACGTCTAAGAAACCATTATTATCATGACATTAACCTATAAAAATAGGCGTATCACGAGGCCCTTTCGTC- Use the information in the attached DNA file (mystery gene) to identify the encoded protein and the species.
- Caenorhabditis elegans Probable Werner syndrome ATP-dependent helicase homolog 1 (wrn-1) (UniProt accession code: Q19546)
- Draw a schematic diagram of the protein, noting the number of amino acids, predicted Mw and pI of the encoded protein, and annotate on functional domains (e.g. in ppt).
- 1056 amino acids; MW = 118522.73 Da (average mass)/118447.63 Da (monoisotopic mass); pI = 6.08 (predicted using ExPASy ‘Compute pI/Mw tool’)
- Automated homology modelling in the SWISS-MODEL Repository uses 1oyy.1.A, 4cdg.1.A and 4cgz.1.A as templates to obtain models with global QMEANs of -3.35, -3.57 and -4.19, respectively
- Manual (interactive) modelling using 4q47.1.A (DrRecQ catalytic core (Dr = Deinococcus radiodurans)) achieved a better QMEAN of -3.09. The structure is shown in Fig. 1 (highlighting functional domains) and in Fig. 2 (showing local quality (QMEAN) scores). The annotations on functional domains are based on Chen et al. (2014).
- Update on 2 Feb: yet a higher QEMAN of -2.90 is achieved with 2wwy.1. 2wwy.1 is the structure of human RECQ-like helicase in complex with DNA substrate(Pike et al. 2015). The homology model based on this is shown in Fig. 3, and the PyMOL Session (
.pse) file can be downloaded here. - As shown in Fig. 4, WRN is unique in the family of RecQ helicases in possessing an 3’-to-5’ exonuclease domain(Cox and Mason 2013). In C. elegans, the exonuclease and the helicase are encoded in separate genes. The two experimental structures used for modelling (4q47.1.A (DrRecQ) and 2wwy.1 (human RECQ1)) and the query C. elegans wrn homolog all represent only the helicase domain and the RQC (WH) domain.
![A homology model of *C. elegans* wrn-1 based on DrRecQ catalytic core (PDB accession code: 4Q47). The N-terminal part contains the common core structure of the RecQ helicase family, which comprises two RecA-like domains, D1 and D2, each composed of a central β-sheet surrounded by α-helices. The conserved sequence motifs at the interface of D1 and D2 are responsible for ATP binding and hydrolysis. The following Zn-binding domain stabilizes the protein structure. The C-terminus consists of a WH domain (a.k.a RQC domain), which directly participates in DNA binding and base pair separation. [@Chen-2014]](../img/wrn-model.png)
Figure 1: A homology model of C. elegans wrn-1 based on DrRecQ catalytic core (PDB accession code: 4Q47). The N-terminal part contains the common core structure of the RecQ helicase family, which comprises two RecA-like domains, D1 and D2, each composed of a central β-sheet surrounded by α-helices. The conserved sequence motifs at the interface of D1 and D2 are responsible for ATP binding and hydrolysis. The following Zn-binding domain stabilizes the protein structure. The C-terminus consists of a WH domain (a.k.a RQC domain), which directly participates in DNA binding and base pair separation. (Chen et al. 2014)
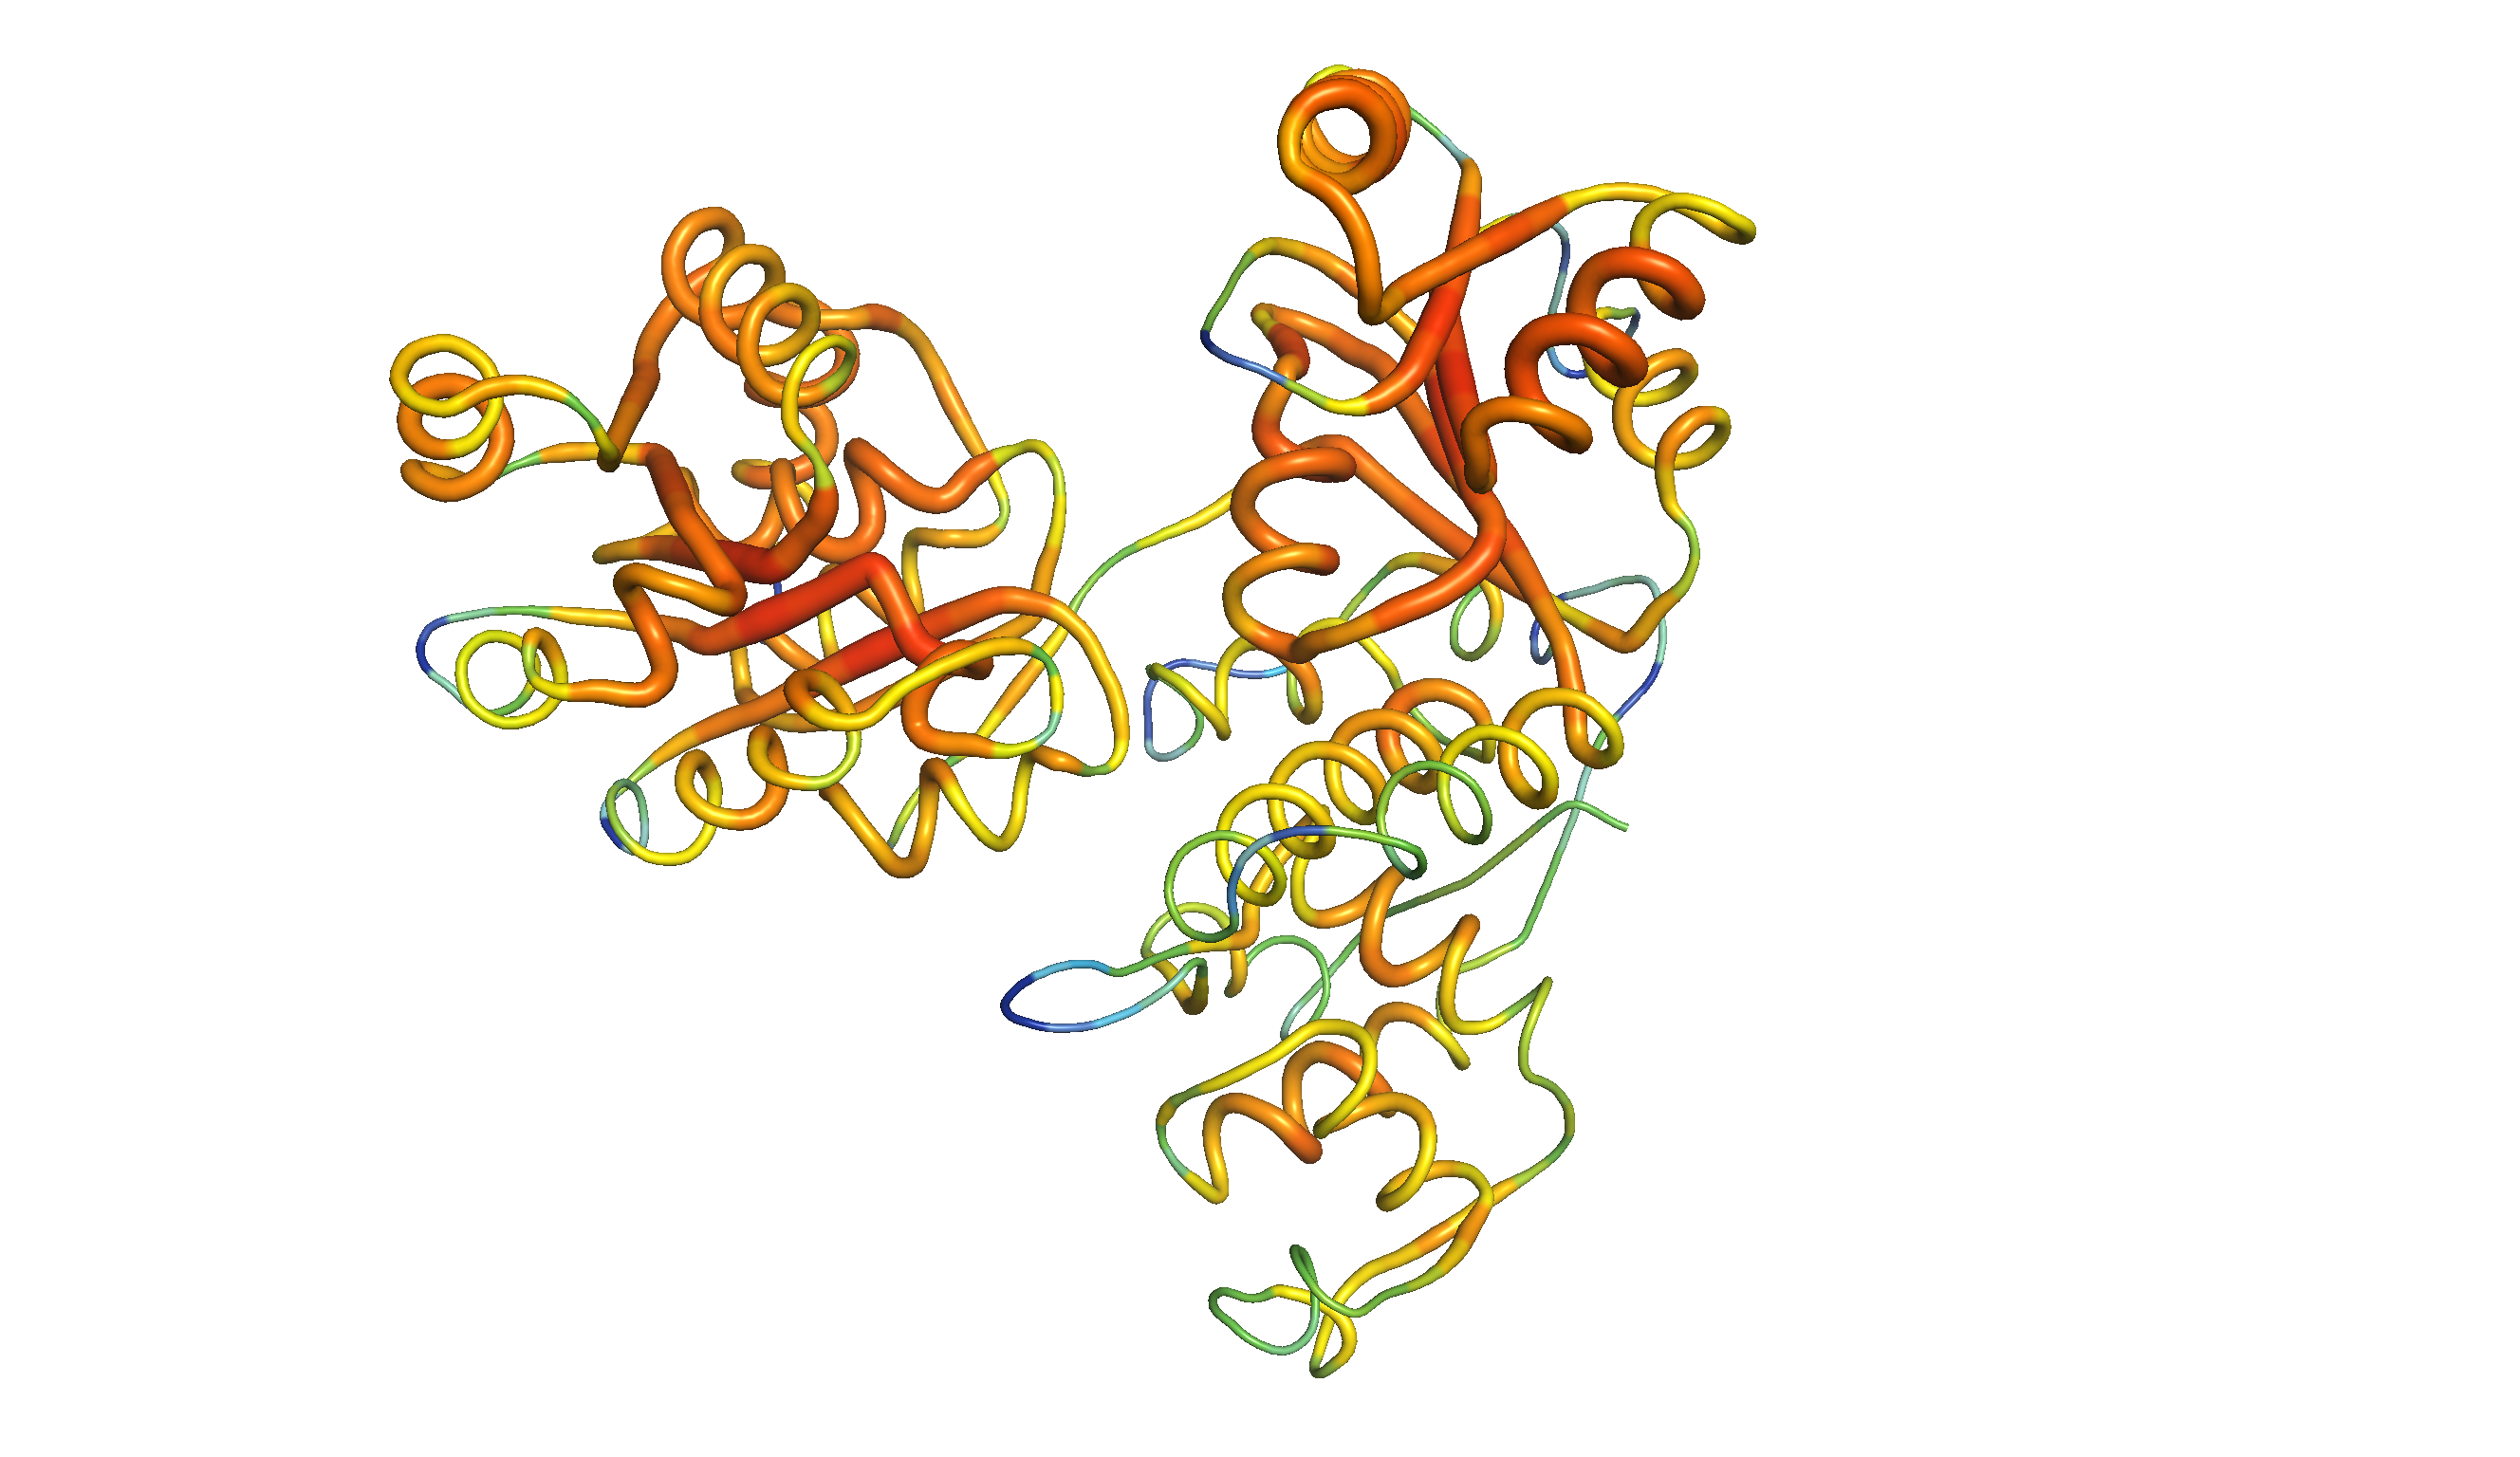
Figure 2: The same homology model, showing local QMEAN scores (b-factor). Compared to green and thin regions, red and thick regions have local geometrical properties deviating further from those of experimentally determined structures. The Zn-binding domain and WH domain are more consistent with experimental structures than the two RecA-like domains.
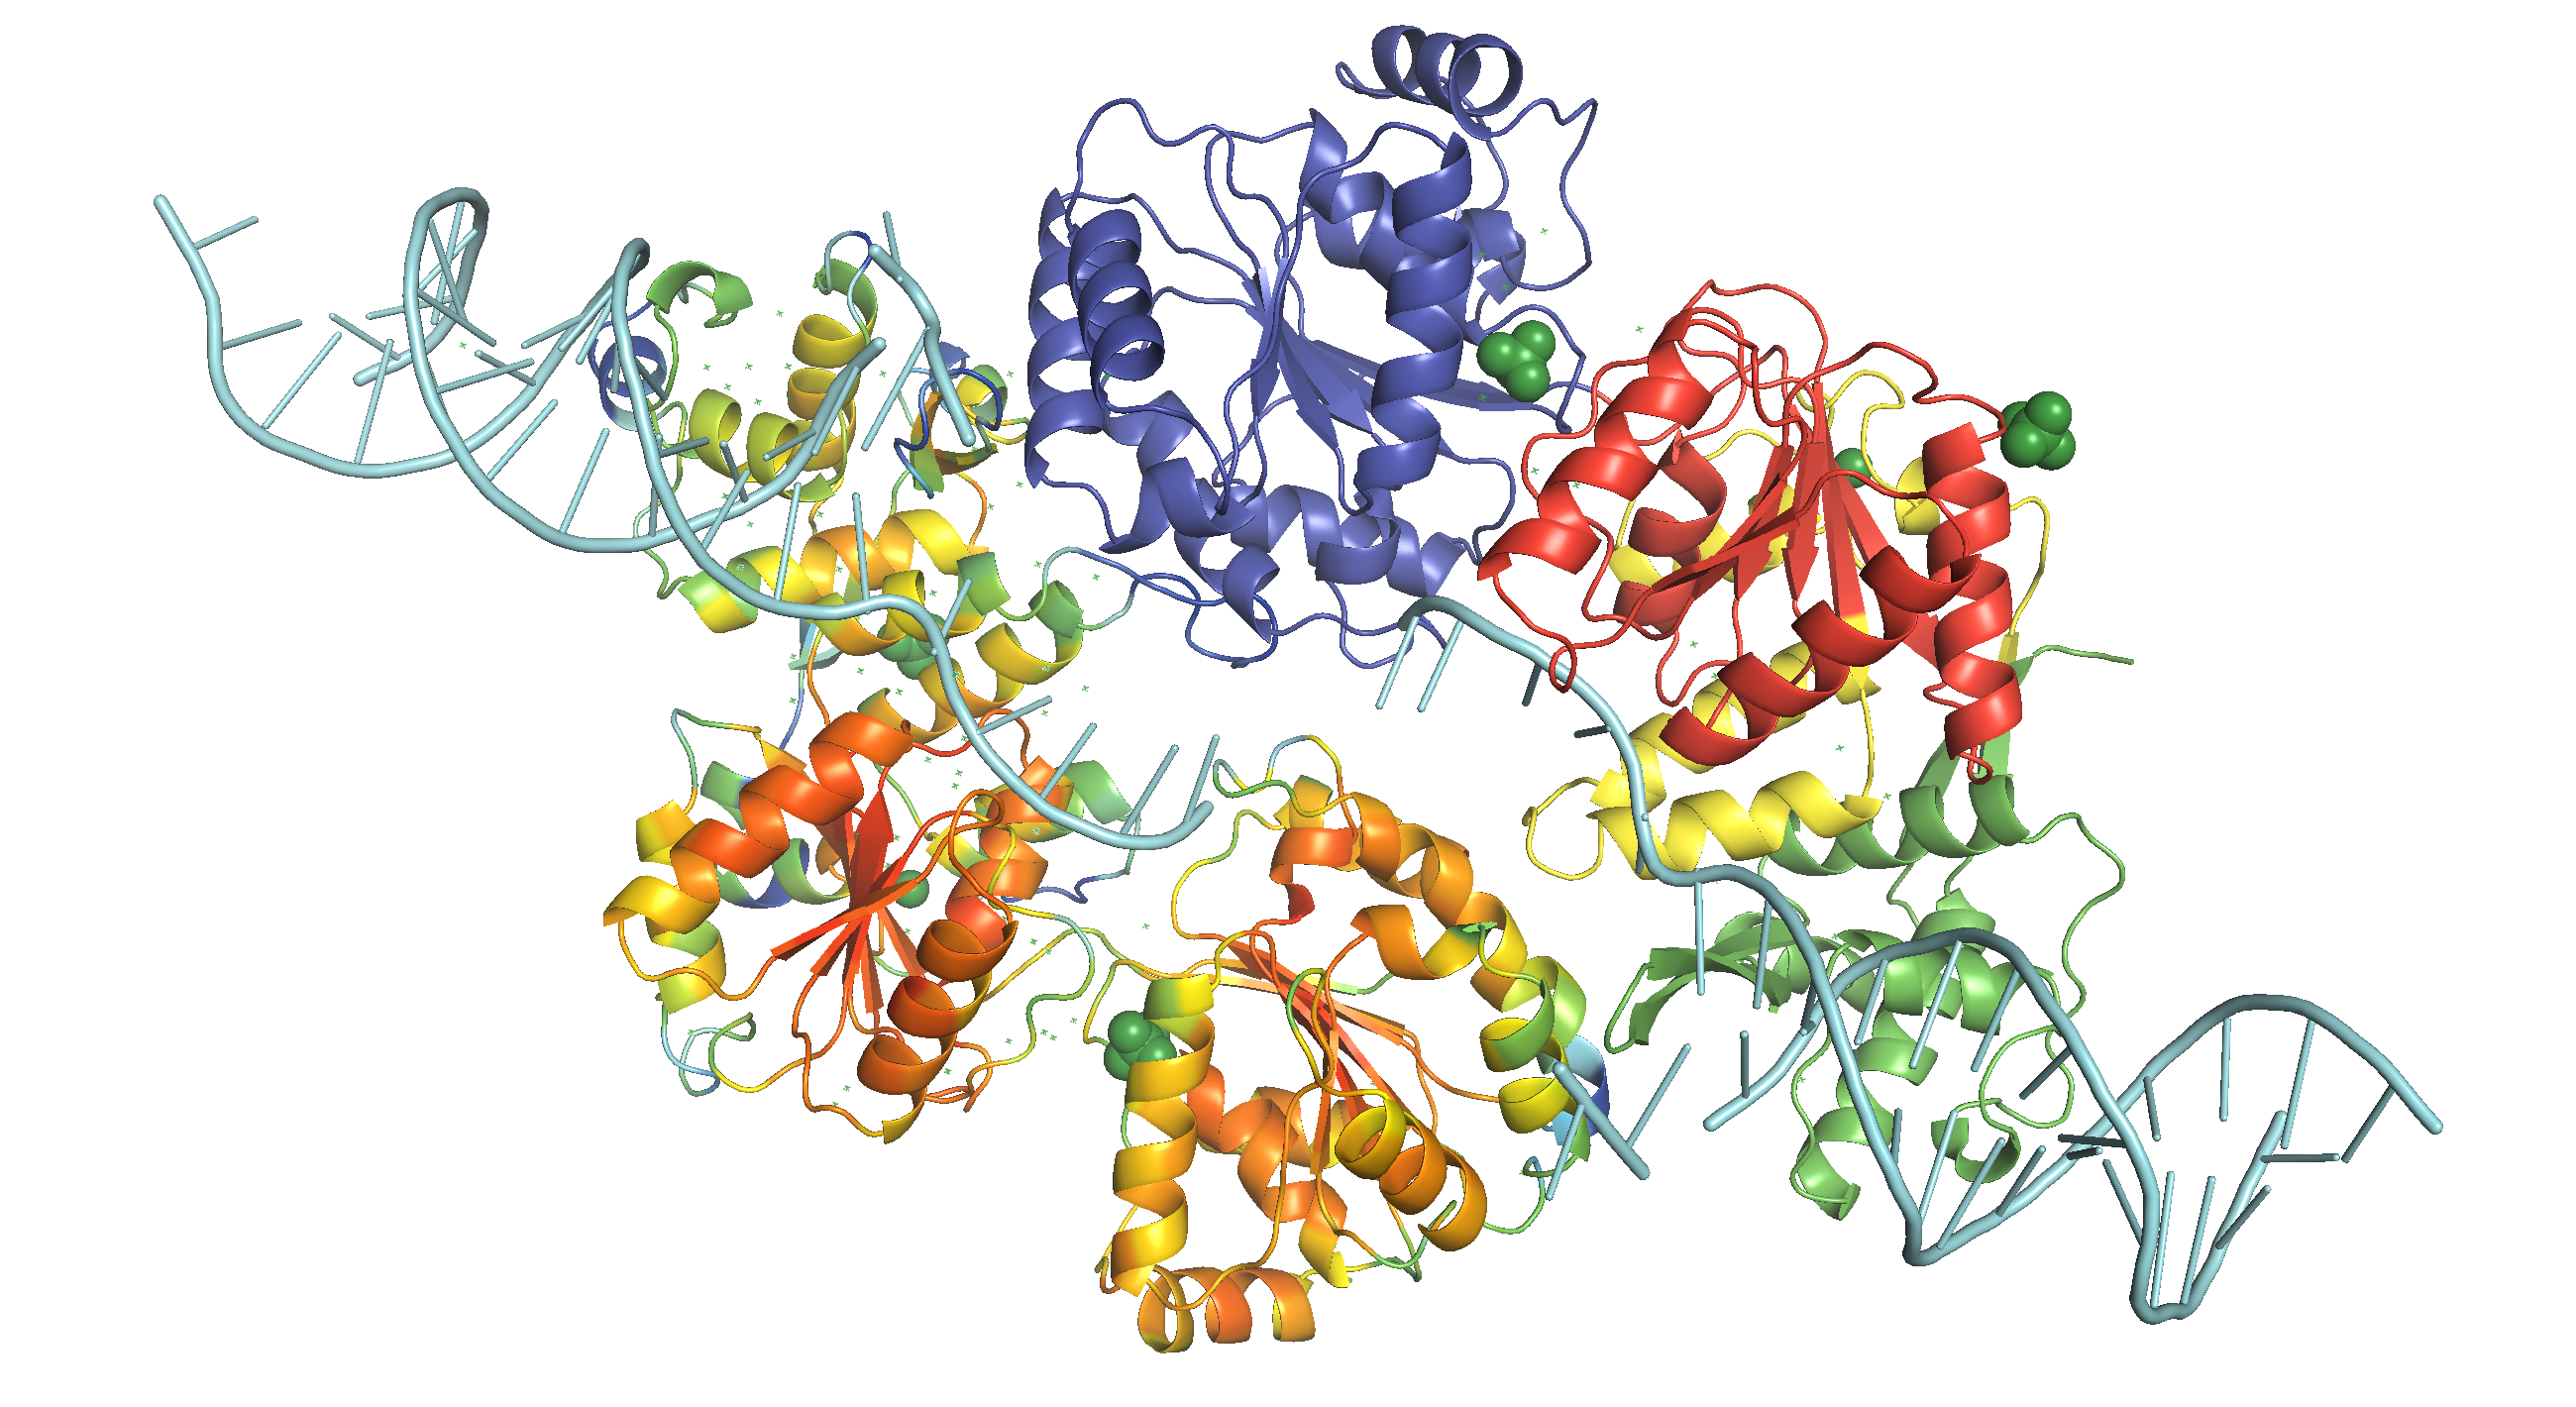
Figure 3: WRN catalytic core (RECQ) in action. This structure is based on the structure of a dimer of human RECQ1 helicase in complex with tailed duplux DNA solved by Pike et al. (2015). The monomer on the bottom shows the b-factor (local QMEAN) of the homology model with C. elegans wrn-1, where red indicates high and green indicates low scores. The monomer on the top shows the subunits of WRN catalytic core (RECQ), where D1, D2, Zn-binding, and WH (RQC) domains are coloured blue, red, yellow and green, respectively, similar to Fig. 1. DNA is coloured cyan. Ligands (2 zinc ions, 3 sulfate ions and 2 ethanediol molecules) are not removed.
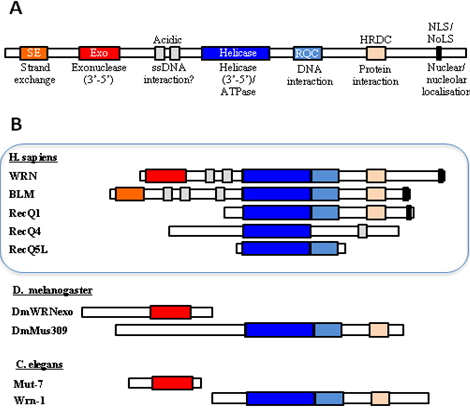
Figure 4: Domain organisation of human WRN and its homologs in D. melanogaster and C. elegans. Adapted from Cox and Mason (2013).
- Find homologues in human, Xenopus and mice and give the protein names (Uniprot should help)
- Use UniProt BLAST
- Query: Q19546 (UniProt ID)
- Relevant Results:
- Show homology between your mystery protein and the human, mouse and frog homologues.
- Sequences aligned using UniProt alignment tool (accessible via the BLAST result page)
- results displayed using SnapGene Viewer (view PDF)
- UniProt uses the ‘clustalo’ program (MSA algorithm) to align
- I also used the ‘muscle’ program (MUltiple Sequence Comparison by Log-Expectation) in the command line to produce a different result, and standardised its output using BioPython for visualisation in SnapGene (view PDF)
$ cat ce.fasta hs.fasta mm.fasta xl.fasta | muscle -out muscle.fastafrom Bio import AlignIO muscle = AlignIO.read('resources/wrn/muscle.fasta', 'fasta') AlignIO.write(muscle, 'muscle.aln', 'clustal')With help of the
seqinR package, the pairwise genetic differences between these 4 protein sequences can be calculated:aln <- seqinr::read.alignment('./resources/wrn/clustal.aln', 'clustal') alnDist <- seqinr::dist.alignment(aln) alnDist## SP|Q19546|WRN_CAEEL SP|Q14191|WRN_HUMAN SP|O09053|WRN_MOUSE ## SP|Q14191|WRN_HUMAN 0.5710006 ## SP|O09053|WRN_MOUSE 0.5782777 0.3408993 ## SP|O93530|WRN_XENLA 0.5903942 0.4396192 0.4499939These can be visulised by a phylogenetic tree produced by the
apepackage, as shown in Fig. 5.mydist <- seqinr::dist.alignment(aln) mytree <- ape::nj(mydist) myrootedtree <- root(mytree, 'SP|Q19546|WRN_CAEEL', resolve.root=TRUE) ape::plot.phylo(myrootedtree, type="p")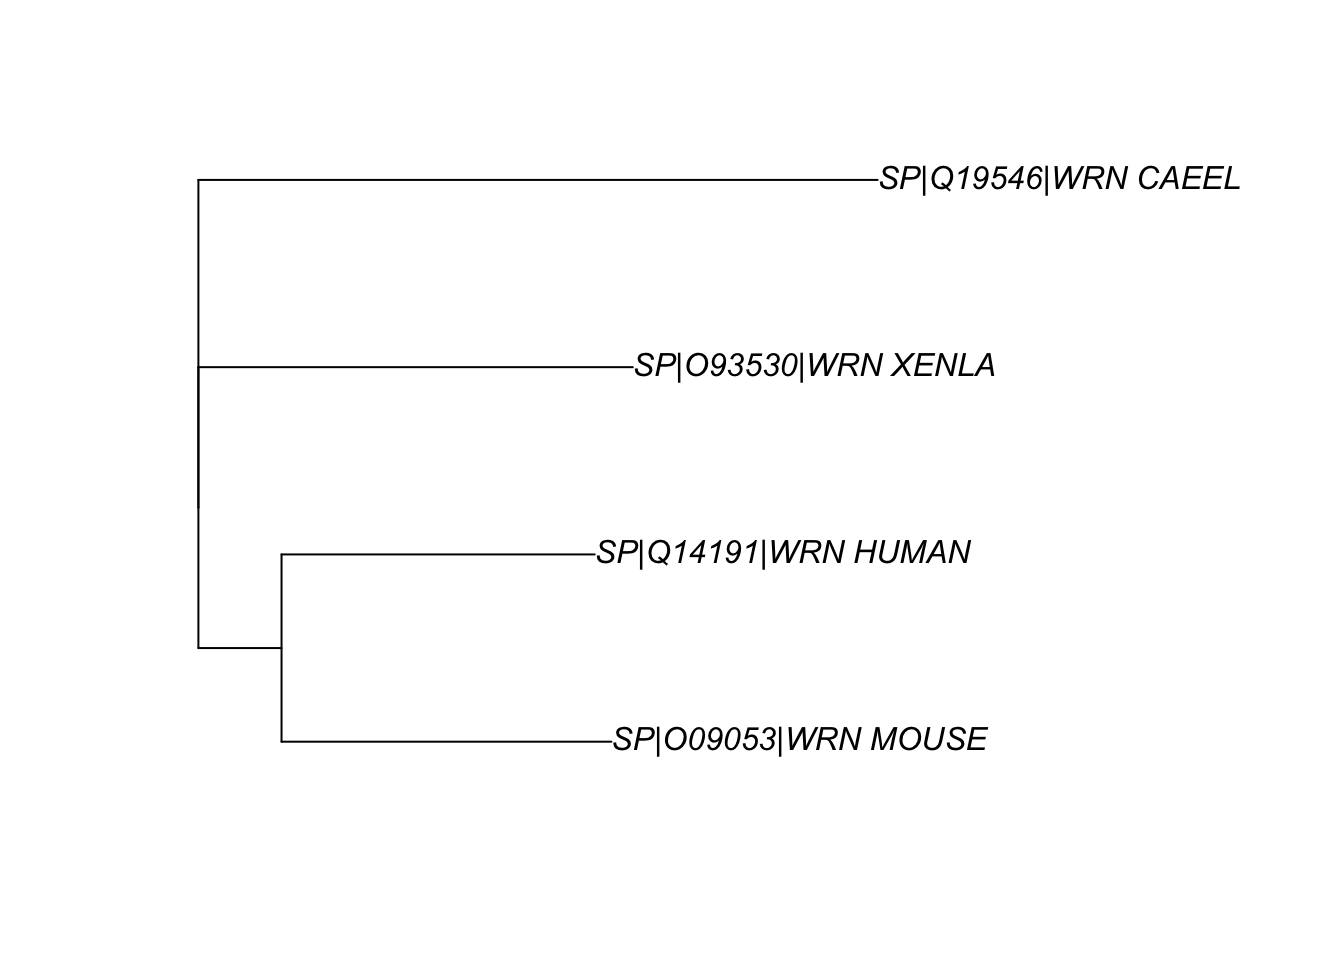
Figure 5: The phylogenetic relationship between the WRN homologs in 4 organisms
- Design PCR primers to amplify the coding region, incorporating suitable restriction enzyme sites in each primer so that you can clone easily into the vector pIVEX2.3d (though there are many online primer design sites, I find this is best done manually to get a feel for it, but these days I use SnapGene (viewer version is free….). Hint: we want to keep the start codon ATG so chose an enzyme that contains ATG in its recognition site for the forward primer.
- I opened the original sequence with SnapGene. In the ‘Sequence’ view, I displayed translated amino acids with ‘Frame +1 only’ and thus located the stop codon (the start codon is obviously +1)1. Then I used the ‘Enzymes’ view to obtain a list of noncutters. By comparing this list with the MCS of the piVEX2.3d, I selected NdeI and SalI as the RE sites to be used2. The SalI site is not in frame with the C-terminal His tag and stop codon, so I included an additional random nucleotide 3’ to the RE site. The stop codon is excluded from the reverse primer because it is provided in the vector.
- forward:
NN CAT ATGATAAGTGATGATGACGATCTACCCATATGis NdeI restriction site. It ends withATG, so addingCATinstead ofCATATGto the 5’ suffices.- 31-mer; 39% GC (>40% if
NN=GC); 26 annealed bases; Tm = 56ºC3
- reverse:
NN GTCGAC N AAGTTTGAATTTCTTCAATGGAGGAGCGTCGACis SalI restriction site- 36-mer; 43% GC; 28 annealed bases; Tm = 58ºC
- In silico PCR is done in SnapGene, and the resulting DNA can be downloaded here
- In silico clone this into the vector pIVEX2.3d (file attached - .dna is a snap gene format, docx is of course in word). Why might we want to use this vector?
- This vector has a C-terminal 6-His tag which allows efficient purification by affinity chromatography
- The MCS is associated with the T7 promoter. T7 RNAP is highly processive, so consecutive expression is expected.
- Check that your new construct allows correct protein expression in frame with the hexahistidine tag of the vector (SnapGene is good for this, but you can also do it in a few more steps using ApE plus translation apps via Expasy)
- Yes. (view result as PDF or .dna file)
- Serendipitously, the MCS has an ATG in frame with our insert and the His-tag/STOP codon, so translation will probably start more upstream than we expected, which will add 3 additional amino acid residues to the N-terminus of the product. This ATG was not in frame with the His-tag before insertion, and thus unspotted by SnapGene or me.4
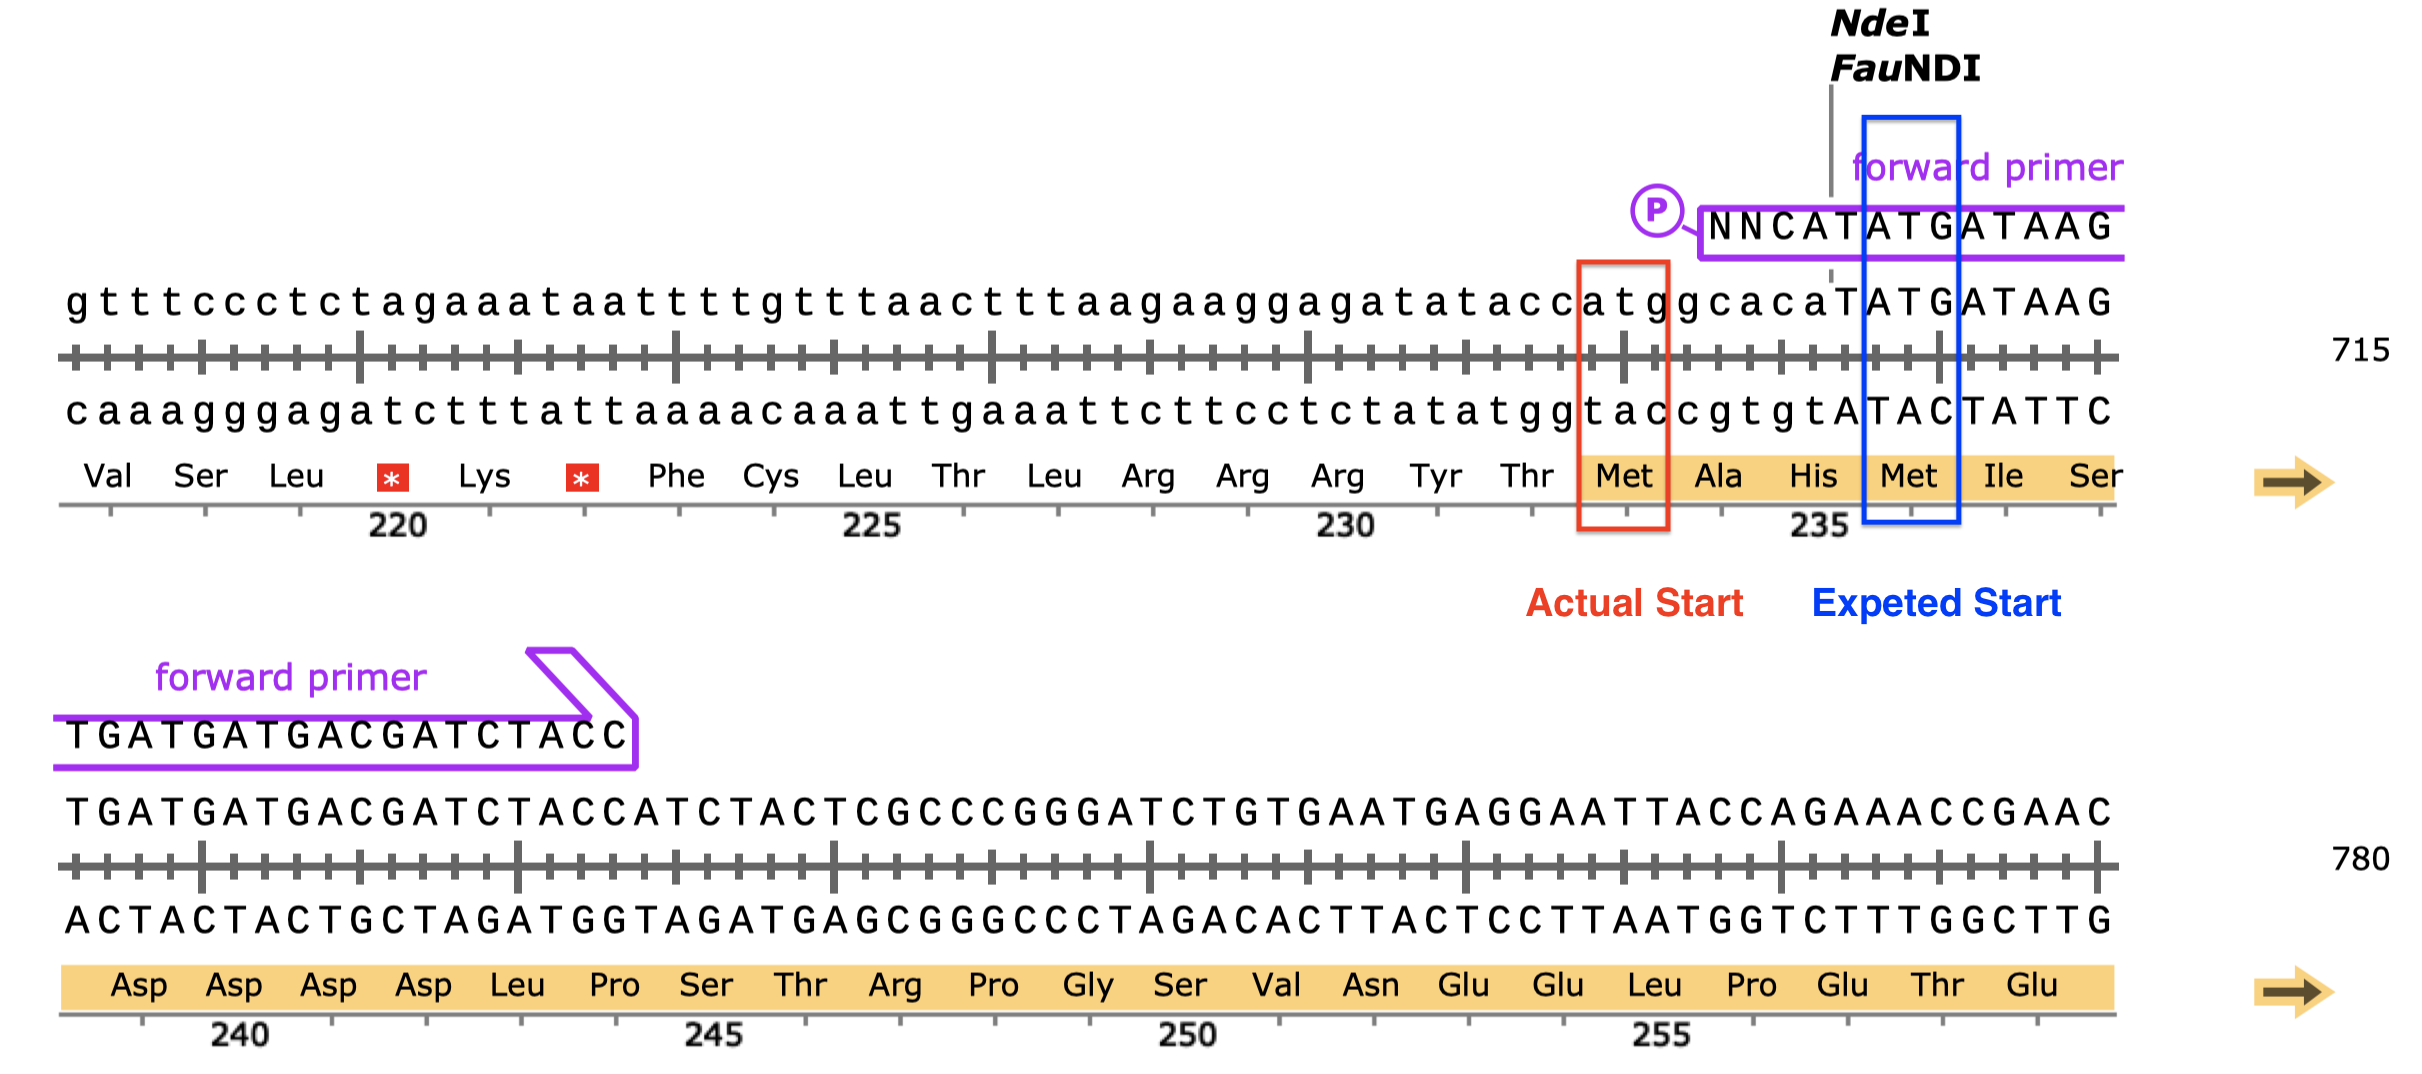
Figure 6: An additional in-frame start codon (red) upstream to the start codon of the insert (blue).
- Predict the protein fold of the new protein (eg Swissprot). Show the effect of predicted enzyme active site mutations on the structure (eg new file in swissport, but Pymol is good for this).
- Swiss-Model shown in Q2.
Bonus: Tianyi’s Restriction Site Finder
This tool takes in two sequences (plain text or FASTA or SnapGene .dna file), one representing the cloning site and the other representing the GOI, and finds the restriction sites inside the cloning site but not in the GOI, and label them with their positions in the cloning site and their commecial suppliers.
The web interface is built upon the Django framework and the data come from the Restriction module of BioPython, which is (sort of) a wrapper around NEB’s REBASE.

Figure 7: Restriction site finder by Tianyi. Query page.

Figure 8: Restriction site finder by Tianyi. Result page.
References
Chen, Sheng-Chia, Chi-Hung Huang, Chia Shin Yang, Tzong-Der Way, Ming-Chung Chang, and Yeh Chen. 2014. “Crystal Structure of Deinococcus Radiodurans Recq Helicase Catalytic Core Domain: The Interdomain Flexibility.” BioMed Research International 2014. Hindawi.
Cox, Lynne S., and Penelope A. Mason. 2013. “The Role of Wrn Helicase/Exonuclease in Dna Replication.” In The Mechanisms of Dna Replication, edited by David Stuart. Rijeka: IntechOpen. https://doi.org/10.5772/51520.
Pike, Ashley C. W., Shivasankari Gomathinayagam, Paolo Swuec, Matteo Berti, Ying Zhang, Christina Schnecke, Francesca Marino, et al. 2015. “Human Recq1 Helicase-Driven Dna Unwinding, Annealing, and Branch Migration: Insights from Dna Complex Structures.” Proceedings of the National Academy of Sciences 112 (14). National Academy of Sciences: 4286–91. https://doi.org/10.1073/pnas.1417594112.
Why does this sequence start with ATG but not end with a stop codon? Are the additional downstream nucleotides for the convinience of primer design (is it worthwhile to include additional upstream nucleotides)?↩
Is there a more automatic way of choosing RE sites? I wish I could select the MCS sequence of the vector and the GOI sequence, and then the intersection between the cutting sites of the former and the noncutting sites of the latter is computed automatically. Is this functionality hidden somewhere in SnapGene, or is it available elsewhere? If not I’ll try to make it! (A prototype is shown in Fig. 7 and 8)↩
When calculating %GC and Tm, do we need to include the 5’ additional bases used for RE cutting/frame adjustment? In SnapGene it seems that these additional bases are included in the calculation of %GC but not Tm. In practice, isn’t the annealing region the complete length of the primers for most DNA strands after a few rounds of synthesis? Do we need to increase the annealing temperature then?↩
It would be nice if it can highlight all ATGs regardless of the frame. I think additional in-frame ATGs can cause inclusion of unwanted aa residues and addtional out-of-frame ATGs can ruin the expression of GOI, especially in eukaryotes, because their ribosomes start translation at the first encountered ATG. It this correct?↩
What are the key similarities and differences between vectors used in bacterial and eukaryotic host cells? What can such vectors be used for?
There are various ways by which genes can be introduced into a host organism and expressed. The choice of source genetic material, vector, and the method of transformation/transfection for a particular experiment are largely dependent on the physiology of the host organism, the size of the transgene, and the purpose of the study. However, it is useful to catagorise these strategies into bacteria-compatible ones and eukaryote-compatible ones.
Most molecular cloning experiments begin with the production of a recombinant plasmid containing the gene of interest (GOI). For bacterial hosts, the recombinant plasmid is directly introduced into the cells. Bacteria naturally possess the machinary for replicating plasmids, which allows inheritance of the GOI in their progenies. Eukaryotic cells cannot reliably replicate plasmids, therefore introducing plasmids into eukaryotic cells normally results in transient transfection, which means the GOI is expressed in successfully tranfected cells but not in their progenies. In order to produce a stable cell line, the GOI must be integrated into the genome of the host cell (by homologous recombination), which is an extremely rare event in nature but can be induced artificially, for example by viral/bacterial infection or by designer nucleases such as TALEN, ZFN and CRISPR-Cas9. In order to be compatible with the different transformation/tranfection strategies and the physiology of the host cells, the molecular structure of the plasmids (or vectors of other kinds) vary.
1 The structure of the vectors
1.1 Simple plasmids
Plasmids are extrachromosomal self-replicating cytoplasmic (usually circular) DNA elements found in prokaryotes and, less commonly, in eukaryotes. They come in various forms, from simple plasmids used for direct transformation and fosmids for phage transduction. Plasmids optimised for expressing recombinant proteins share several features, as illustrated in Fig. 1.1 and 1.2:
- An origin of replication (ori), which allows it to be duplicated in bacterial cells. The type of origin of replication affects the copy number. Eukaryotic vectors generally carry two oris, one bacterial (e.g. pUC ori) and one viral (e.g. SV40 ori). The bacterial ori is for amplifying the plasmid in bacteria before transfection, and the viral ori allows for episomal amplification of plasmids in the eukaryotic host.
- A cloning site where the GOI is inserted. Typically it is crowded with restriction enzyme cutting sites (compatible with RE/ligase dependent cloning), but it can also be made compatible with other cloning methods, such as the LIC-compatible pBLIC-puro1 plasmid developed by Patel et al. (2012).
- A promoter and associated operator/enhancer. The promoter sequences for bacteria and eukaryotes are different (-35/-10 consensus sequence v.s. TATA box) For a bacterial vector, the promoter is usually controlled by an inducible operator so that protein expression is induced manually only when the optimal bacterial density is reached (e.g. lac operator induced by IPTG). In contrast, for a eukaryotic vector, the promoter is usually made as processive as possible, because the natural rate of transcription is generally low, and cell growth and division are not important (they do not serve to amplify the plasmid but to express the protein). For example, the pEF-BOS vector developed by Mizushima and Nagata (1990) contains the promoter of EF-1\(\alpha\) (EF-1\(\alpha\) is one of the most abundant proteins in eukaryotic cells, so its promoter is highly processive). Recently, promoters of viral origin (e.g. CMV, SV40) are gaining popularity.
- A transcription terminator/polyA signal. The mechanisms of transcription termination in bacteria and eukaryotes differ. In bacteria, the terminator sequence consists of a symmetric DNA sequence, and its transcribed product folds into a hairpin structure, releasing RNA polymerase (RNAP) from DNA. In eukaryotes, CstF and CPSF bound on RNAP C-terminal domain recognise 3’-end processing (polyadenylation) sequence (AAUAAA and GU-rich sequence) and induce cleavage and polyadenylation.
- A selectable marker. Usually an antibiotic resistance gene (bacteria and eukaryotes are sensitive to different antibiotics). Fluorophore genes are also common in eukaryotic vectors.
- Some plasmids possess a start codon and associated Shine-Dalgarno sequence (for bacteria) or Kozak sequence (for eukaryotes).
- Some plasmids have tag sequences near the start or end of the ORF for easy purification of the recombinant protein by affinity chromatography (e.g. hex-His, GST, HSV) and associated cleavage sequence (e.g. TEV) for easy removal of the tag.
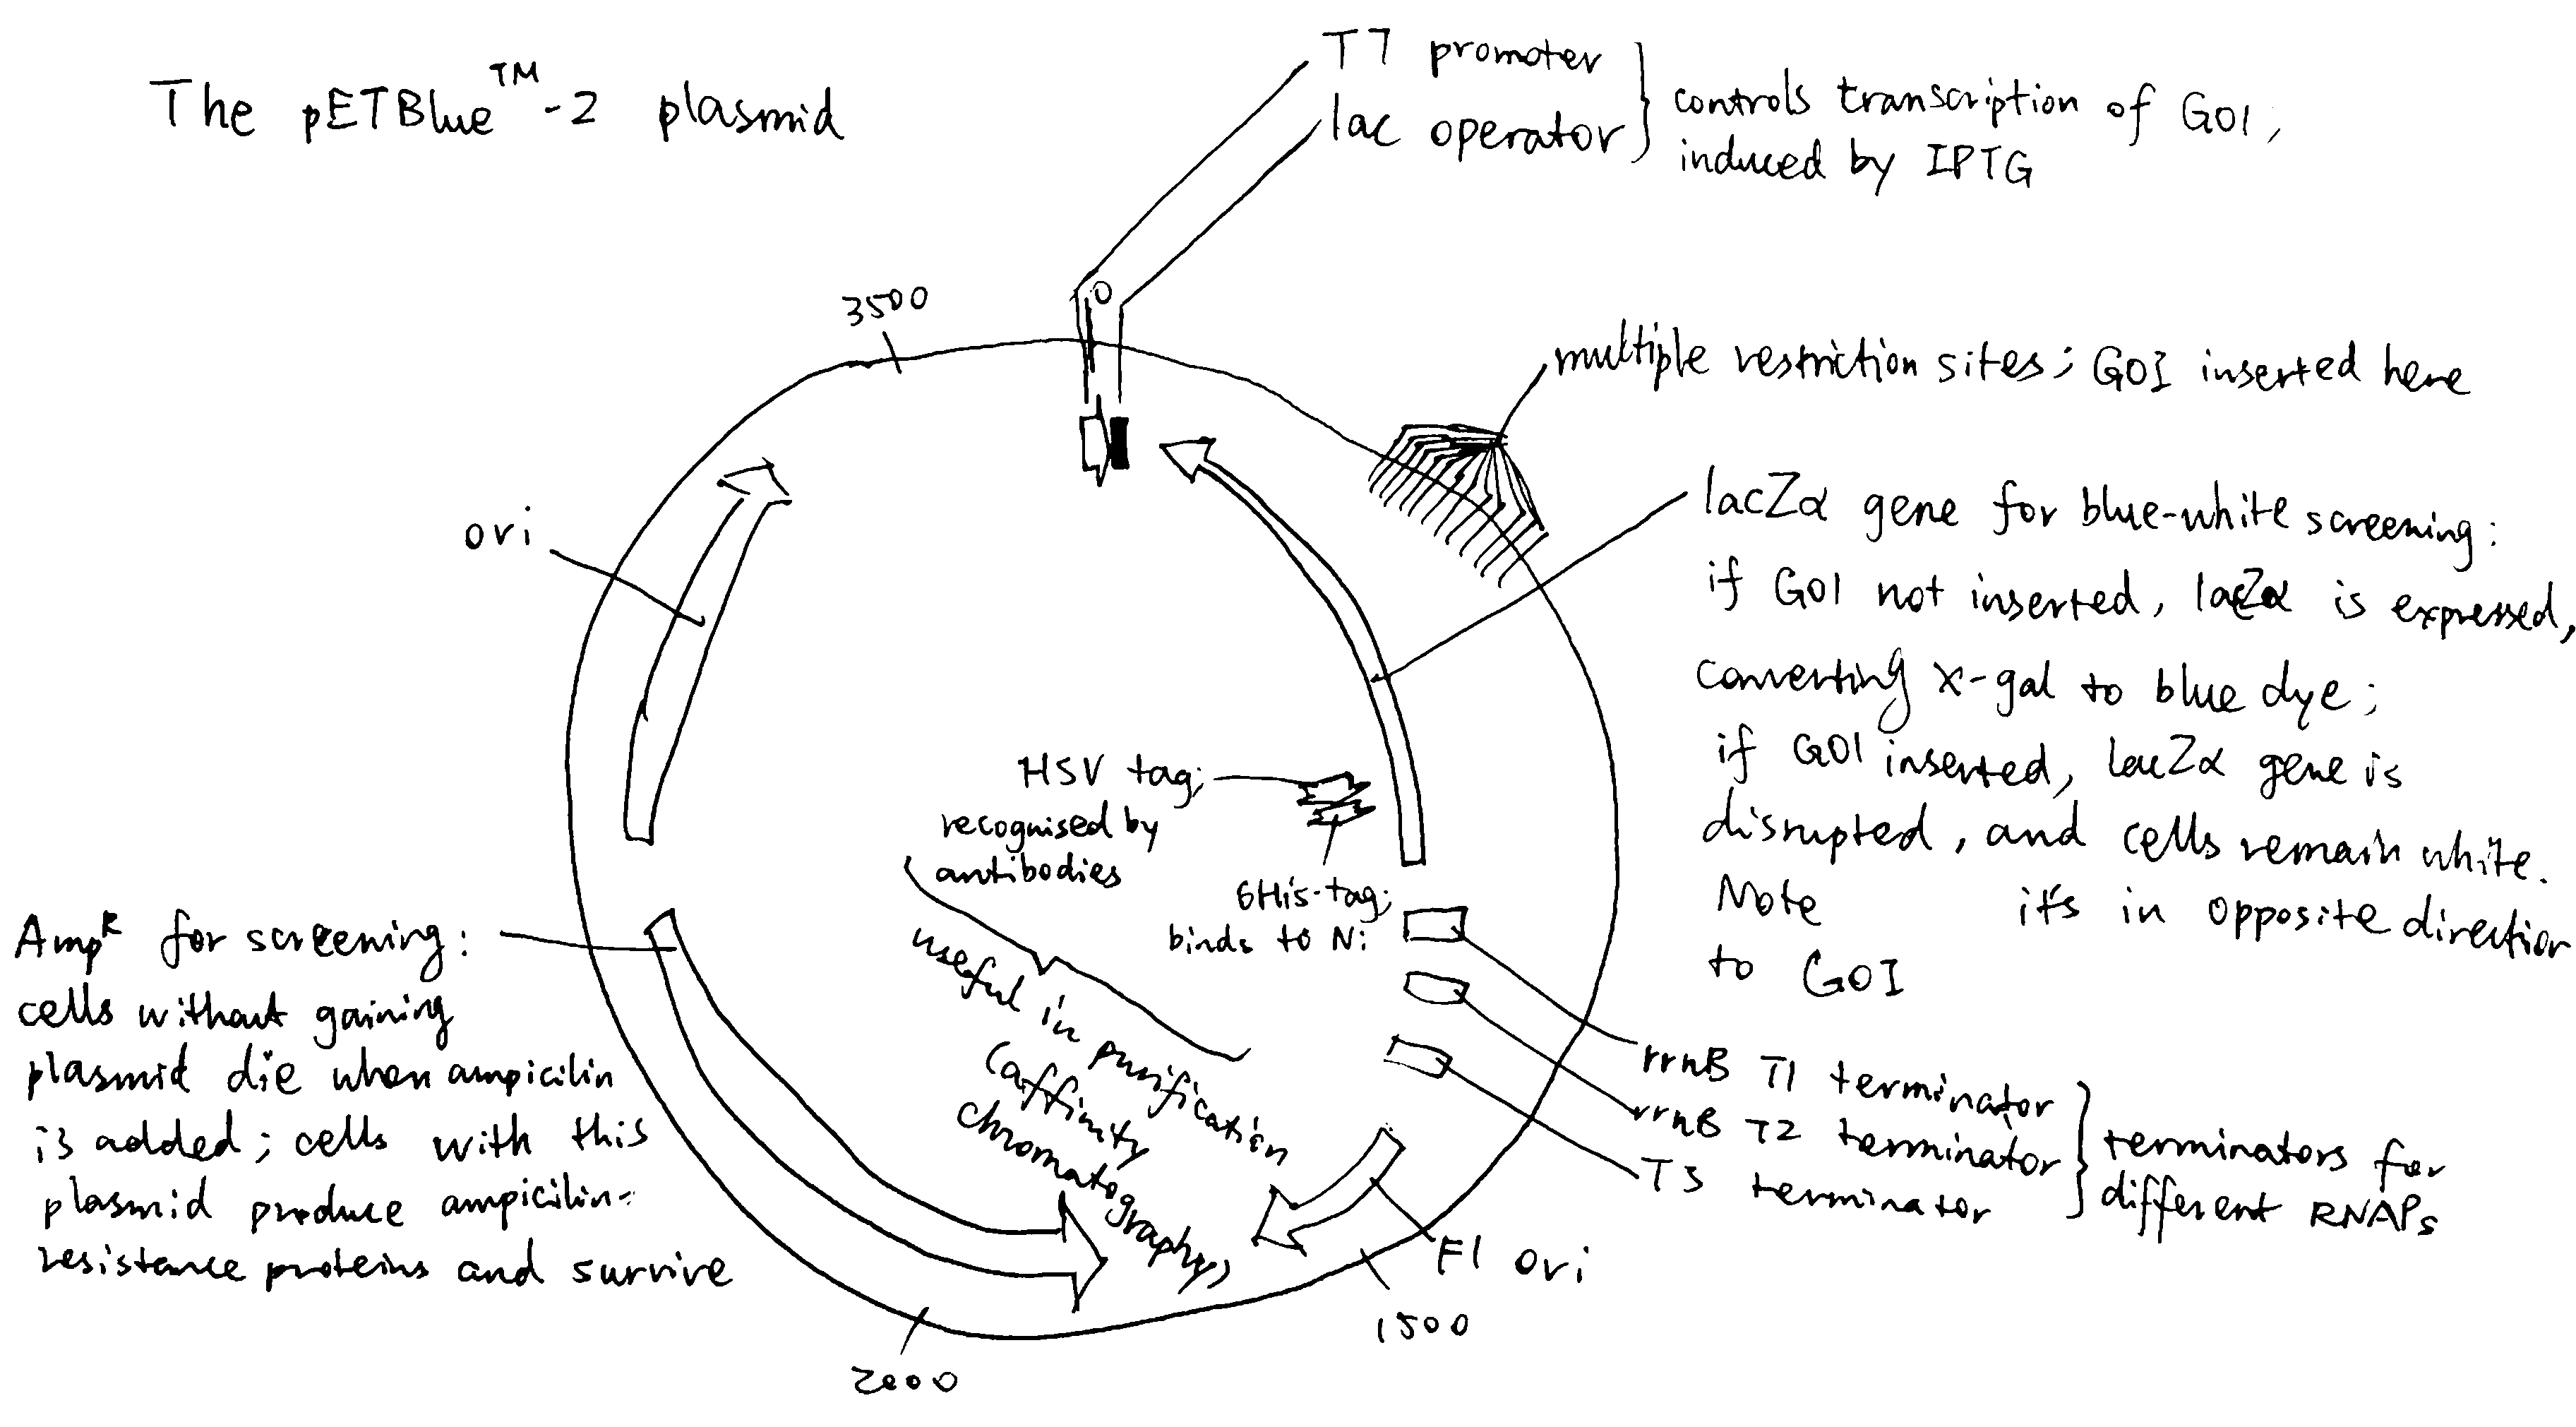
Figure 1.1: The bacterial expression vector pETBlue-2
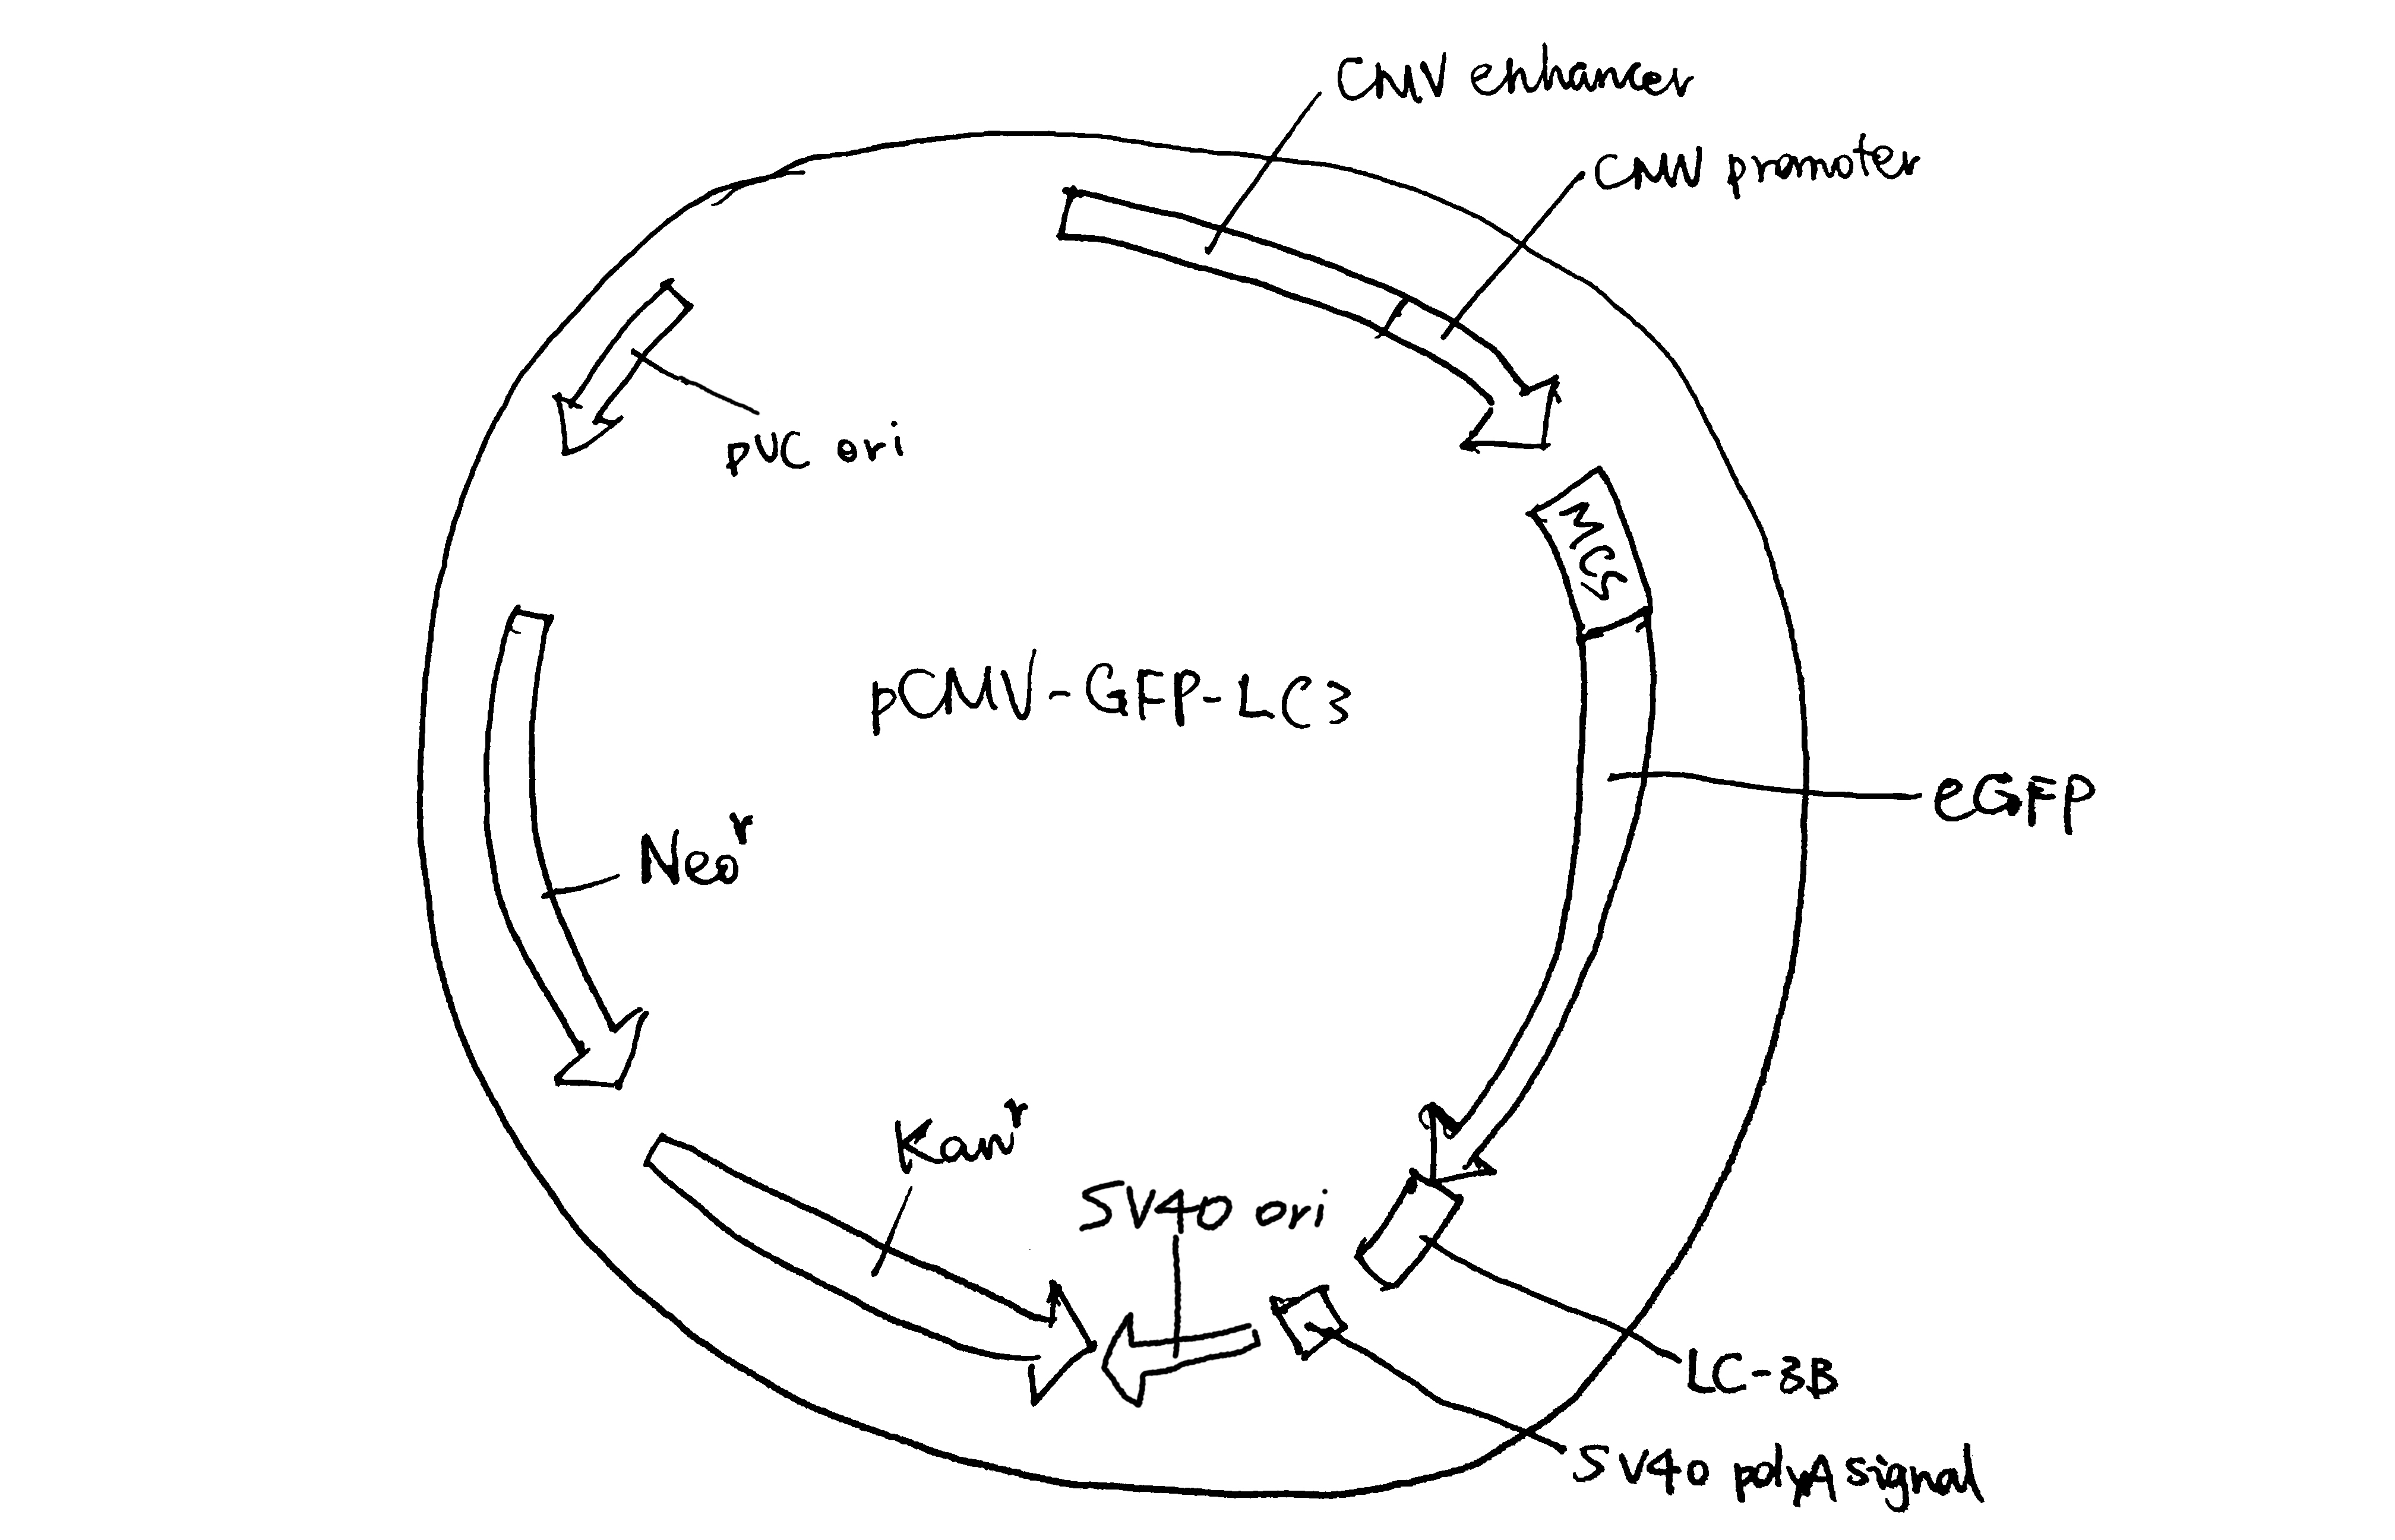
Figure 1.2: The eukaryotic expression vector pCMV-GFP-LC3
1.2 Other bacterial vectors
There are other forms of circular DNA, each with different disirable properties (larger insertion size, low copy number, phage-compatibility, etc.). They are sometimes called ‘high capacity vectors’ because their insertion sizes are greater than simple plasmids.
Bacterial artificial chromosomes (BACs) contain some regions derived from a special plasmid called the F (fertility) factor: the region containing the origin of replication as well as genes that ensured its precise segregation during bacterial cell division. A great advantage of BAC vectors is the large insertion size (100-200 kb). But the very large insertion can be a problem, in that it cannot be manipulated by restriction enzymes. Instead, in vivo homologous recombination-based strategies are used to insert DNA fragments into BACs. (Fig. 1.3)
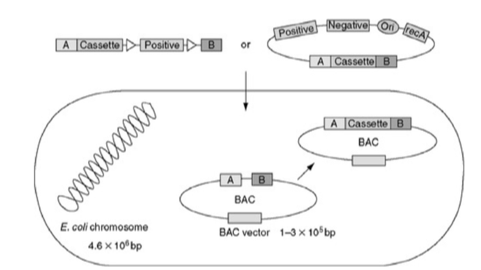
Figure 1.3: Making a BAC
Fosmids are hybrids of \(\lambda\) phage DNA and bacterial F plasmid DNA. Fosmids are packaged into \(\lambda\) phage particles, which delivers them into bacterial cells. Due to the presence of the F plasmid origins of replications, fosmids are maintained at a very low copy number (normally single copy).
Fig. 1.4 is a schematic of 6 high capacity vectors (Saraswathy and Ramalingam 2011).
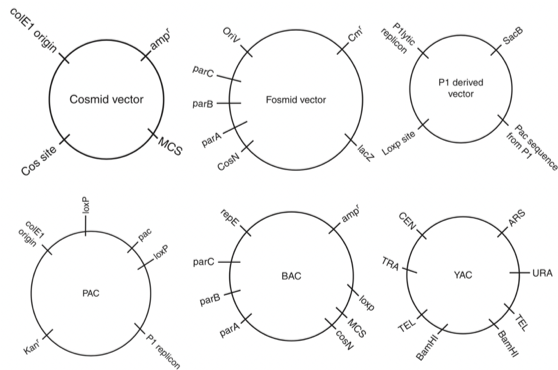
Figure 1.4: Schematic of 6 high capacity vectors.
1.3 Other Eukaryotic Vectors
Yeast artificial chromosome (YAC) has a cloning capacity up to 3000 kbp. It is introduced into the yeast cells by electroporation, then it is maintained as a linear DNA-like chromosome. It is replicated along with other chromosomes in yeast and its copy number of one is maintained after cell divition.
Some viruses (e.g. Adenovirus, Lentivirus and Baculovirus) and bacteria (e.g. Agrobacterium tumefaciens) are reliable vectors for stable transfection of eukaryotic cells (see section 3.2.3)
2 Vector Construction
2.1 Simple plasmids (for both bacteria and eukaryotes)
Traditionally, restriction endonucleases and T4 ligase are used to insert GOI into pladmids. This method has several drawbacks:
- the association between the short 2-4 nt overhangs (sticky ends) is weak
- each DNA insert has to be inspected for any internal restriction sites
- due to the above two reasons, it has very limited capability of constructing multi-fragment plasmids
- incomplete DNA digestion and poor ligation yields
- unwanted amino acids can be introduced to the expressed protein
- the GOI can only be cloned in the vector position where the selected restriction site is present
Ligation-independent cloning (LIC) overcomes many of the problems described above. In a T4 DNA polymerase-dependent approach, the sticky sequences are made by the 3’-to-5’ exonuclease activity of T4 polymerase. These sequences are long, allowing formation of stable recombinant plasmid without in vitro ligase treatment. The nicks in sugar-phosphate backbone are later fixed by the host’s ligase. As T4 polymerase (exonuclease activity) always proceeds from 3’ ends, any internal sticky sequences will not be disrupting and thus the custom stiky sequence can be used for any DNA inserts.
Fig. 2.1 compares the mechanisms of the traditional RE/ligase-based cloning and the T4 polymerase-dependent LIC approach.
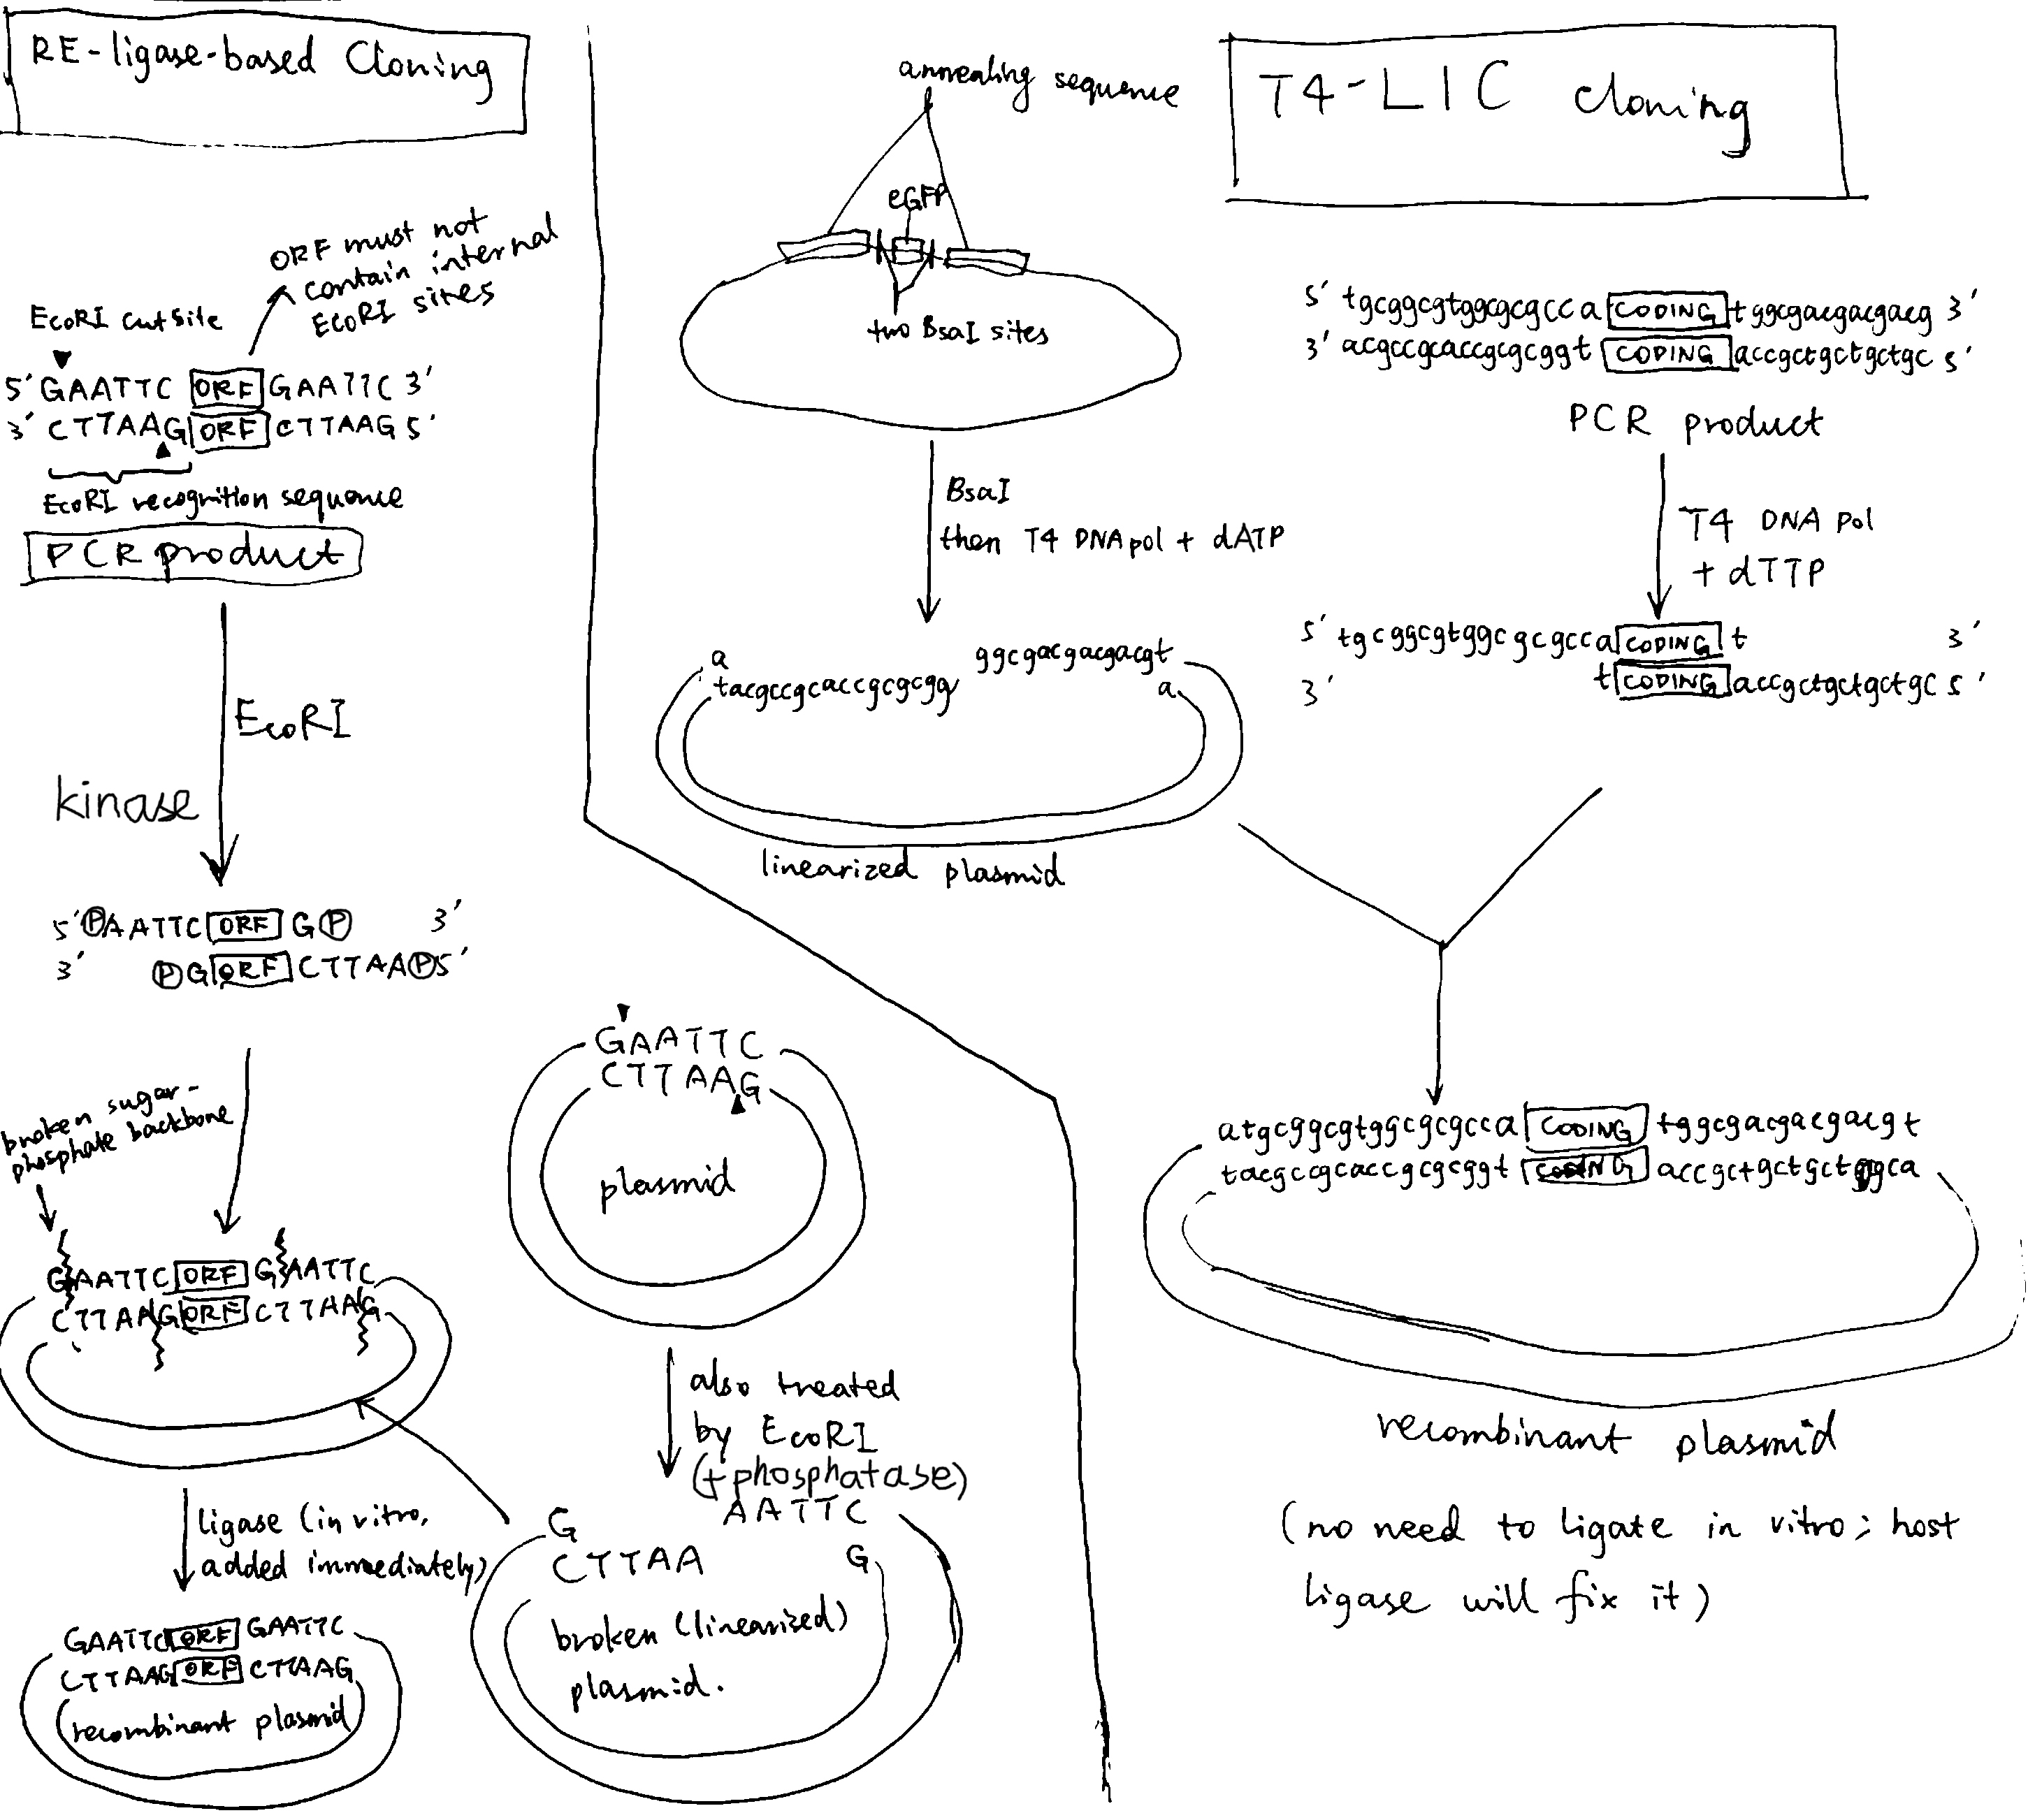
Figure 2.1: Left, traditional cloning based on restriction endonuclease and ligase; right, ligase-independent cloning based on T4 polymerase
There are also other alternatives to the traditional method:
- the Gateway cloning system exploits the site-specific recombination system utilized by bacteriophage lambda to shuttle sequences between plasmids bearing flanking compatible recombination attachment (att) sites
- Gibson assembly is a molecular cloning method which allows for ‘stitching’ multiple overlapping DNA fragments together in a single, isothermal reaction, using exonuclease, polymerase, and ligase.
- TOPO cloning expoits Taq polymerase’s feature that adds non-specific A to the 3’ end, and uses topoisomerase I to hold vectors open and to promote ligation
2.2 Other vectors for bacteria
BACs and fosmids: see section 1.2
2.3 Viral vectors for eukaryotes
See section 3.2.3.1
3 Transformation/Transfection
3.1 Transformation of bacterial cells
3.1.1 Heat-shock transformation
Heat-shock transformation is used for small vectors such as plasmids. The general procedure is as follows:
- Host cells are incubated in a solution containing divalent cations (typically CaCl2) on ice.
- CaCl2 partially disrupts the cell membrane, which allows the recombinant DNA enter the host cell. Such cells are called competent cells.
- Cells are exposed to a heat pulse (heat shock), and the thermal imbalance causes the entry of DNA through disrupted plasma membrane.
3.1.2 Electroporation
Electroporation can be used for larger vectors such as BAC and PAC2. The general procedure is as follows:
- Host cells are placed into a cuvette, together with the vector. The cuvette is connect to electrodes.
- The cuvette containing the mixture is subjected to intense electric pulses (2500 V/cm for bacteria, lower for animal and plant cells) each lasting for only a few milliseconds
- Most cells would die under such treatment, but for those survived, their membranes are polarised by the electric field and are disrupted, and DNA enters through the pores. Finally, the membrane reseals after the treatment.
3.1.3 Other methods
Cosmid, fosmid and PAC vectors are introduced into bacterial cells via bacteriophages. (See section 1.2)
3.2 Transfection of Eukaryotic Cells
Transfection of eukaryotic cells can be transient or stable. Transient gene expression is generally used in academic settings, when the product of the GOI (usually a protein) is used for short-term research purposes. Stable transfection is usually used in indusdries, but it is also used in academia for specific purposes.
3.2.1 Physical methods
In general, physical methods work by briefly pushing holes through the memrbane. The three specific methods are:
- electroporation, which is described above as a transformation method for bacteria, can also be applied to eukaryotic cells. The mechanism is the same but the voltage used for eukaryotic cells are lower.
- microinjection entails injection of recombinant DNA (or RNA) into the cytoplasm or nucleus. This is method particularly convinient for large eukaryotic cells, such as the syncytial gonadal cell of Caenorhabditis elegans and the fertilised egg of Mus musculus.
- biolistic delivery of tungsten- or gold-coated DNA (or RNA) by gene gun is mostly used with plant cells.
3.2.2 Chemical methods
In general, chemical methods work by sheding the negative charge on DNA so as to apprach and cross the plasma membrane, which is also negatively charged.
- CaPO4 co-precipitation involves mixing DNA with CaCl2 in a phosphate solution to generate a CaPO4-DNA co-precipitate, which is then added to cultured cells. DNA enters the cell by endocytosis.
- the cationic diethylaminoethyl(DEAE)-dextran work similarly by associating and neutralising negatively charged DNA
- cationic lipids work similarly by forming DNA-lipid complexes (DNA is not encapsulated in liposomes)
- By far, the most cost-effective chemical carrier is polyethylenimine (PEI), which works similarly by forming DNA-PEI complexes (L’Abbé et al. 2018)
3.2.3 Biological methods
The physical and chemical methods described above are generally used for transient transfection. Although they may produce stably transfected cells (when the rare homologous recombination events occur), the probability is very low and the GOI is inserted randomly and is thus not expressed with greatest efficiency (the chances are low that the GOI is inserted into a highly ‘transcriptionally open’ region).
Biological methods significantly improve the chance of integration of GOI into the host’s genome, and can even direct the site of insertion.
3.2.3.1 Lentiviral transduction as an example of viral transfection (Merten, Hebben, and Bovolenta 2016)
Lentiviruses (LV) carry a genome made of (+) strand RNA. Upon infection, the viral RNA genome is reverse-transcribed and the cDNA is stably integrated into the host’s genome. Unlike \(\gamma\)-retroviruses, LVs exploit active nuclear transport and thus do not rely on cell division to access the nucleus. Fig. 3.1 is an example of the third generation HIV-1 vector system.
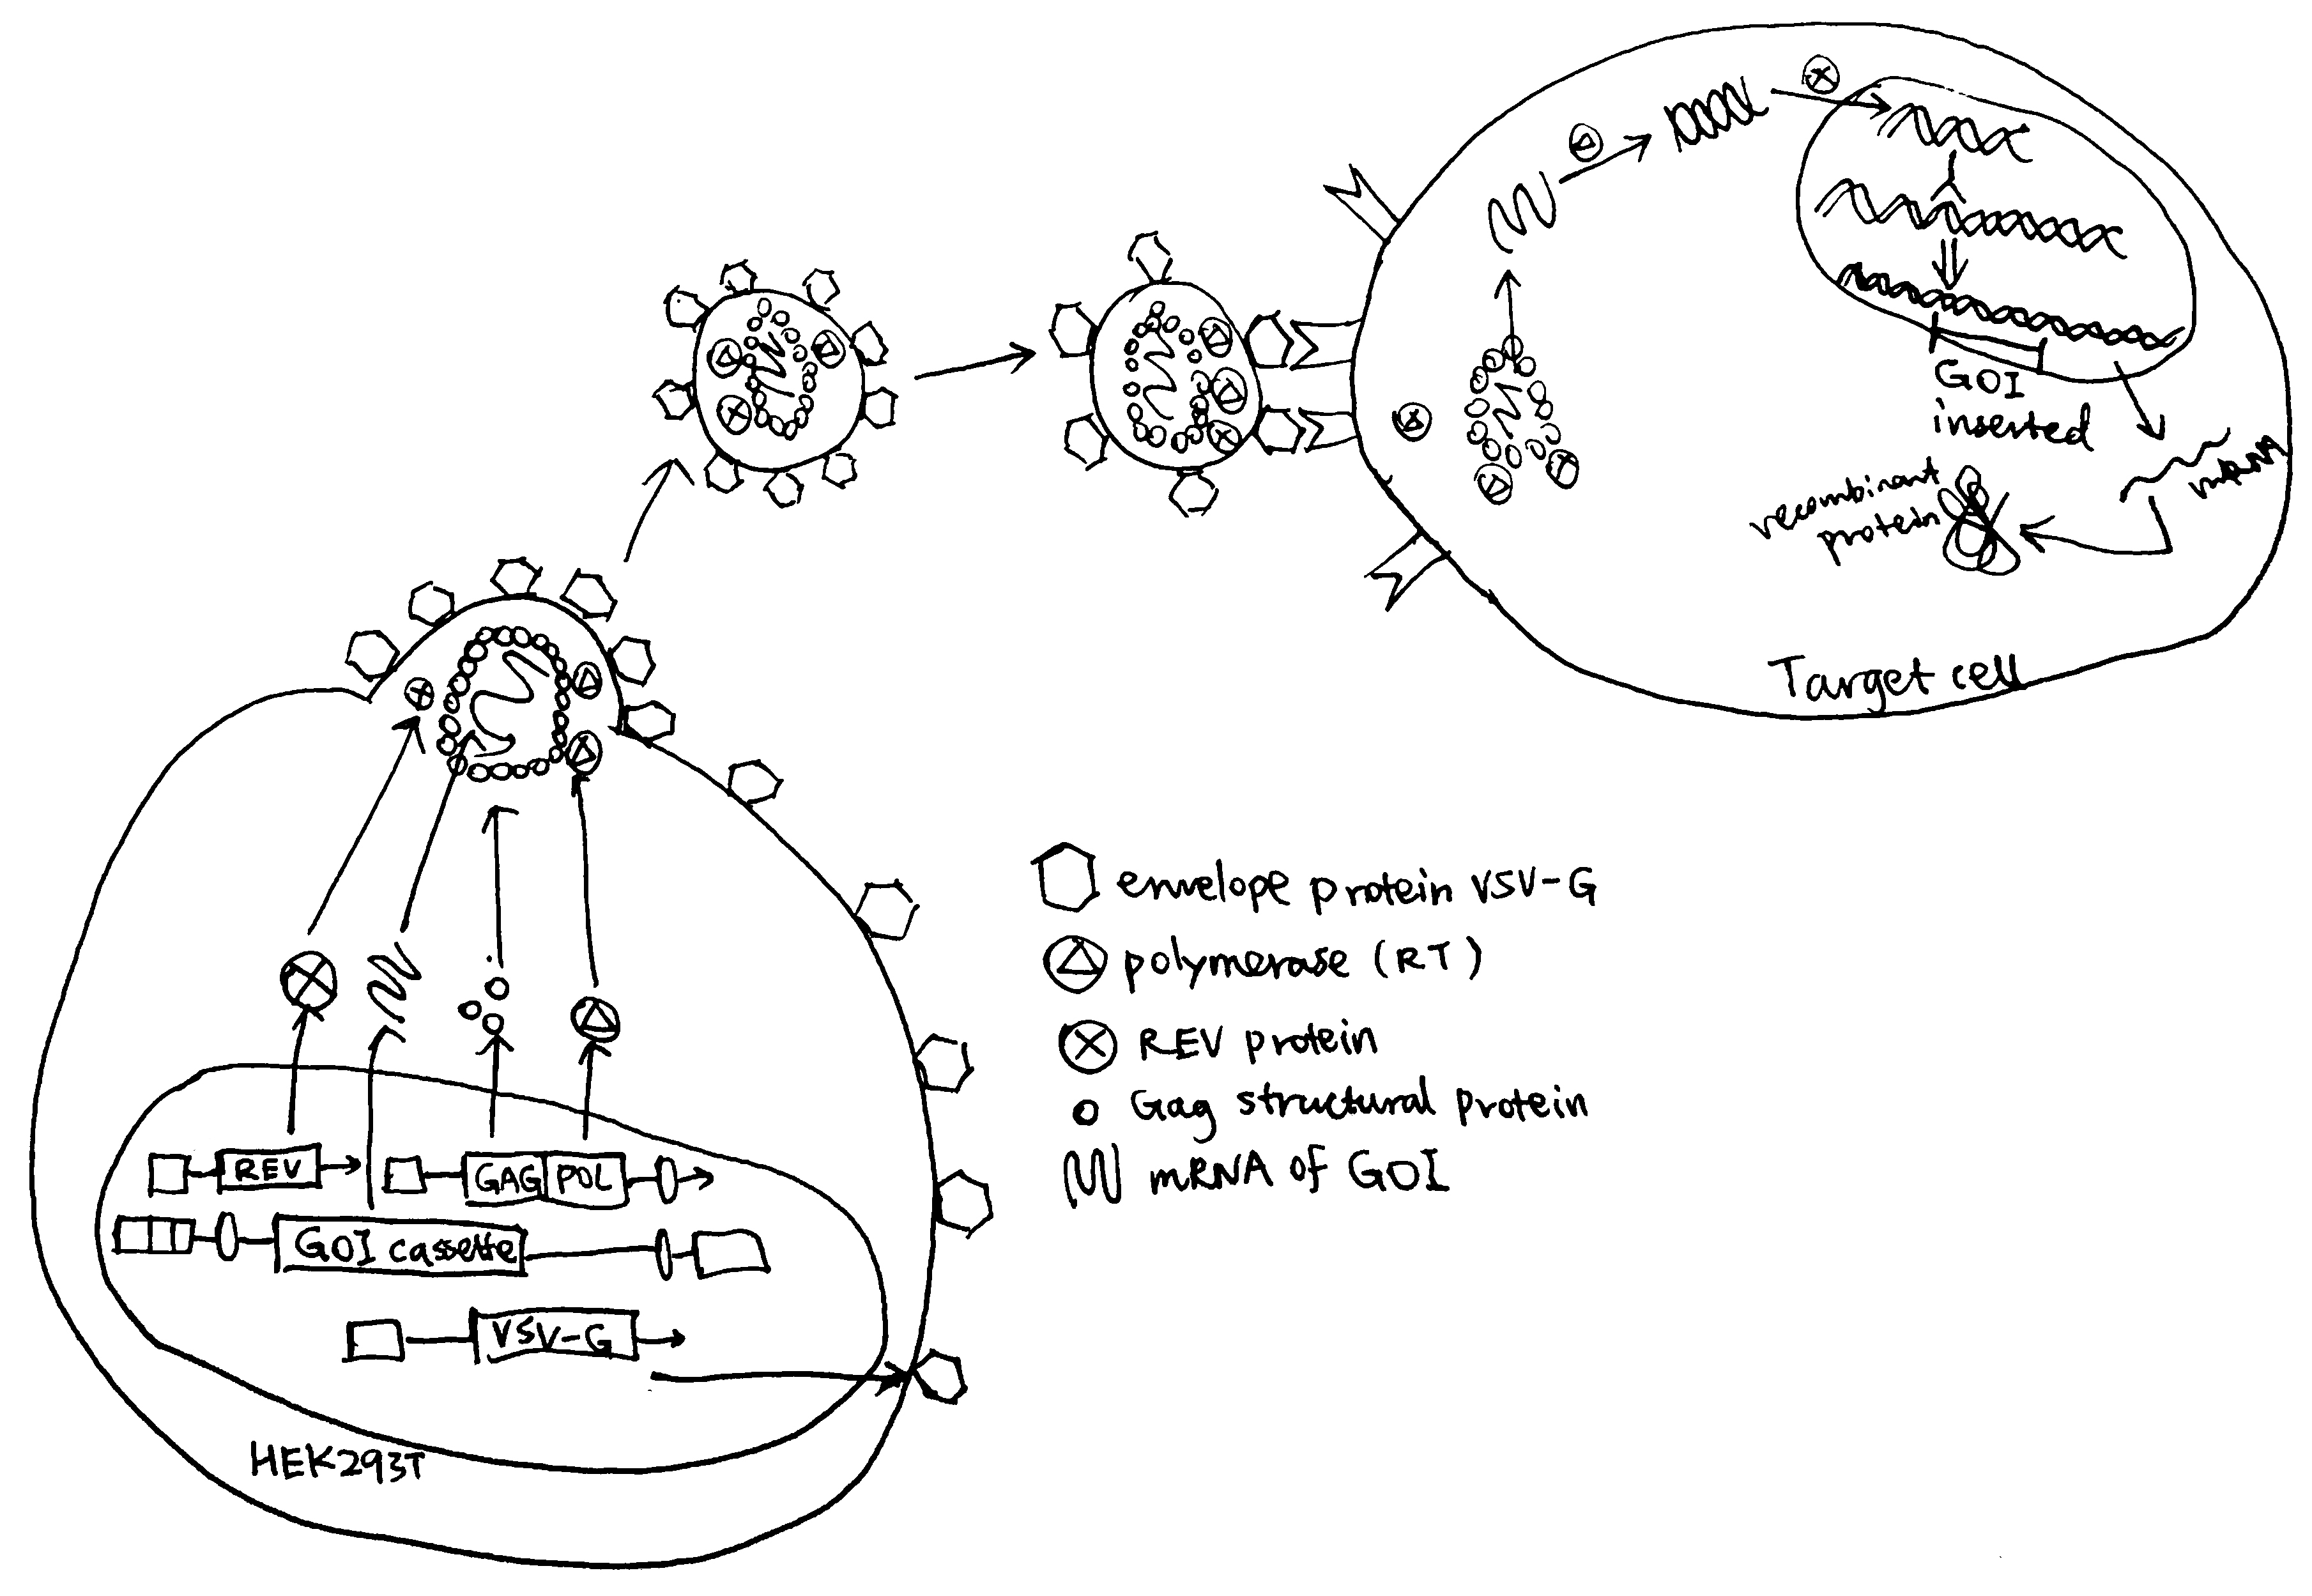
Figure 3.1: Production of recombinant LV particles and their infection. Production of recombinant LV particles is usually accomplished by transfection of HEK293T cells with a set of three helper plasmids and additionally a LV vector plasmid that encodes the GOI as well as optional reporter (e.g resistance, fluorophore) genes. LV particles released from HEK helper cells infect target cells and integrate the GOI into their genome.
3.2.3.2 Ti plasmid and Agrobacterium tumefaciens infection
Agrobacterium tumefaciens is the bacterium that causes crown gall disease in plants. When the it infects a plant cell, a part of its Ti plasmid, called T-DNA, is transferred and inserted (at random) into the genome of the plant cell. Thus, the T-DNA can be replaced with any GOI for stable transfection of plant cells.
3.2.3.3 CRISPR-Cas9 Transfection
The CRISPR-Cas9 system comprises a short guide RNA (gRNA) and the Cas9 nuclease. The gRNA guides Cas9 to a specific gene locus that is complementary to its crRNA portion, then Cas9 makes a double strand break, which is dependent on the PAM (protospacer adjacent motif) sequence immediately downstream of the recognition sequence.
Following DNA cleavage, the break is repaired by either non-homologous end joining (NHEJ) or homology directed repair (HDR). It is the HDR mechanism that may cause integration of GOI into the cleavage site.
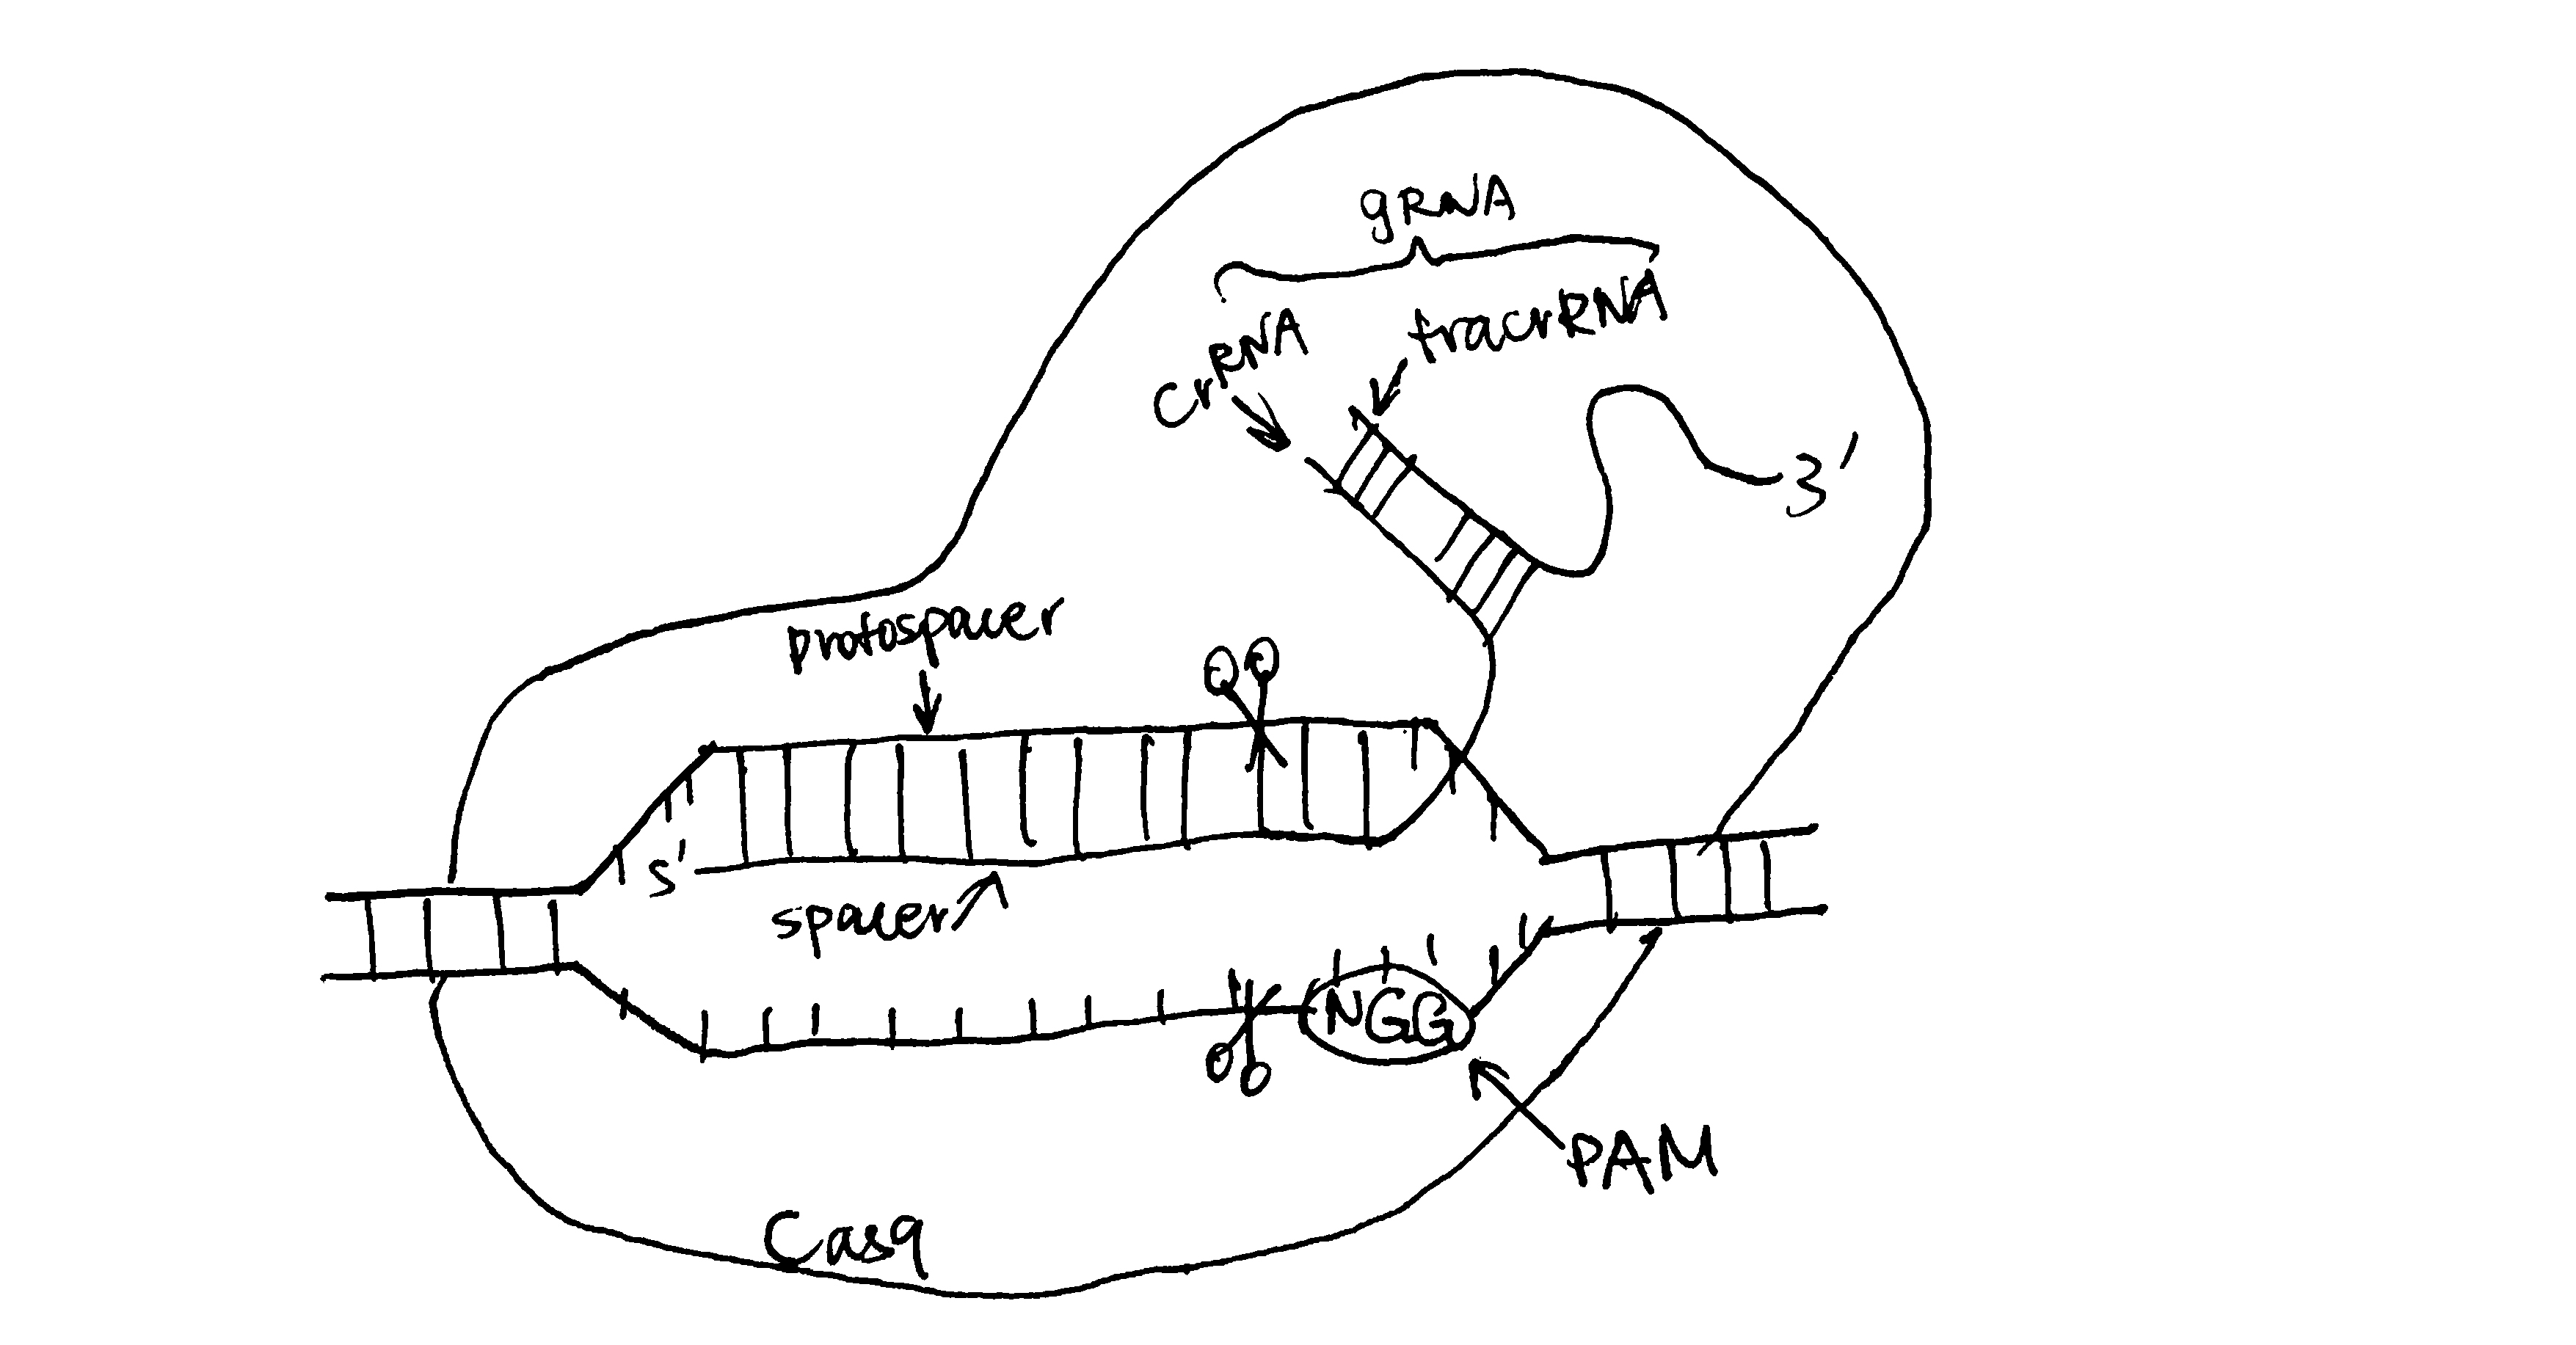
Figure 3.2: gRNA directed DNA cleavage by Cas9
References
Alberts, Bruce, Alexander Johnson, Julian Lewis, David Morgan, Martin Raff, Keith Roberts, and Peter Walter. 2014. Molecular Biology of the Cell. Book. 6th ed. Garland Science.
Balbás, Paulina, and Argelia Lorence. 2012. Recombinant Gene Expression: Reviews and Protocols. Book. 2nd ed. Vol. 267. Methods in Molecular Biology. Springer.
Griffiths, Anthony J. F., Susan R. Wessler, Sean B. Carroll, and John Doebley. 2015. “Gene Isolation and Manipulation.” In Introduction to Genetic Analysis, 11th ed. W.H. Freeman.
Hacker, David L. 2018. Recombinant Protein Expression in Mammalian Cells: Methods and Protocols. Book. Vol. 1850. Methods in Molecularbiology. Humana Press. https://doi.org/10.1007/978-1-4939-8730-6.
L’Abbé, Denis, Louis Bisson, Christian Gervais, Eric Grazzini, and Yves Durocher. 2018. “Transient Gene Expression in Suspension Hek293-Ebna1 Cells.” In Recombinant Protein Expression in Mammalian Cells: Methods and Protocols, edited by David L. Hacker. Vol. 1850. Humana Press.
Merten, Otto-Wilhelm, Matthias Hebben, and Chiara Bovolenta. 2016. “Production of Lentiviral Vectors.” Molecular Therapy - Methods & Clinical Development 3: 16017. https://doi.org/https://doi.org/10.1038/mtm.2016.17.
Mizushima, S, and S Nagata. 1990. “PEF-Bos, a Powerful Mammalian Expression Vector.” Nucleic Acids Res 18 (17). Osaka Bioscience Institute, Japan.: 5322. https://doi.org/10.1093/nar/18.17.5322.
Patel, Asmita, Anisleidys Muñoz, Katherine Halvorsen, and Priyamvada Rai. 2012. “Creation and Validation of a Ligation-Independent Cloning (Lic) Retroviral Vector for Stable Gene Transduction in Mammalian Cells.” BMC Biotechnology 12 (1): 3. https://doi.org/10.1186/1472-6750-12-3.
Saraswathy, Nachimuthu, and Ponnusamy Ramalingam. 2011. “High Capacity Vectors.” In Concepts and Techniques in Genomics and Proteomics, 49–56. Woodhead Publishing. https://doi.org/https://doi.org/10.1533/9781908818058.49.
Singha, Tapan Kumar, Pooja Gulati, Aparajita Mohanty, Yogender Pal Khasa, Rajeev Kumar Kapoor, and Sanjay Kumar. 2017. “Efficient Genetic Approaches for Improvement of Plasmid Based Expression of Recombinant Protein in Escherichia Coli: A Review.” Journal Article. Process Biochemistry 55: 17–31. https://doi.org/https://doi.org/10.1016/j.procbio.2017.01.026.
Valla, Svein, and Rahmi Lale. 2014. DNA Cloning and Assembly Methods. Book. Vol. 1116. Methods in Molecular Biology. Humana Press. https://doi.org/10.1007/978-1-62703-764-8.
pBLIC-puro was a gift from Priyamvada Rai (Addgene plasmid # 45197 ; http://n2t.net/addgene:45197 ; RRID:Addgene_45197)↩
P1-derived artificial chromosome↩
2019
Explain how antibiotics and genetic mutations have helped in our understanding of the mechanism of protein synthesis on the ribosome.
Introduction
Protein synthesis occurs in ribosomes and involves 3 phases: initiation, elongation (which is subdivided into 4 steps) and termination. Each phase depends on the correct conformation and/or catalytic activity of different domains of the ribosomal complex and soluble protein factors (IFs, EFs and RFs). The identities and mechanisms of these critical RNA/protein domains (in bacterial cells) can be investigated by genetic mutation and antibiotics, which hinder their normal functions, along with recent advances in biophysical methods, which allows high resolution structures to be determined for ribosomes in different contexts.
Background information
The Ribosome
The bacterial 70S ribosome comprises two subunits, the 50S (large) and the 30S (small) subunit. The 30S subunit mediates selection of cognate aminoacyl tRNAs and the 50S subunit contains the peptidyl-transferase centre (PTC), which catalyses addition of new amino acids to the elongating polypeptide chain.
The process of protein synthesis
The 3 phases of protein synthesis are initiation, elongation and termination.
During initiation, the 3’ end of the 16S rRNA of the 30S subunit base-pairs with the Shine-Dalgarno sequence, which positions the start codon (usually AUG) in the P site for the binding of the initiator tRNA (usually fMet-tRNA) and IF1, 2, 3. Joining of the 50S subunit and dissociations of IFs primes the elongation phase.
The elongation phase, where new amino acids are appended to the growing polypeptide, involves 4 steps:
- Decoding. An aminoacylated tRNA (aa-tRNA) is delivered to the A-site of the ribosome by elongation factor EF-Tu complexed with GTP. GTP hydrolysis facilitates discrimination between cognate and non-cognate tRNAs.
- Peptidyl transfer. The peptidyl-transferase centre (PTC) on the 50S subunit catalyses the formation of peptide bond between the amino acids attached to the tRNAs in the A- and P-sites by transferring the polypeptide chain from the P-site tRNA to the aa-tRNA in the A-site.
- Translocation. EF-G catalyses the movement tRNAs from the A and P sites to the P and E sites
- the growing polypeptide chain passes through an exit tunnel
Finally, when the stop codon (UAA/UAG/UGA) is encountered, it is recognised by release factors (RF1/RF2) that forces hydrolysis of the peptidyl-tRNA bond in the P-site, thus releasing the polypeptide chain from the ribosome.
Mutations
Mutation in different components of protein synthesis (tRNA, ribosomal proteins, rRNAs) can all lead to decreased fidelity of this process.
The tRNA needs to undergo a structual transition that involves a 30\(^\circ\) bend in order to achieve the A/T (decoding) conformation. Mutagenesis studies showed that two mutations in the D-stem, A9C and G24A, promote miscoding and these two bases are critical for distortion of the cognate tRNA that is required for decoding.
Mutagenesis studies also help to identify ribosomal proteins that are critical in the decoding process. The mutations can be classified into two types according to their implication on the speed and accuracy/robustness of translation: ram (ribosome ambiguity) mutations improve speed but has a higher frequency of failure in rejecting non-cognate tRNAs; in contrast, ribosomes with str (stringency) mutations are slower and more accurate, but they reject some cognate aa-tRNAs and thus waste GTP. Most of such mutations are found in the ribosomal proteins S12, S5 and S4, which are close to the decoding site, and these proteins have an important effect on codon/anticodon interactions.
Antibiotics
The antibiotic puromycin can be used to demonstrate the existence of A and P sites in the ribosome and the ATP/GTP-independent nature of the peptidyl transfer reaction.
Puromycin (PM) is an aa-tRNA analogue which is composed of an nucleoside and an bound amino acid. Unlike the normal aa-tRNA where the 5’ OH of the nucleoside (adenosine) is linked to the rest of the tRNA, PM has a free 5’ OH. Therefore, PM can fit into the peptidyl transfer centre (PTC) and accept the polypeptide chain in the peptidyl tranfer reaction, but the new peptide with PM attached is released immediately because PM does not have an attached tRNA to anchor it to the ribosome.
The details of the experiment is shown below and in Figure 1:
- Take a cell free system containing: ribosomes, Mg2+-containing buffer, poly-U mRNA, 14C-Phe-tRNA, ATP/GTP-regenerating system and add varying concentrations of soluble cell extract.
- This yields ribosomes carrying polyPhe-tRNA (not free polyPhe or poly-Phe-tRNA unbound to ribosomes). [with prior knowledge, this is because there are no stop codons on the mRNA and hence RFs are not recruited to terminate translation]
- the ribosomes are washed to remove soluble proteins and ATP/GTP.
- then they are incubated with puromycin (PM)
- about 50% of the ribosomes release 14 labelled polyPhe as polyPhe-PM [As shown in Figure 1, the convertion from state 2 to 3 and from state 3 to 1 requires GTP, and the convertion from state 1 to 2 (peptidyl transfer) does not. Therefore, when GTP is removed, protein synthesis is either trapped in state 2 or 3]
- without a tRNA, PM cannot bind to the ribosome (at A/P sites) so the compound with polyPhe is released
Conclusion: ribosome itself catalyses the formation of the peptide bond without energy supplying molecules (ATP/GTP).
- now wash the ribosomes to remove the PM
- add soluble cell extract and GTP, then more PM
- the remaining 50% ribosomes release polyPhe-PM
Conclusion:
- ribosomes have a ‘PM-reactive’ site (P site) and a ‘PM-unreactive site’ (A site)
- soluble cell extract can translocate from RM-unreactive to PM-reactive site (driven by EF-G)
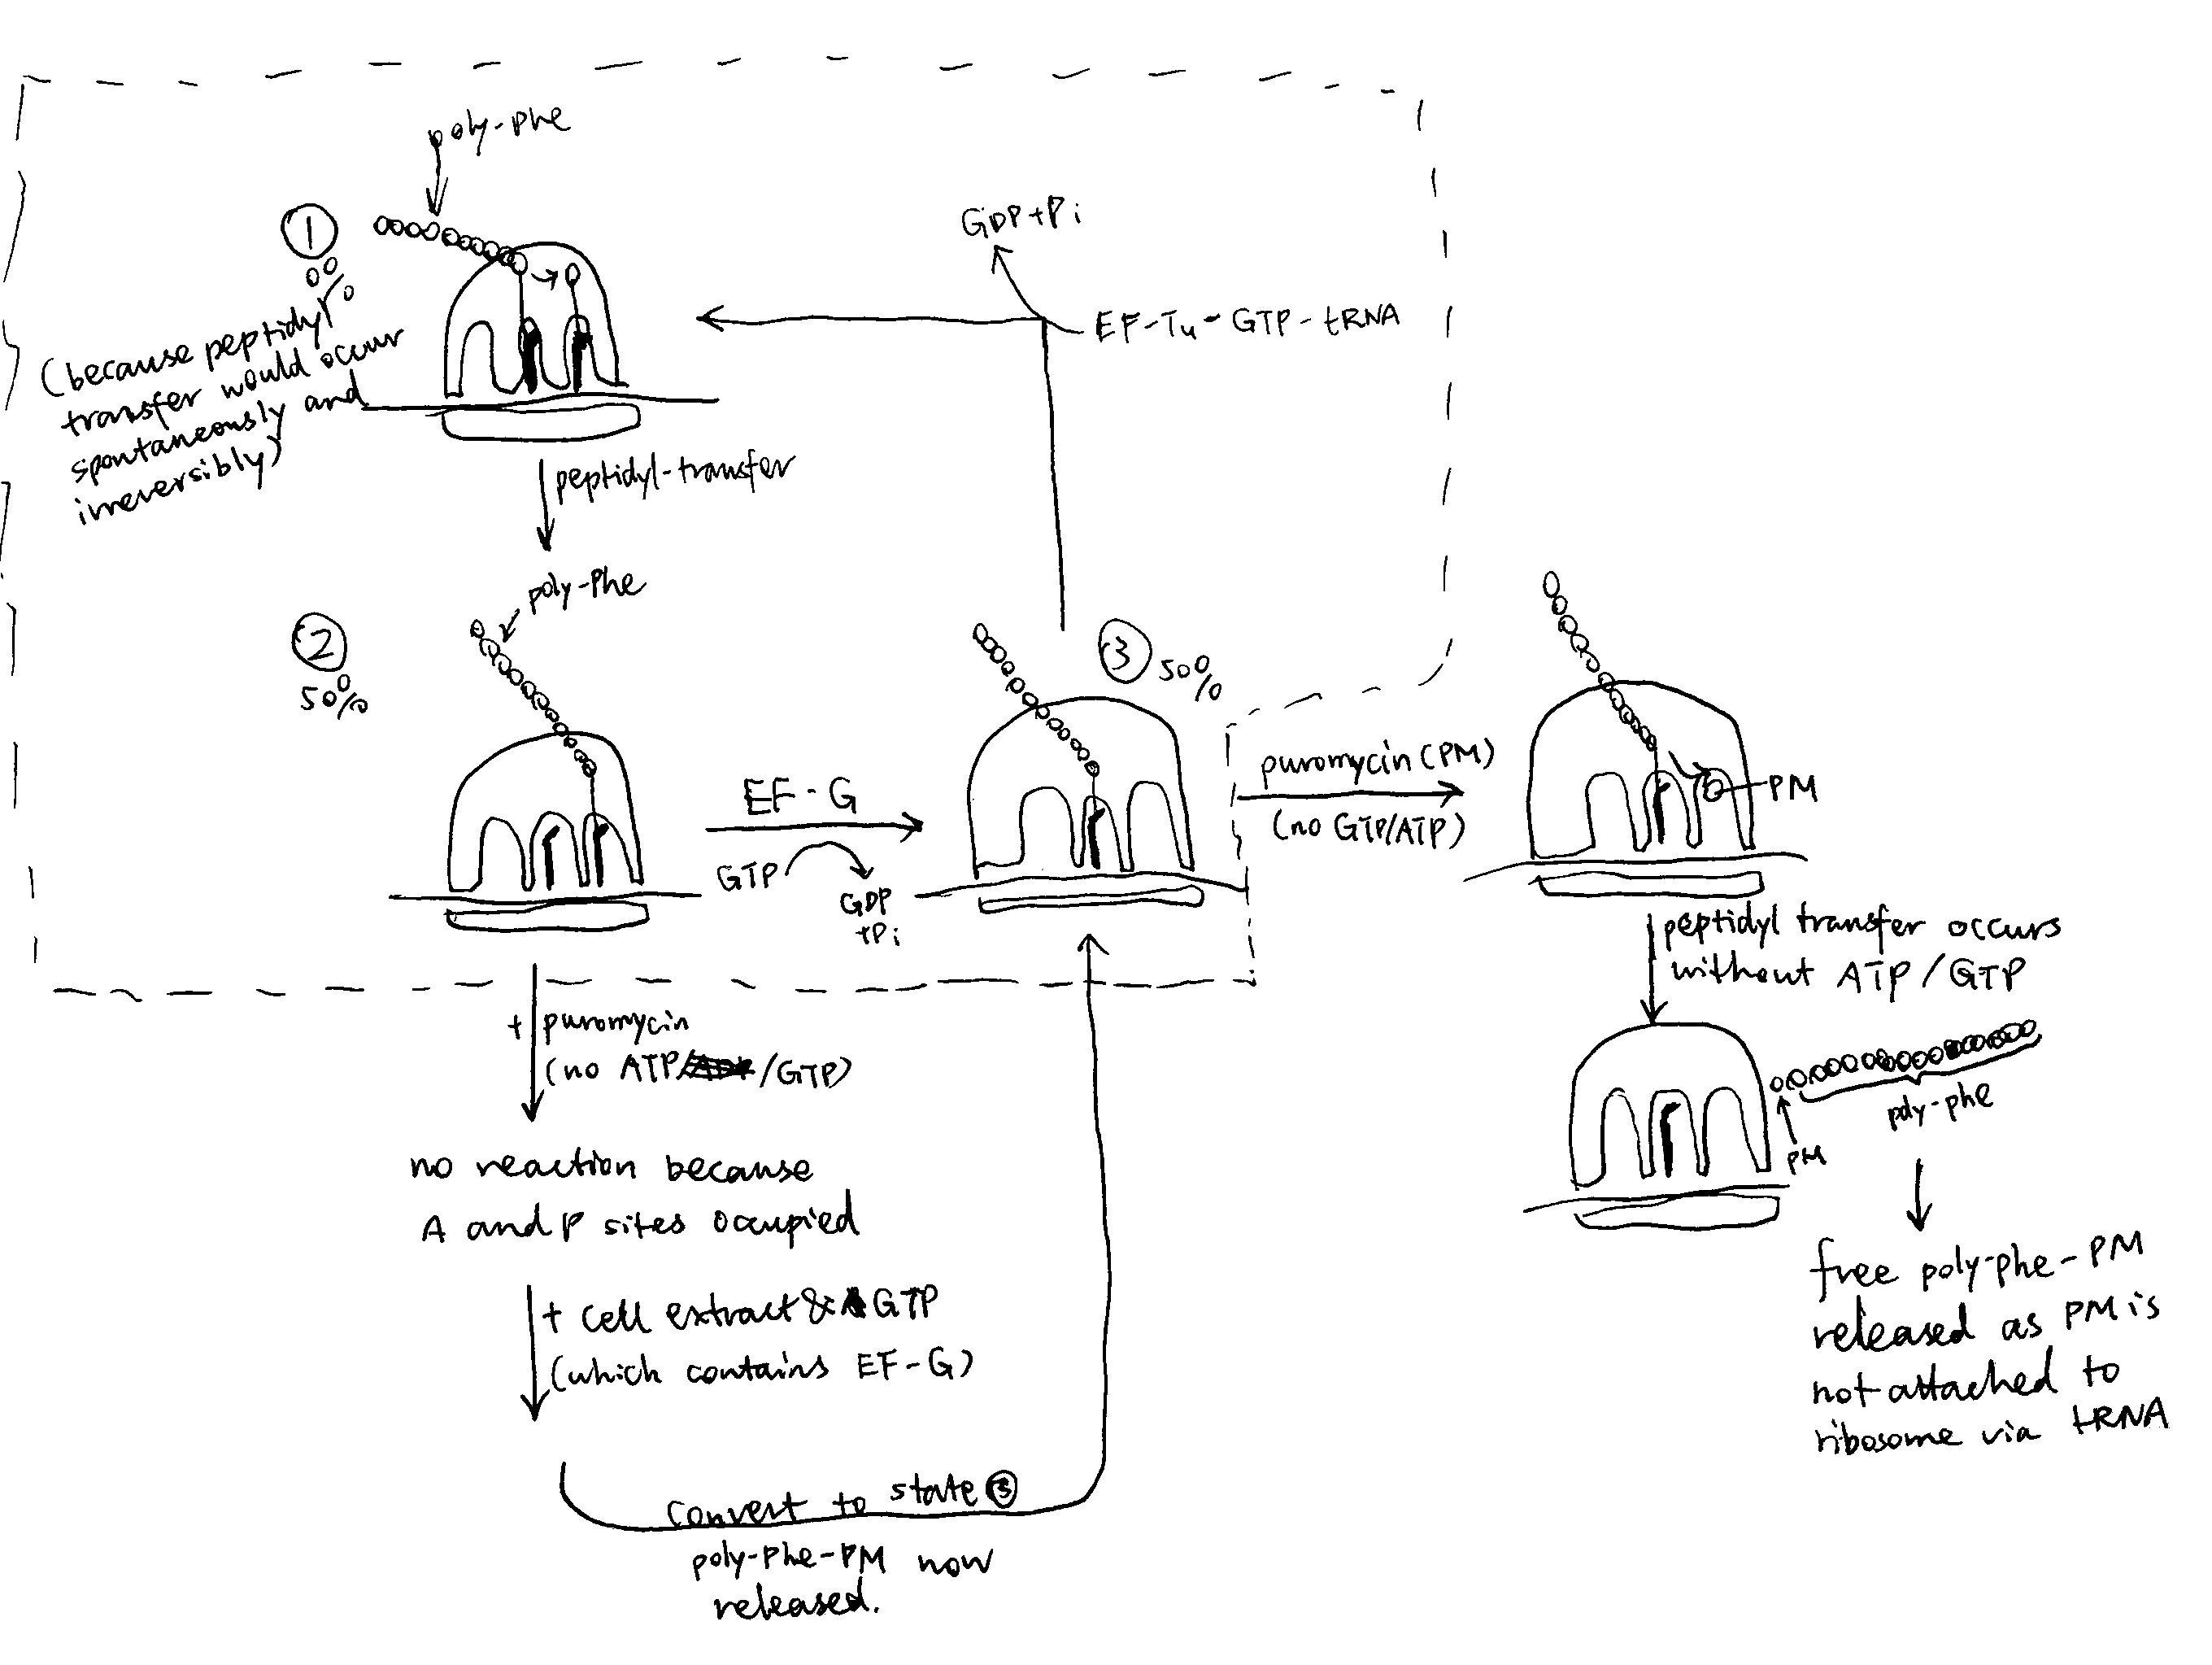
Figure 1: The puromycin experiment.
Summary
Mutagenesis and ribosome-targeting antibiotics are valuable tools for studying the mechanisms of protein synthesis in the ribosome. These methods are usually aided by cryo-EM and X-ray crystallography to probe into the 3D molecular details.
Mutations in tRNA, rRNA and associated proteins give information on their specific roles and behaviours during protein synthesis. Antibiotics with various (and usually predictable) chemical properties is another way of studying the mechanisms of protein synthesis. Apart from the puromycin (which targets the peptidyl transfer centre) mentioned in this essay, there is a wide range of antibiotics that target different steps of protein synthesis. For example, streptomycins interferes with the delivery of tRNAs to the A-site and neomycin hinders translocation following peptidyl transfer. High resolution crystal structures were obtained for many of these antibiotics in complex with the ribosome (or part of ribosome). These structures are indicative of functionally important sites in the ribosome and they often shed light on the mechanisms.
Overview
RNA splicing by spliceosomes removes introns from nascent pre-mRNA and joins protein-coding exon sequences, which matures the mRNA and makes it ready for translation. By chosing variable splice sites, different mature mRNAs (and hence proteins) can be produced from the same pre-mRNA.
Structure of the Intron
Splice sites (i.e. exon-intron junctions) have conserved features. As shown in Figure 1, most introns have an invariant GU at the 5’ end (5’ splice site) and AG at the 3’ end (3’ splice site), their flanking sequences are variable but the bases are found at frequencies higher than expected based on a random distribution. The branch point A is also invariant, and most introns also have a polypyrimidine tract between the branch point and the 3’ splice site. These ‘standard’ pre-mRNAs are spliced by snRNPs U1, U2, U4, U5, and U6. A small fraction of pre-mRNA does not follow the ‘GU-AG’ rule and have 5’-AU and AC-3’ instead, which are spliced by four low-abundance snRNPs together with U5.

Figure 1: The structure of a typical intron
Spliceosome Assembly and the Splicing Process
The spliceosome is a large and dynamic RNP machine whose size is comparable to a ribosome. The 5 snRNPs that constitute the spliceosome are U1, U2, U4, U5, and U6, each of which is a association of an snRNA with proteins. The key catalytic activity is attributed to RNA, so the spliceosome is an ribozyme. A spliceosome is assembled whenever an intron is to be removed and its components are recycled after splicing. The series of events are shown in Figure 2.
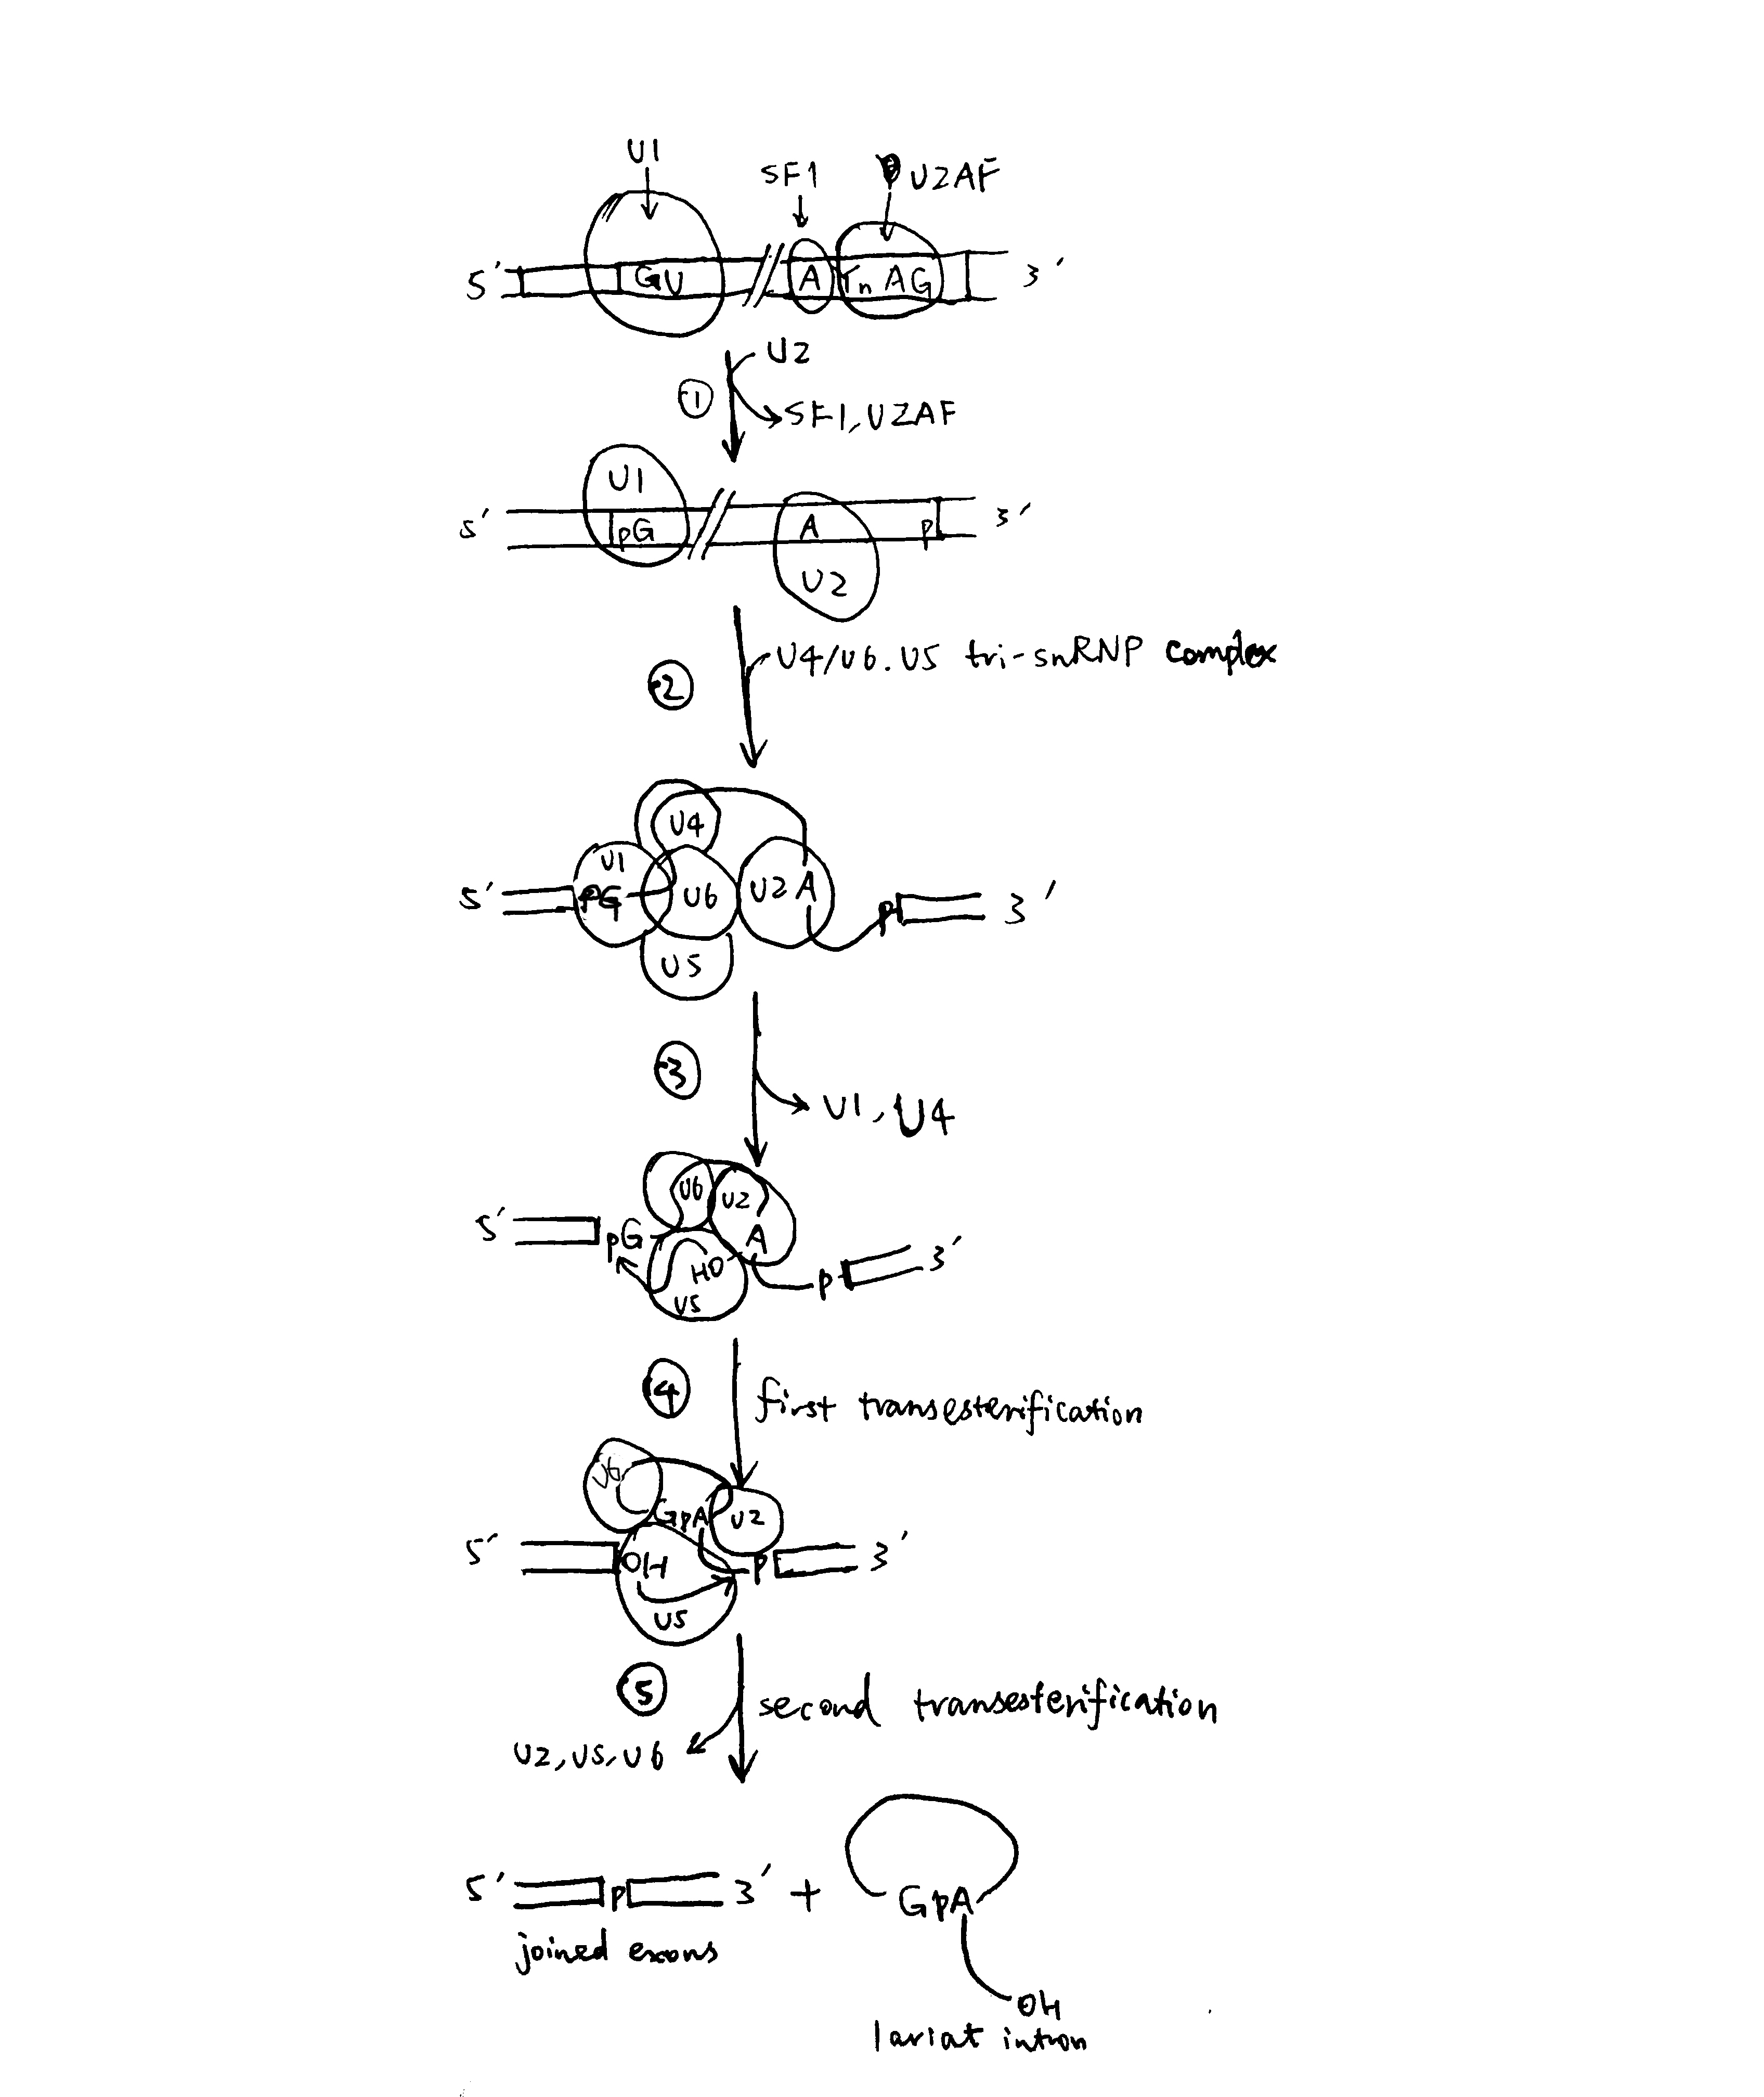
Figure 2: Spliceosome assembly and the splicing process
- U1 base-pairs with the 5’ splice site; SF1 (splicing factor 1) binds to the branch-point A; U2AF (U2 auxilliary factor) associates with the polypyrimidine tract and 3’ splice site. Then, U2 replaces SF1 and U2AF.
- The U4/U6.U5 tri-snRNP complex joins, forming the spliceosome
- Rearrangement of base-paring interactions leads to the catalytically active conformation. U6 dissociates from U4 and replaces U1. U4 is also released.
- The catalytic core of U6/U2 catalyses the first transesterification reaction (ligating 5’ guanosine to the 2’ OH of the branch point adenosine)
- Further rearrangements take place, and the second transesterification reaction occurs (joining the two exons)
The two sequential transesterification reactions per se do not require energy input, as there is no net bond breaking (two phosphodiester bonds are hydrolysed and another two are formed), but ATP/GTP hydrolysis is used to drive structural transitions and as a ‘proofreading’ mechanism.
As shown in Figure 3, In the catalitically active state, U6 partially base-pairs with U2 and U6 forms an internal stem loop structure with three nucleotides coordinated to two Mg2+ ions. Mg2+ ions stabilise the transitions states of the two transesterification reactions and thus achieve catalysis. The key bases coordinated to Mg2+ are confirmed by substitution of oxygen for sulfur atoms at various locations.
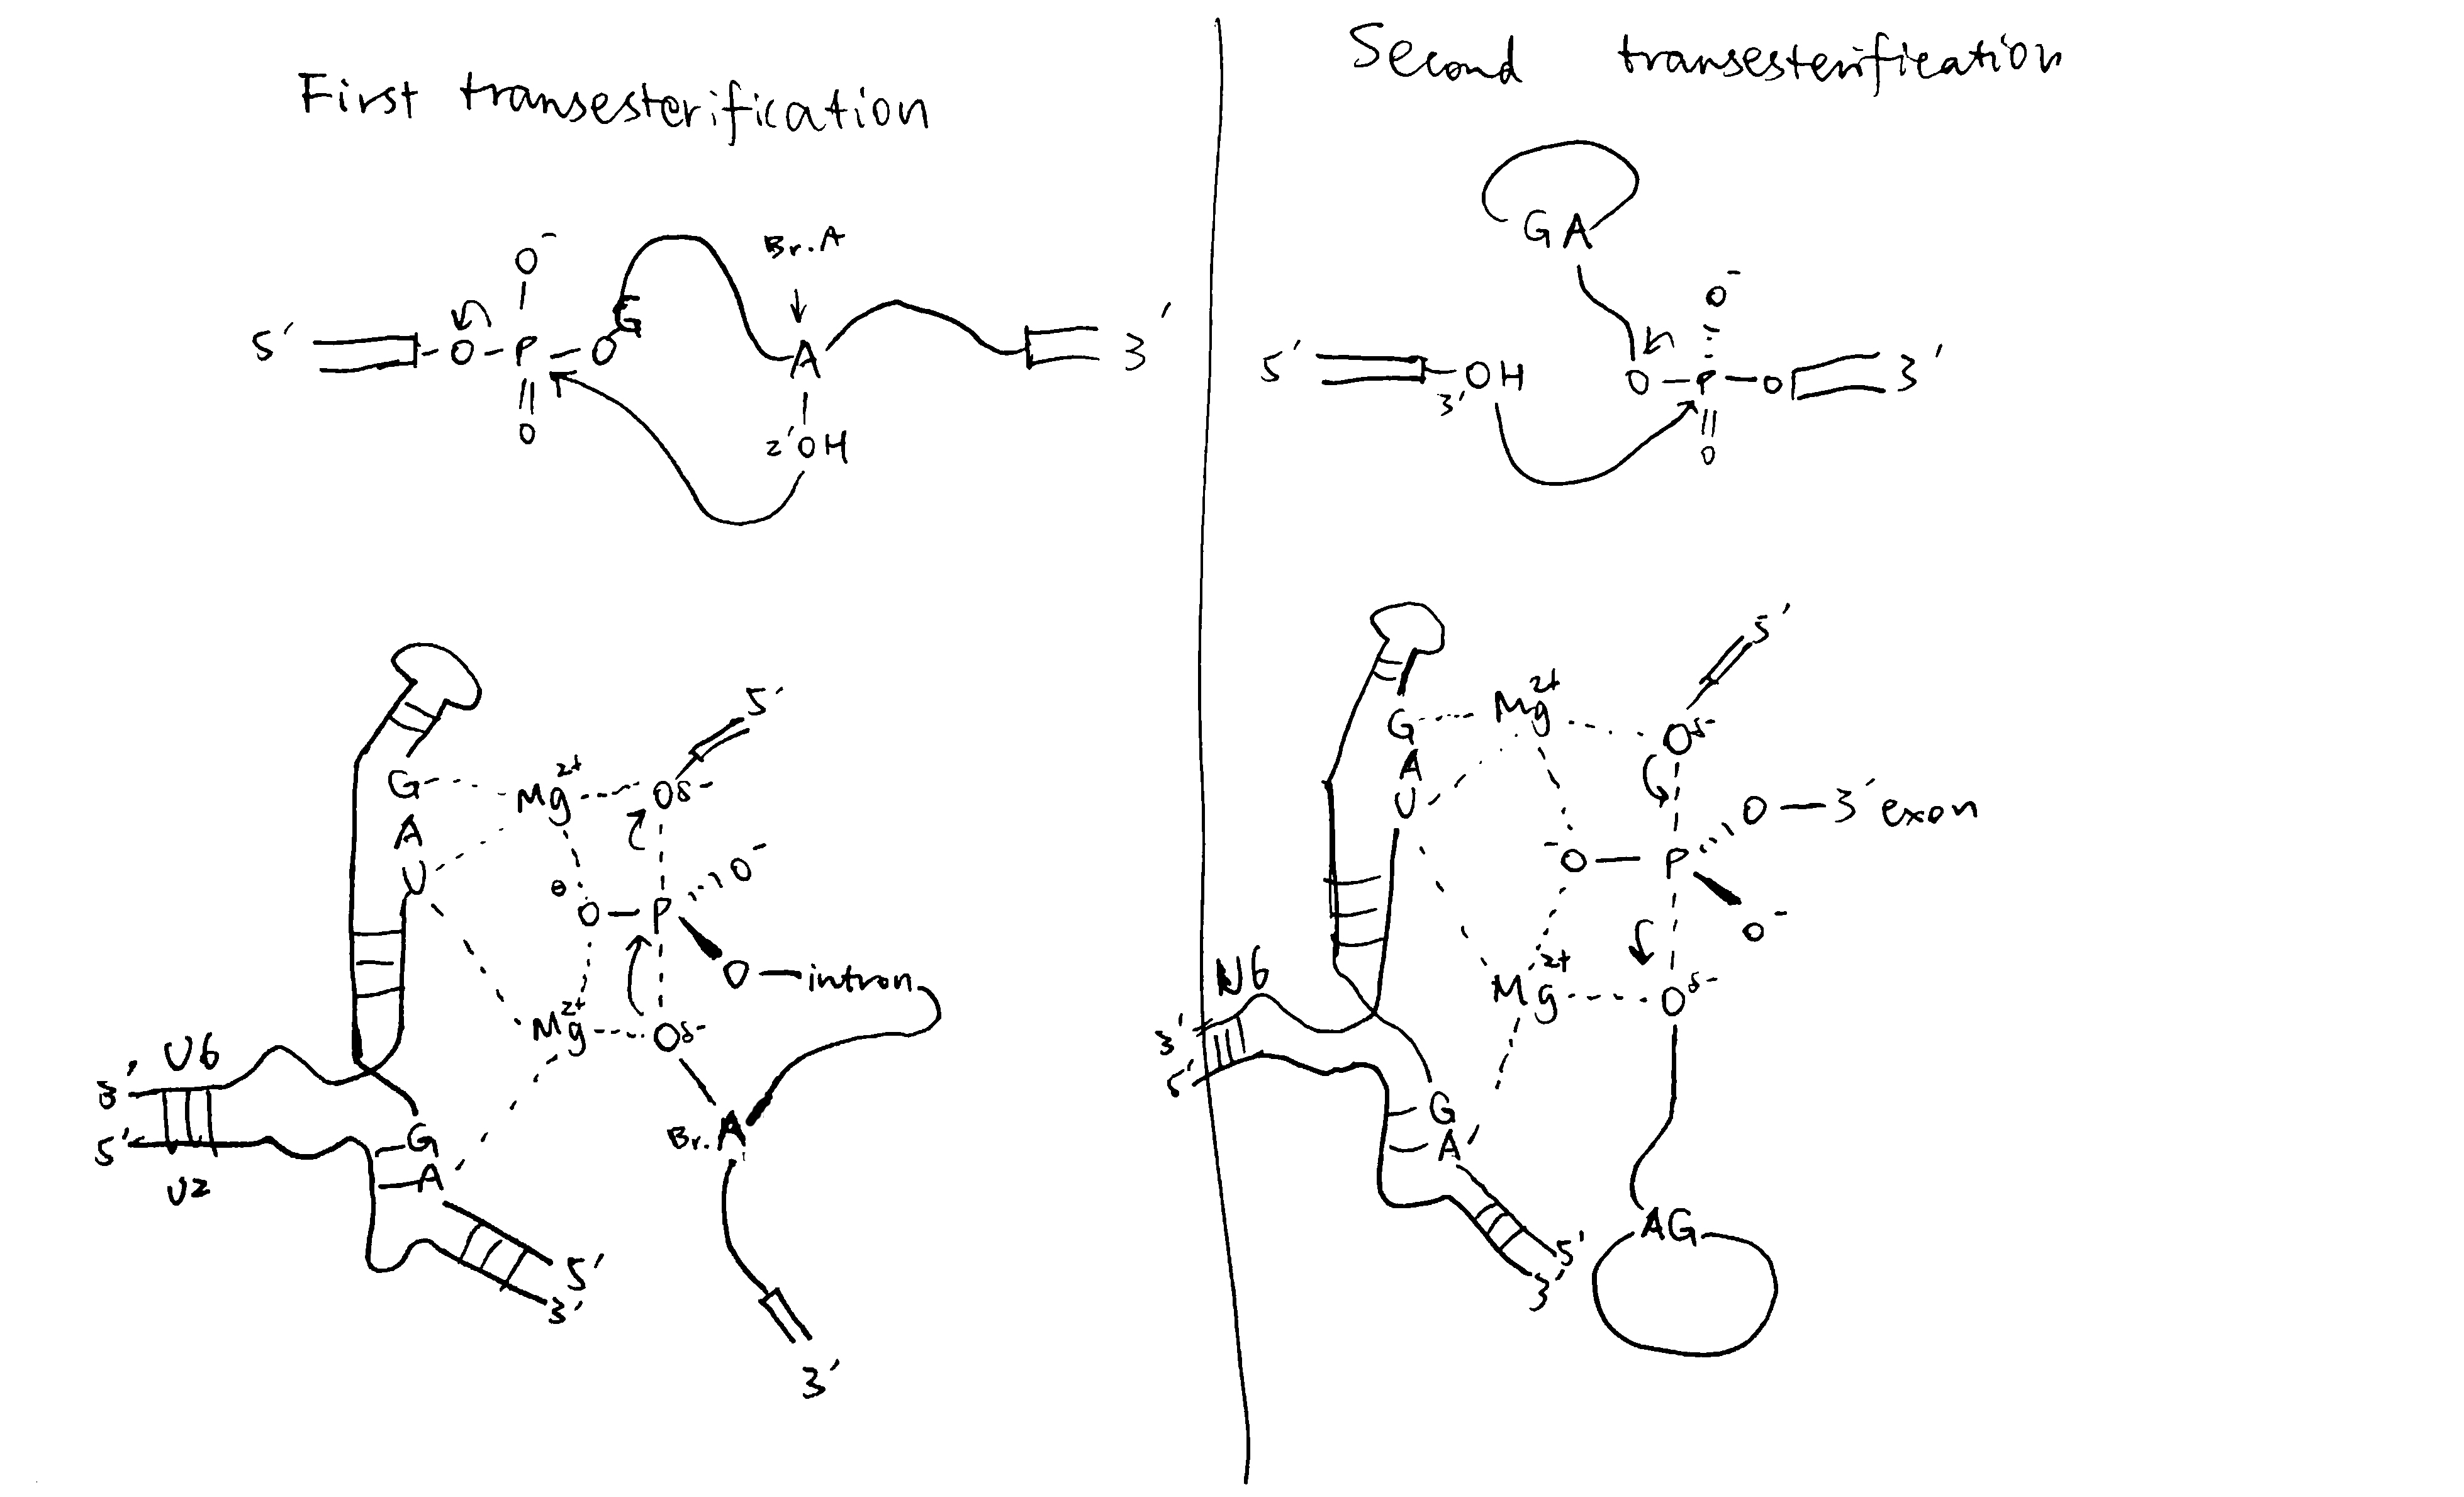
Figure 3: The transesterification reactions in detail
Alternative Splicing
pre-mRNAs contain cis-acting regulatory sequences (either splicing enhancers or silencers) to which splicing factors can bind and thus regulate splicing (Figure 4). RNA-RNA base pairing, which can occur either in cis or trans, can also specify splice site use.
RNA-binding proteins/RNPs that regulate splicing can be classified into 3 classes: the classical hnRNPs, serine-arginine repeat (SR) proteins, and tissue-specific RNA-binding proteins. Generally, hnRNPs inhibit splicing from nearby splice sites by interacting with splicing silencers while SR proteins promotes splicing by binding to enhancers.
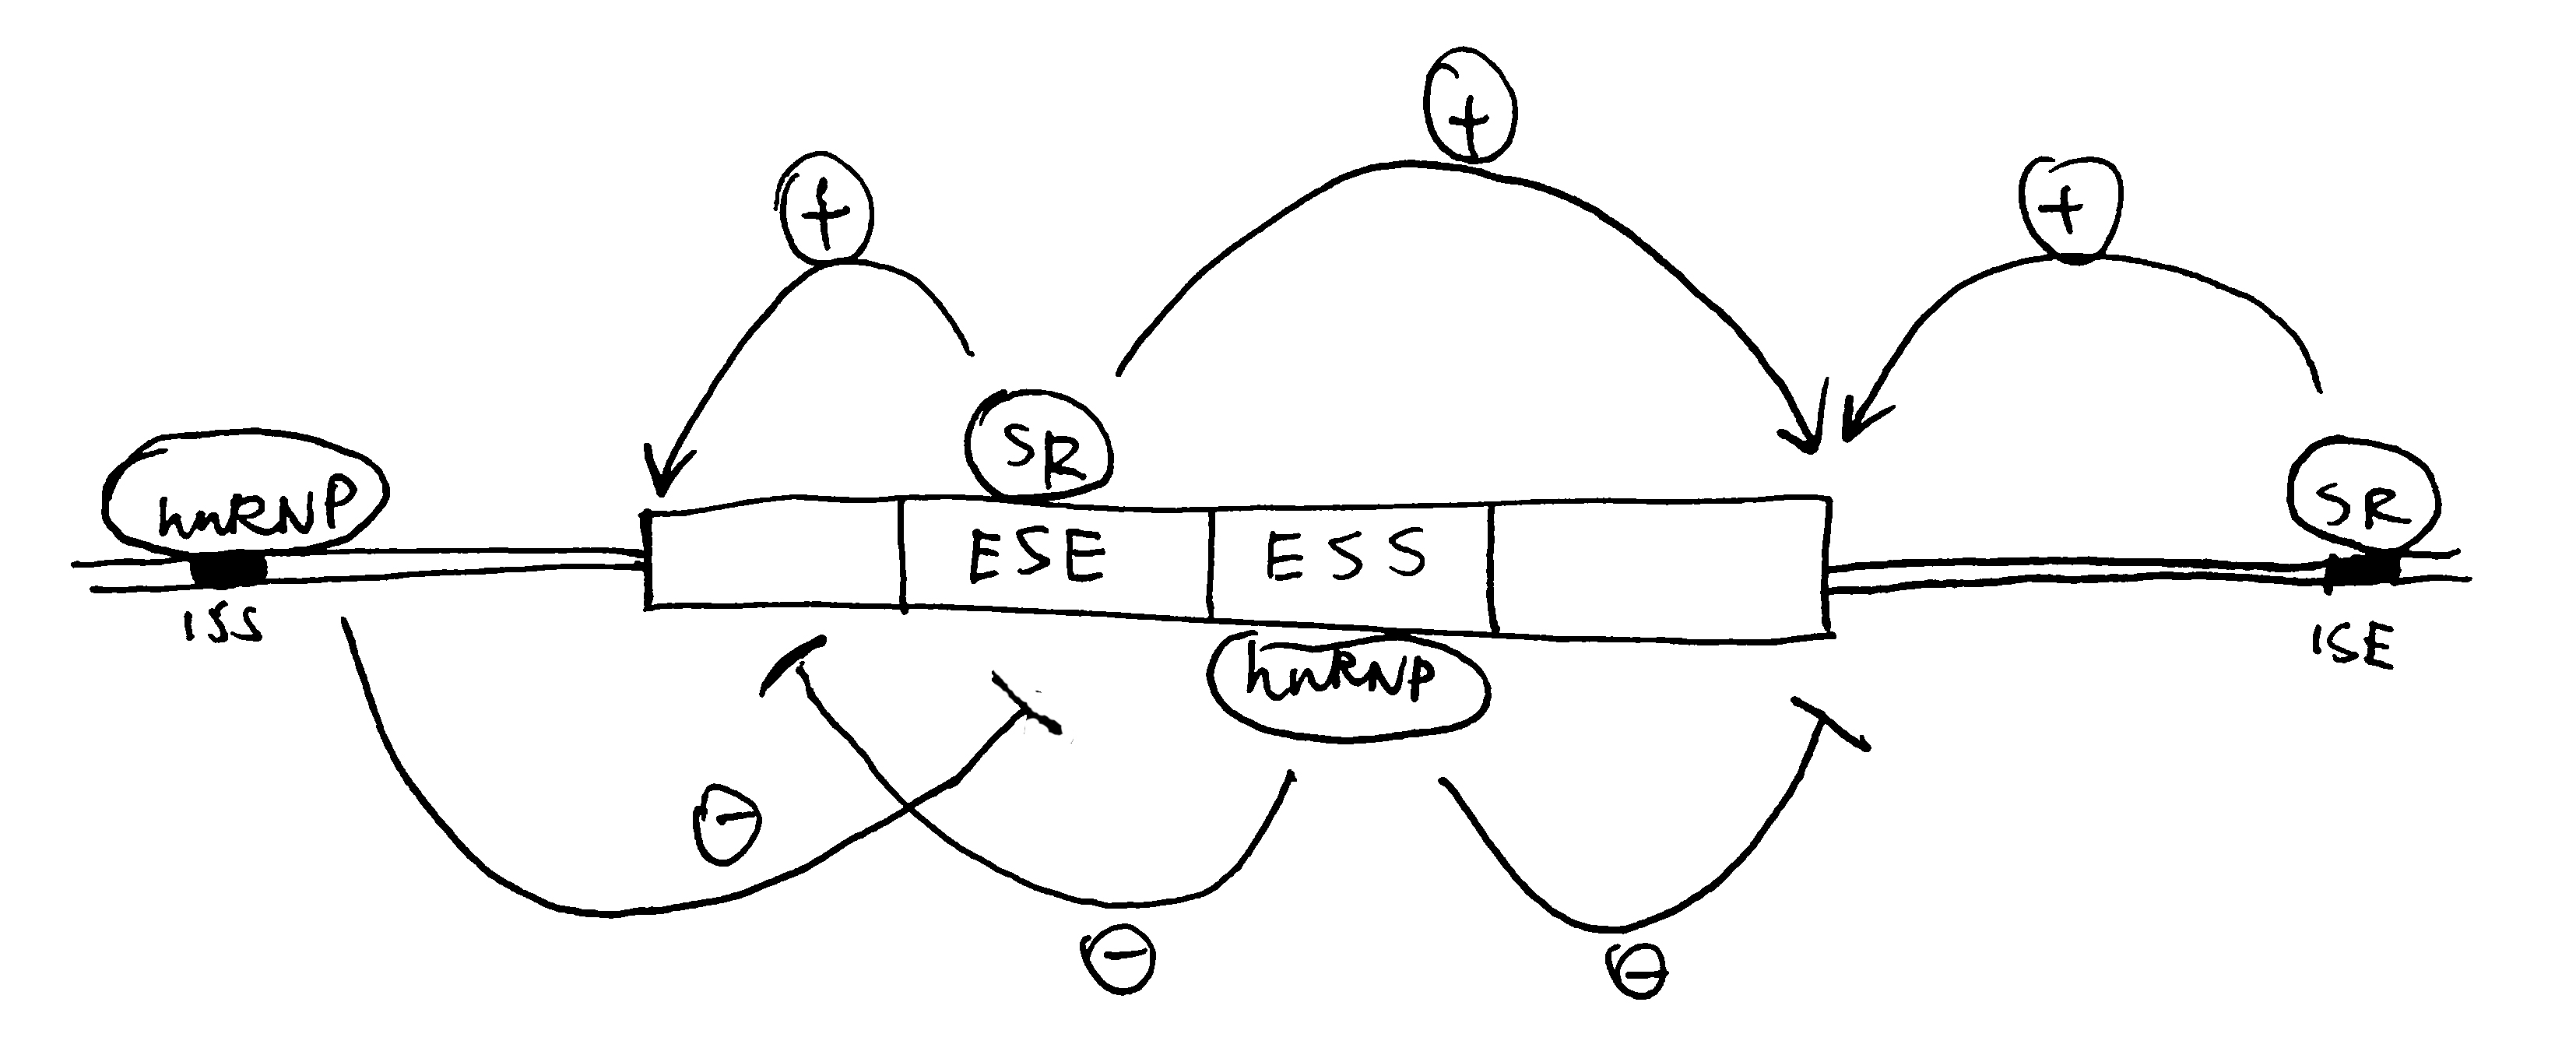
Figure 4: Splicing control by cis-regulatory sequences. ISE/ESE, intronic/exonic splicing enhancers; ISS/ESS, intronic/exonic splicing silencers.
RNA-RNA recognition can also control splice site choice, as exemplified by the exon 6 cluster of the Drosophila DSCAM gene, as shown in Figure 5.
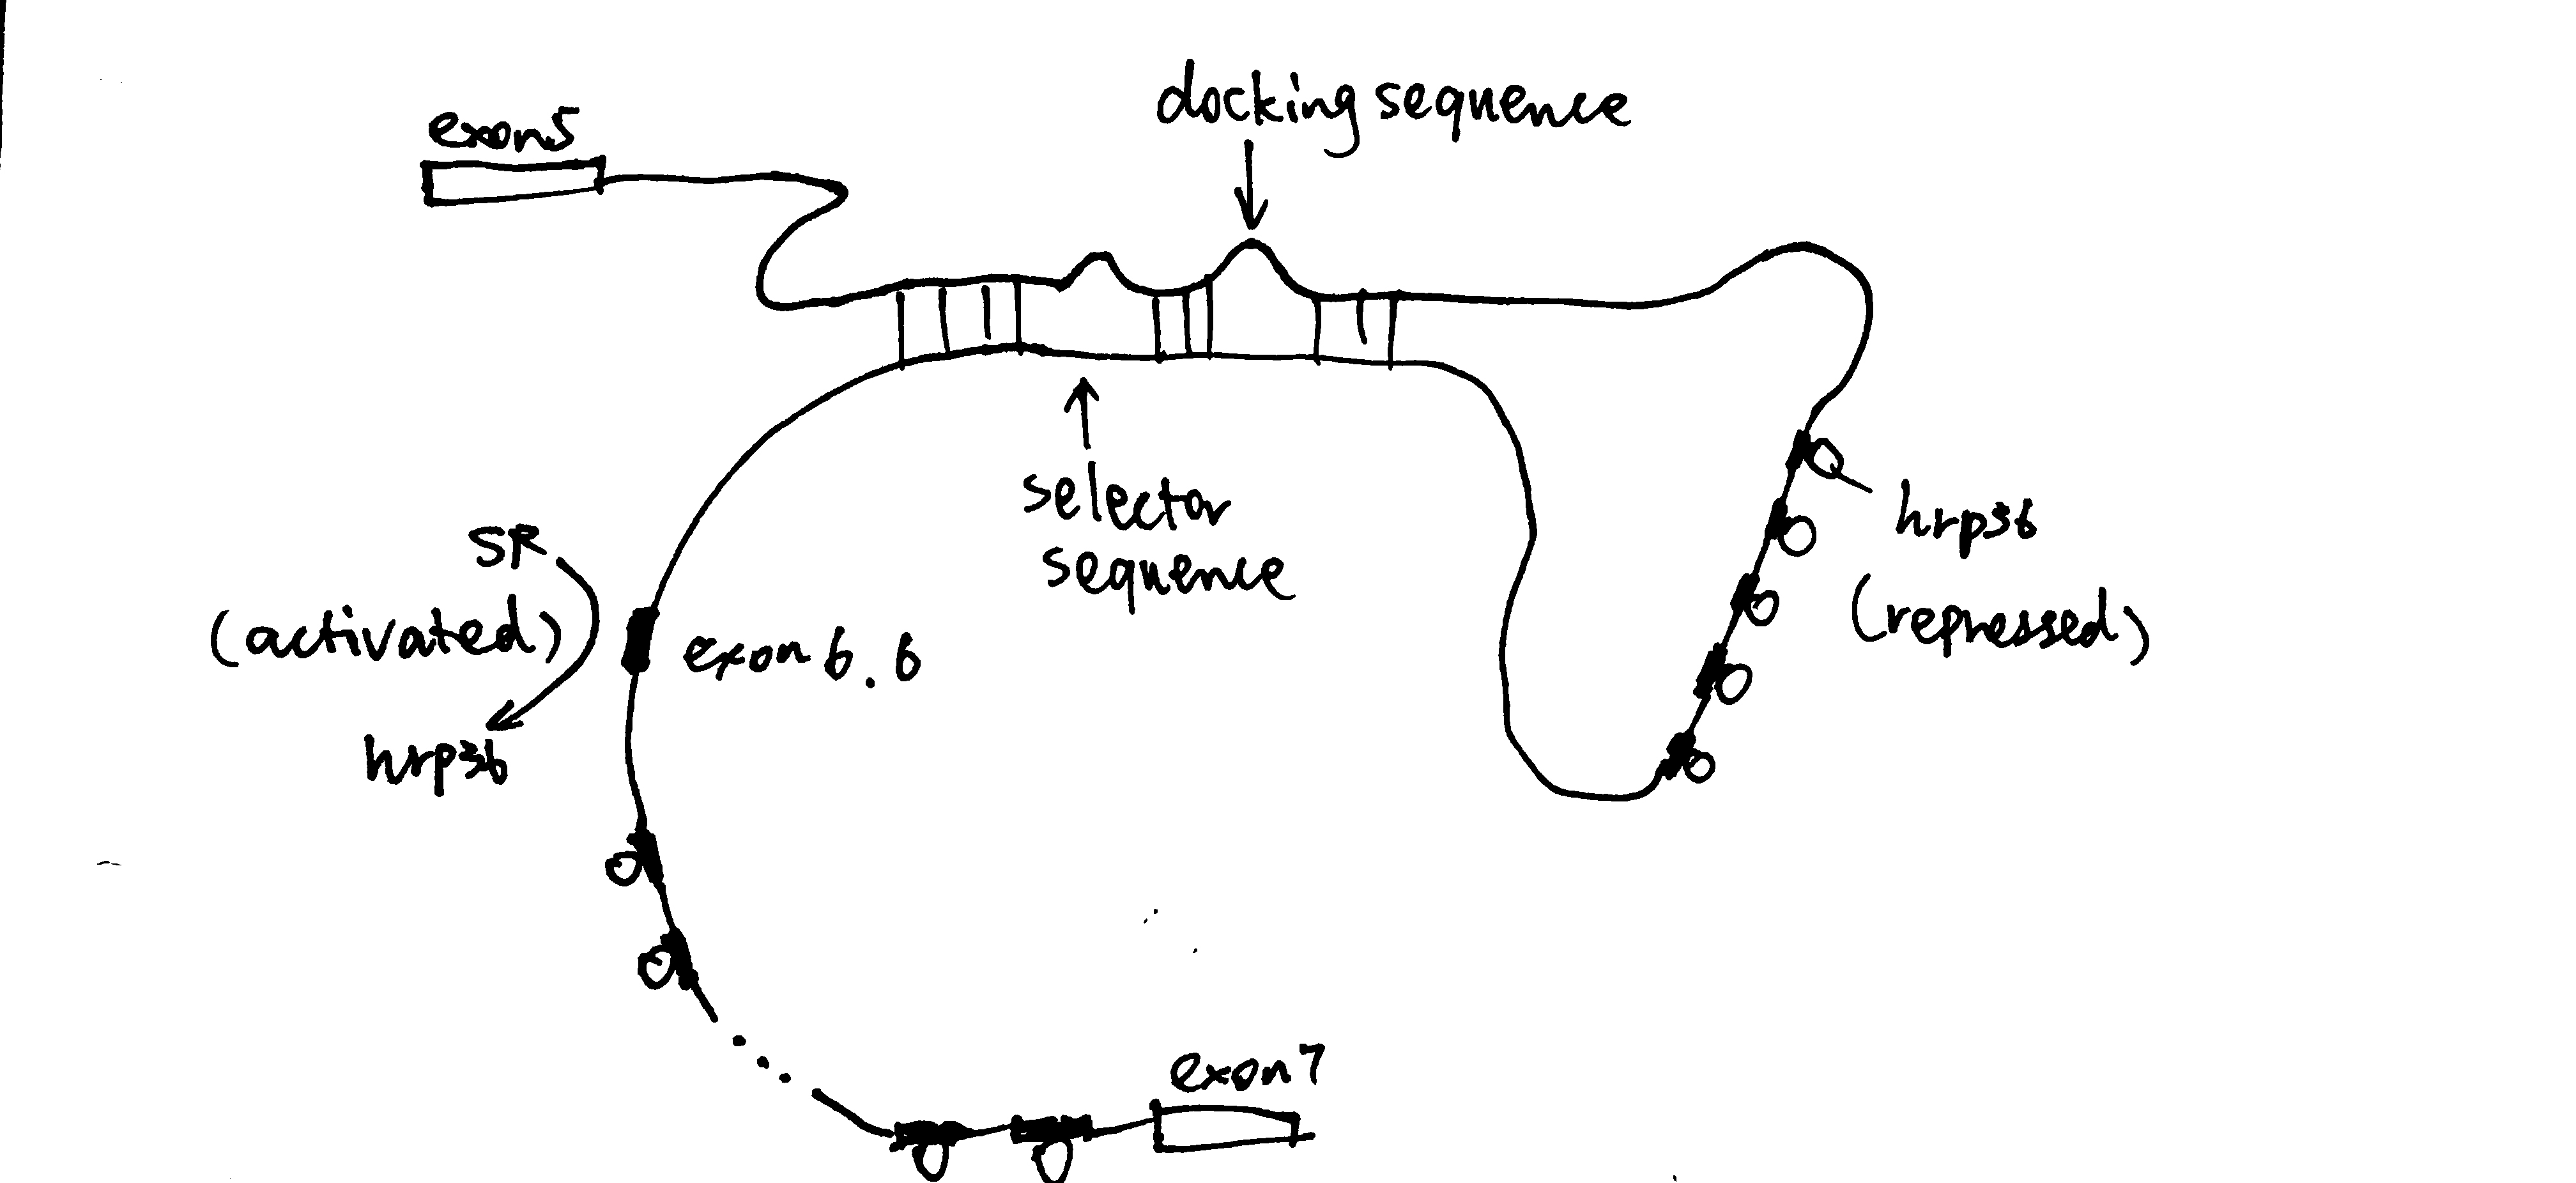
Figure 5: hrp36 binds to all axon6 variants and represses their inclusion in the mature mRNA. When the cis-acting RNA selector sequence upstream of a specific exon (in this case 6.6) pairs with the docking site, it results in activation of the exon immediately downstream.
SAQ
Write brief notes on the chemical shift, the nuclear Overhauser enhancement effect (NOE), the relaxation times T1 and T2, and the spin-spin coupling constant (J) with an emphasis on how these can provide information about the structure and dynamics of biological molecules.
- Chemical Shift: NMR applies RF wave to induce resonance with the precession frequency, \(\omega=\gamma (B_0-B_S)\), where \(B_0\) is the constant magnetic field strength on the \(z\) axis, \(B_S\) is the magnetic field strength shilded by electrons around the nucleus and \(\gamma\) is the magnetogyric ratio (depending of the identity of the nucleus). Nuclei in different chemical environment have different \(B_S\) and thus different \(\omega\), and the chemical shift, \(\delta\), is defined as \[\delta=\dfrac{\nu - \nu_\text{reference}}{\nu_\text{o}}\times10^6\] When a protein is folded, the chemical environment of protons is highly variable and the NMR signal is noisy and has many peaks. In contrast, when a protein is unfolded, the chemical shift tend to be less variable, and fewer peaks with greater intensities are observed.
- NOE: When two nuclei are close (< 5-6 angstroms) to each other, selective irradiation of one spin by \(B_1\) field causes intensity changes of the other spin. Two dimensional methods detect NOE more easily. NOE is the main source of information for macromolecular structure determination by NMR.
- T1 & T2 relaxation: The applied RF wave creates \(B_1\) field which transiently reorient the net magnetisation, \(M\). The decay rate of \(M_{xy}\propto\dfrac{1}{\text{T}_2}\); decay rate of \(M_z\propto\dfrac{1}{\text{T}_1}\). T1 relaxation is along the \(B_0\) field (longitudinal) and T2 relaxation is in the \(xy\) plane (transverse). Relaxation rates give information about molecular dynamics and distances. T2 can be measured from the decay rate of the FID and linewidths and T1 can be measured by an inversion-recovery experiment.
- Spin-spin coupling constant: The spin states of two protons on two covalently bonded atoms affect the nuclear energy levels of each other, so the peak split in a neighbour-dependent way (\(n\) adjacent protons give \(n+1\) multiplets). Coupling strength gives bond-angle information for biomolecules. For example, splitting of HN due to H\(^\alpha\) (\(^3J_{\text{NH}\alpha\text{CH}}\)) depends on \(\Phi\) angle.
Describe how NMR can be used to measure the pK values of ionizable groups in proteins. Why is chemical shift sensitive to ionization state? How can 31P NMR be used to measure intracellular pH? Over what pH range is this effective?
- The chemical shift a proton depends on its chemical environment, which includes the protonation state of adjacent acidic or basic sites. Therefore, gradual alteration of pH causes changes in the chemical shifts that can be plotted against pH. The p\(K_\text{a}\) is the pH that corresponds to the inflection point of the resulting sigmoidal curve.
- In vivo phosphate concentration is about constant. In pH range 5-8, the two dominant forms of phosphate, \(\text{H}_2\text{PO}_4^-\) and \(\text{HPO}_4^{2-}\) have different chemical shifts for 31P in NMR, so the chemical shift can be related to pH: at higher pH, the \(\text{HPO}_4^{2-}\) form is dominant, and its phosphate is more deshielded, leading to larger chemical shift
How does multidimensional NMR differ from basic 1-D NMR? What type of information is contained in the 2-D NMR experiments known as NOESY, TOCSY and HSQC?
As shown in Figure 1:
- The 1D spectrum is obtained by Fourier transformation of a single transient decaying signal. By collecting a series of transients separated by incrementing lengths of ‘evolution time’, \(t_1\), a 2D spectrum can be obtained. Similarly, 3D spectra are made with an additional period of ‘evolution time’, \(t_2\). Multidimensional NMR clearly shows connections (either J-coupling or NOE) between nuclei as ‘cross peaks’.
- COSY (correlated spectroscopy) spectra detect through-bond correlations (J-couplings)
- NOESY spectra has an extra 90\(^\circ\) pulse and a fixed delay, \(\tau_m\) inserted in the sequence and this allows detection of nuclear Overhauster effect (NOE).
- HSQC (heteronuclear single quantum coherence spectroscopy) gives a 2D spectrum with one axis for 1H and another for a heteroatom (usually 15N or 13C).

Figure 1: Schematic of 1D, 2D and 3D NMR, and sample
Outline the application of NMR spectroscopy to the determination of protein 3-D structure in solution. What are the advantages and disadvantages of this technique compared to X-ray crystallography?
- Application of NMR
- Experimental restraints: structure-related data derived from NMR spectra
- 1H-1H NOEs: each NOESY cross peak gives a specific pairwise distance information
- coupling constants \(J\) values can help to determine some dihedral angles
- chimical shifts: can be used to search in the database
- residual dipolar coupling: gives information about the direction of specific groups with respect to B0; gives long-range order information which complements the short-range information given by NOEs.
- solvent H-exchange: slow H-D exchange suggests that the proton is in a defined region of secondary structure
- Calculation of structures is done by incorporating various experimental restraints into a molecular dynamics (MD) simulation protocol. MD calculates position and velocity of atoms in a series of small steps using Newtonian mechanics. Extra energy terms are added to take account of observed constraints
- Experimental restraints: structure-related data derived from NMR spectra
- Compared to X-ray crystallography:
- Disadvantages:
- NMR is relatively laborious and slow
- restricted to small proteins
- Advantages:
- No need for crystallization; only a pure solution is needed. Can be used on proteins that do not crystallize (e.g. those containing intrinsically unstructured regions)
- can be used to study dynamics
- site-specific info on ligand binding
- Disadvantages:
Essay
Describe methods to monitor protein-folding pathways during the formation of a globular protein from an extended chain. Place particular emphasis on the role of NMR but also show how other methods provide complementary information.
NMR
Protein folding is a multistep process that proceeds through intermediate states and studying these intermediates is difficult due to their transient nature, low populations under non-denaturing conditions, and difficulty of their isolation.
Over the past two decades, many NMR methods have been developed and some became invaluable tools in studying molecular details of protein folding. Tansverse relaxation optimized spectroscopy (TROSY) is the first method developed for probing of dynamics and interactions of large (up to 1MDa) protein assemblies. Relaxation dispersion (RD) and saturation transfer (ST) methods provide a detailed look into the pathways of biomolecular processes, allowing studies of transient intermediates during protein folding.
RD and ST methods allow studying the minor nonnative conformations during protein folding with short lifespans (often \(\mu\)s-ms). The two major types of RD experiments include (1) Carr-Purcell-Meiboom-Gill (CPMG) methods that exploit modulation of Rex by a sequence of evenly spaced refocusing pulses, and (2) rotating frame \(\text{R}_{1\rho}\) relaxation experiments that use modulation of Rex by an on- or off-resonance continuous wave (CW) RF field. The ST experiments exploit modulation of Rex by a weak RF field, and are conceptually similar to off-resonance \(\text{R}_{1\rho}\) measurements. Transient nonnative protein states can be studied by other NMR experiments, such as paramagnetic relaxation enhancement.
Dynamics of protein folding, on the time scale of seconds, can be studied by other methods. Changes in NMR spectra can be monitored in real-time. Logitudinal magnetization (ZZ) exchange experiments can probe interconversions between states with comparable populations. Hydrogen exchange measurements detect evanescent populations of disordered nonnative states transiently sampled by proteins under native-like conditions.
Other Methods
There are some methods that can assess the extent of folding qualitatively, but they do not give as much quantitative information as NMR does.
CD (Circular Dichroism)
Plane-polarized light is the sum of two circularly polarized beams, L and R, which are rotating in opposite directions. CD arises from differential absorption of L and R component beams in a smaple of chiral molecules. CD is detected by a double beam instrument with separate L and R paths (which are usually produced by high frequency modulation of a photoelastic modulator (PEM) device). The high intensity light source is produced by synchrotron.
The CD spectrum shows the variation of \(\Delta\epsilon\) (difference between the extinction coefficient of the L and R beams) with wavelength (\(\lambda\)). Because of the chiral nature of amino acids (except glycine), peptides are optically active. The CD spectra in the 170-250 nm region are distinct for proteins with different structure. Standard curves for different secondary structures (\(\alpha\)-helix, \(\beta\)-sheet, \(\beta\)-turn, and random coil) are available (Figure 2) and the proportion of different secondary structures of a protein is calculated by linear combination of the standard curves.

Figure 2: CD components and standard curves
DSC (Differential Scanning Calorimetry)
DSC determines the heat capacity (the difference between the heat capacity in the sample cell and in the reference cell), Cp, of a molecule in aqueous solution, as a function of temperature. This is done by increasing cell temperatures while keeping the two cells at the same temperature and recording the power supply throughout the experiment. The variation of \(C_\text{p}\) with temperature is plotted. On such a curve, there is a peak if the sample molecule undergoes state changes within the temperature (Figure 3). For a protein, the peak corresponds to the melting temperature, \(T_\text{m}\), which occurs when the concentrations of its native state ([N]) and the denatured state ([D]) are equal. Stabilization of protein, for example by altering the pH and forming complexes, increases \(T_\text{m}\)
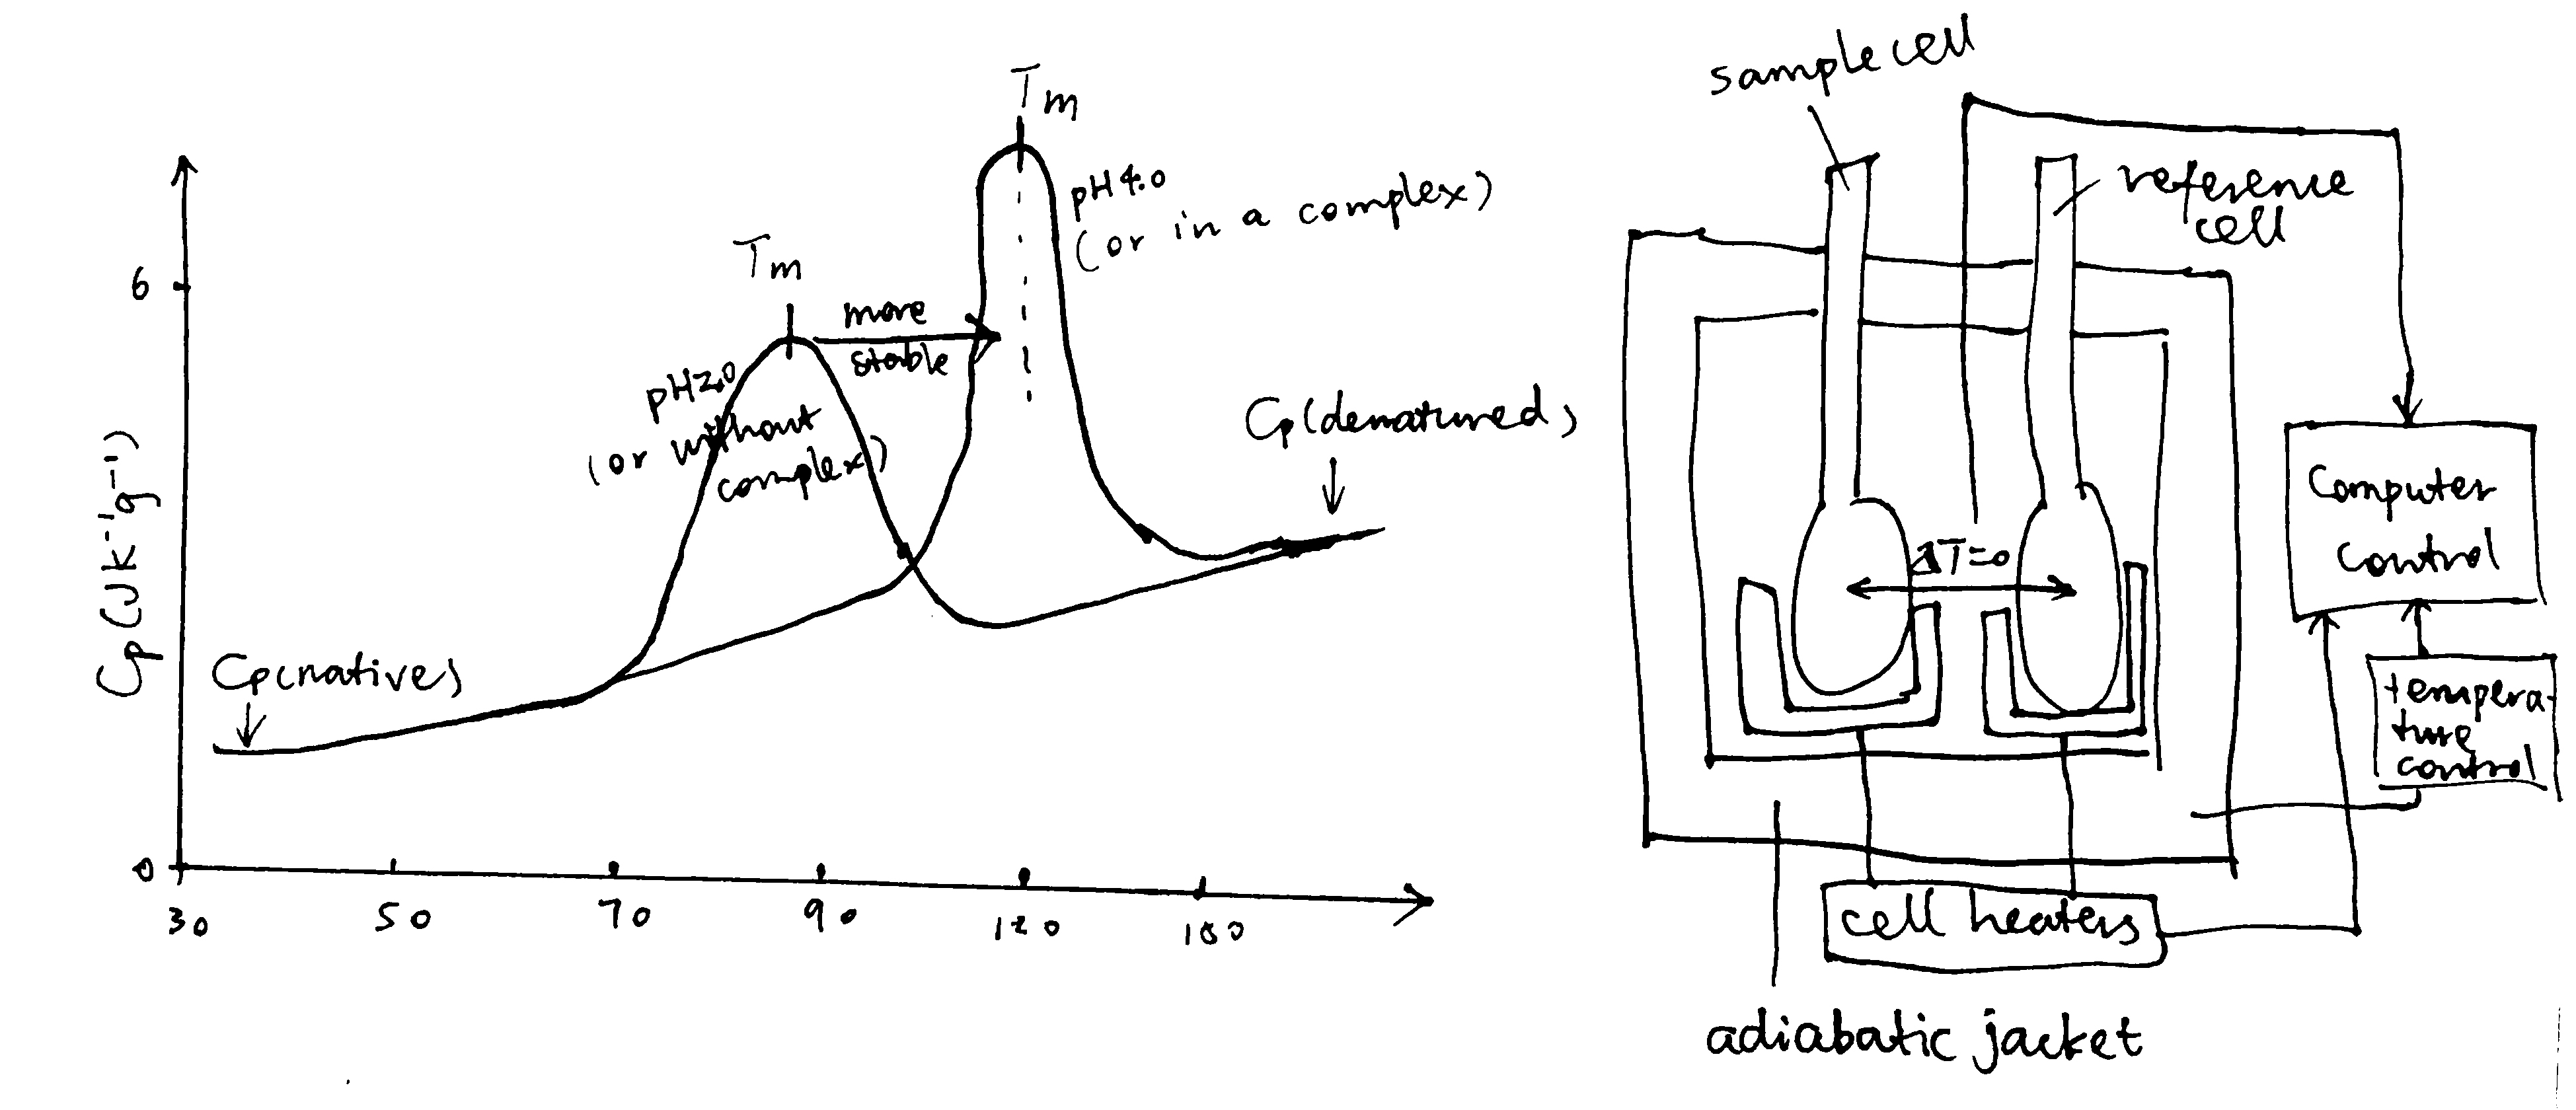
Figure 3: Principles of DSC
References
Campbell, Iain D. 2012. Biophysical Techniques. Oxford University Press.
Zhuravleva, Anastasia, and Dmitry M. Korzhnev. 2017. “Protein Folding by Nmr.” Progress in Nuclear Magnetic Resonance Spectroscopy 100: 52–77. https://doi.org/https://doi.org/10.1016/j.pnmrs.2016.10.002.
1 Confirmation of DNA Sequence
1.1 ESI-MS (Electrospray Ionization Mass Spectrometry)
In mass spectrometry, the analytes are first ionised in vacuum and these charged molecules are passed into a electric/magnetic field, and their path through the field can be used to deduce their mass/charge (m/z) ratio (using deflection, TOF, quadrupole, or other analyzers).
Traditional ionisation methods were not suitable for biological macromolecules because the need for heating (or other treatment) to achieve gas phase would cause rapid decomposition of the molecules. Later, MALDI (matrix-assisted laser desorption/ionisation) and ESI (Electrospray Ionization) techniques were deveoped and they are suitable for this purpose. In MALDI, proteins are placed in a light-absorbing matrix, then ionisation and desorption is triggered by a short pulse of laser light. In ESI, a solution of analytes is passed through a charged needle kept at a high electrical potential, dispersing the solution into a microdroplets. The solvent around macromolecules rapidly evaporates, leaving charged molecules in gas phase. ESI can directly accept inputs from many other purification methods such as SDS-PAGE and chromatography and in addition it is good for detecting native states and different conformations.
The sequence of a protein is often too long to be obtained by MS at one time, so protease can be used to break peptides into small fragments which are sequenced individually. In addition, tandem MS (MS/MS) is can be used, in which one peptide is first analysed by one mass analyzer (MS1), and then further fragmented by a ‘collision gas’ such as He and Ar, and the m/z ratios of these fragments are analysed by MS2. This produces a spectrum with many peaks (greater m/z correspond to longer fragments), and the successive peaks differ by the m/z of a particular amino acid in the original peptide. This information can be used to deduce the original sequence.
2 Assess Protein Folding and Solubility
2.1 CD (Circular Dichroism)
Plane-polarized light is the sum of two circularly polarized beams, L and R, which are rotating in opposite directions. CD arises from differential absorption of L and R component beams in a smaple of chiral molecules.
CD is detected by a double beam instrument with separate L and R paths (which are usually produced by high frequency modulation of a photoelastic modulator (PEM) device). The high intensity light source is produced by synchrotron.
The CD spectrum shows the variation of \(\Delta\epsilon\) (difference between the extinction coefficient of the L and R beams) with wavelength (\(\lambda\)).
Because of the chiral nature of amino acids (except glycine), peptides are optically active. The CD spectra in the 170-250 nm region are distinct for proteins with different structure. Standard curves for different secondary structures (\(\alpha\)-helix, \(\beta\)-sheet, \(\beta\)-turn, and random coil) are available (Figure 2.1) and the proportion of different secondary structures of a protein is calculated by linear combination of the standard curves.

Figure 2.1: CD components and standard curves
2.2 DSC (Differential Scanning Calorimetry)
DSC determines the heat capacity (the difference between the heat capacity in the sample cell and in the reference cell), Cp, of a molecule in aqueous solution, as a function of temperature. This is done by increasing cell temperatures while keeping the two cells at the same temperature and recording the power supply throughout the experiment. The variation of \(C_\text{p}\) with temperature is plotted. On such a curve, there is a peak if the sample molecule undergoes state changes within the temperature (Figure 2.2). For a protein, the peak corresponds to the melting temperature, \(T_\text{m}\), which occurs when the concentrations of its native state ([N]) and the denatured state ([D]) are equal. Stabilization of protein, for example by altering the pH and forming complexes, increases \(T_\text{m}\)

Figure 2.2: Principles of DSC
2.3 DLS (Dynamic Light Scattering)
Random motion of macromolecules in a suspension causes fluctuations in local concentration and thus local variarions in refractive index and intensity of the scattered light. These time-dependent fluctuations can be analyzed by a coherent laser source. The observed fluctuations give rise to diffusion coefficients, \(D\), which is related to the size of the molecules (large particles diffuse more slowly). DSL can measure polydispersity and the presence of aggregates in protein samples.
2.4 AUC (Analytical Ultracentrifuge)
An AUC is a specialised ultracentrifuge equipped with absorbance and interference detection systems. Each cell contains a sample meniscus and a reference cavity, allowing the absorbance of the solvent to be corrected.
Two types of experiments are typically performed by AUC: sedimentation velocity and sedimentation equilibrium. Sedimentation velocity is performed at high speed, which depletes particles from the centrifuge cell and creates a pellet at the bottom of the cell. It can give information on molecular shape, mass, and interactions with themselves and with other components.
Sedimentation equilibrium is perfomed at low speed and does not create a pellet, and the sedimentation of molecules down the centrifuge cell is balanced by their diffusion back up the cell. The main application of sedimentation equilibrium is the detection of complexes and self-association and the quantification of binding between species
3 Determining Kd
3.1 Fluorimetry/Fluorescence anisotropy
If fluorophores are excited with plane polarized light and the fluorescence is observed through analyzing polarizers, the fluorescence is also polarised.
The fluorescence anisotropy is defined as \(A=\dfrac{I_\parallel - I_\bot}{I_\parallel+2_{\bot}}\), where \(I_\parallel\) and \(I_{\bot}\) are the fluorescence intensities polarised parallel and perpendicular to the direction of the excitation beam. \(A\) is a direct measure of the molecular rotation in solution and can be used to study complex formation, as a macromolecule will rotate more slowly when it is in a complex thatn when it is alone.
3.2 Surface Plasmon resonance
Surface plasmon resonance (SPR) is used for measuring molecular interactions between a pair of molecules.
A surface plasmon is an electron oscillation generated at a surface interface between a metal and a dielectric. A plasmon resonance occurs when EM wave in visible light couples optimally with the oscillating electrons in the metal, and this results in a maximal reduction in the reflected light intensity. The resonance angle, \(\theta_\text{spr}\), is found by changing the angle of incidence of the light beam, giving a dip in a plot of intensity against angle. \(\Delta\theta_\text{spr}\) is sensitive to changes in the refractive index of the medium near the metal surface and this is a measure of the mass change at the sensor surface (in the evanescent region).
In an SPR experiment, one type of ligand is immobilised at the sensor surface, and a the analyte is passed through the cell. If the ligand binds to any binding partner in the analyte, \(\Delta\theta_\text{spr}\) would increase. Then, non-specific binding is washed off by buffer, and \(\Delta\theta_\text{spr}\) would decrease and \(\Delta\theta_\text{spr}\) due to specific binding can be found. Finally, regeneration solution is applied to remove all binding and reset \(\Delta\theta_\text{spr}\) to zero. (Figure 3.1)

Figure 3.1: Principles of SPR
SPR can be used to determine \(K_d\) of complex formation, which equals \(\dfrac{k_{-1}}{k_1}\) where \(k_1\) is the rate of association and \(k_{-1}\) is the rate of dissociation. \(k_1\) and \(k_{-1}\) can be deduced from the plot.
3.3 Isothermal titration calorimetry (ITC)
ITC measures heat changes when a complex is formed at constant temperature.
In ITC, an insulated reaction cell containing protein is kept at a temperature (usually 8\(^\circ\text{C}\) above the environment) which is equal to the temperature of a reference cell, and the reference cell is kept at a constant temperature by a thermostat. Then, increasing amounts of ligand is added into the chamber, and they form complexes with the protein, which can be exothermic or endothermic. The heat change is compensated by a power supply, which can be converted to \(\Delta H\) of the reaction. As more ligands are added, proteins become saturated and \(\Delta H\) approaches zero. The raw data obtained (power supplied to compensate the heat change caused by each addition of ligands) can be integrated and corrected to give a plot of \(\Delta H\) against the molar ratio of the ligand and the protein, and \(\Delta H\), Kd and stoichiometry can be inferred from the curve. Subsequently, \(\Delta G\) and \(\Delta S\) can also be calculated (Figure 3.2).

Figure 3.2: ITC data manipulation
3.4 MST (Microscale Thermophoresis)
MST is a relatively new method for analysing interactions of proteins or small molecules in complex bioliquids such as blood serum or cell lysate. The technique depends on the phenomenon that molecules move within temperature gradients (thermophoresis).
The instrument uses an IR laser to create a temperature gradient, and the movement of the molecules within this gradient is monitored by fluoresence. The fluoresence can either be intrinsic (due to tryptophan) or extrinsic (attached dye or fluorescent protein).
Compared with traditional methods for studying protein interactions, MST has several advantages:
- A minuscule amount of sample (a few \(\mu\)l) is needed,
- no limitations on size and affinity
- no limitations on buffer; tolerates impurity; can be used in in complex bioliquids such as blood serum or cell lysate
- no need for immobilization

Figure 3.3: Sample data produced by MST
References
Wienken, Christoph J., Philipp Baaske, Ulrich Rothbauer, Dieter Braun, and Stefan Duhr. 2010. “Protein-Binding Assays in Biological Liquids Using Microscale Thermophoresis.” Nature Communications 1 (1): 100. https://doi.org/10.1038/ncomms1093.
Alzheimer’s Disease
Effect of AMPK on secreted A\(\beta\) levels in neuronal cultures
- In ELISA (enzyme-linked immunosorbant assay), antibodies are used to bind an antigen of interest (usually protein) with high specificity, and the presence and concentration of the antigen is reported by the extent of reaction of the enzyme conjugated with the antibody. Using two types of antibodies binding to different regions of the antigen allows sandwich ELISA (see below), which has greater specificity. Horseradish peroxidase converts its substrate to a coloured product, and the intensity of the colour, which is related to the concentration of A\(\beta\) peptide (the antigen), can be measured by a spectrophotometer as absorbance of EM wave at a certain visible wavelength (the relationship is not always linear so a calibration is needed).

- By plotting ‘measured value’ against the number of dilution (the power to which \(\frac{1}{2}\) is raised), it can be shown that the realtionship between them is roughly linear when measured value is around 100.
standard <- c(206, 215, 201, 199, 205, 197, 199, 202, 190, 120, 67, 41, 27, 13, 8, 8)
untreated <- c(211, 197, 200, 202, 198, 195, 197, 164, 88, 47, 27, 15, 6, 9, 7, 7)
AICAR <- c(207, 202, 205, 199, 189, 200, 183, 101, 58, 30, 18, 12, 7, 7, 8, 6)
pow <- 0:15

df <- tibble(pow, standard, untreated, AICAR)
df %>% gather(standard, untreated, AICAR, key = 'treatment', value = 'measured value') %>%
  ggplot(aes(pow, `measured value`, color = treatment, shape = treatment, linetype=treatment))+
  geom_point()+xlab('number of dilution (i.e. number of times the concentration is halved)')+
  geom_smooth(se=FALSE, method='loess', span=0.4, size=0.5)+
  geom_hline(yintercept = 100)+
  scale_x_continuous(breaks = 0:15)
## `geom_smooth()` using formula 'y ~ x'
Reading off from the plot:
- for the standard solution, a \(\dfrac{1}{2^{9.5}}\) dilution corresponds to 100 units. Thus, 100 units correspond to \(10\times \dfrac{1}{2^{9.5}}=0.01381\text{ ng/ml}\)
- for the untreated sample, a \(\dfrac{1}{2^{7.9}}\) dilution corresponds to 100 units, or \(0.0138\text{ ng/ml}\), so the undiluted sample has a A\(\beta\) concentration of \(0.01381\times2^{7.9}=3.299\text{ ng/ml}\). The volume of 106 cells is 100\(\mu\)l, so the level of secretion is \(3.299\times0.100\times 1000=329\text{ pg/10}^6\text{ cells/day}\)
- for the sample with AICAR, the undiluted sample has a A\(\beta\) concentration of \(0.01381\times2^{7.2}=2.031\text{ ng/ml}\). The level of secretion is \(2.031\times0.100\times 1000=203\text{ pg/10}^6\text{ cells/day}\)
- Upon activation by AICAR, AMPK reduces secretion of A\(\beta\)
Effect of added A\(\beta\) on AMPK activity
Triton X-100 is a detegent, disrupting the cell membrane and lysing the cell; PMSF inhibits serine proteases, preventing degradation of target protein; protein A, which is immobilised on sepharose, binds specifically to the Fc region of anti-AMPK antibody
This ensures that all measured enzymatic activity is due to AMPK but not other kinases that would be present in the whole cell extract.
- Substituting \(t_{\frac{1}{2}}=14\text{ days}\) and \(t = 14\) into \(A=A_0e^{-kt}=A_0e^{-\dfrac{\ln{2}t}{t_{\frac{1}{2}}}}=A_0\times(2)^{-\dfrac{t}{t_{\frac{1}{2}}}}\), \(A=A_0\times(2)^{-\frac{9}{14}}=0.6404A_0\), i.e. \(A_0=1.5614A\), where \(A_0\) is the original activity and \(A\) is the activity after 9 days. \[\begin{aligned}A_0 \text{ cpm}\div80\%\div(2.2\times10^{12})\text{ cpm/Ci}\div(0.5\times10^{-3})\text{ Ci/nmol}\div(50\times10^{-3}\text{ mg cell protein})\div20\text{ min}\div\frac{50}{50+5+5}\\=x \text{ nmol substrate phosphorylated/min/mg cell protein}\end{aligned}\] where x is the final answer. This simplifies to \[x=1.3636\times10^{-9}A_0=2.129\times10^{-9}A\]
- Activity (+A\(\beta\)): \(2.129\times10^{-9}\times(11800-278)=2.45\times10^{-5} \text{ nmol substrate phosphorylated/min/mg cell protein}\)
- Activity (no A\(\beta\)): \(2.129\times10^{-9}\times(2940-278)=5.67\times10^{-6} \text{ nmol substrate phosphorylated/min/mg cell protein}\)
AMPK activity increases as A\(\beta\) is added, and AMPK may help to degrade A\(\beta\) according to (c).
Association of \(\tau\) protein with microtubules
- tau alone is soluble and exists solely in the supernatant. Unphosphorylated tau binds to microtubules strongly and exists entirely in the pallet (insoluble). Phosphorylated tau has less affinity to microtubules and most of them are found in the supernatant.
Phosphorylation sites on tau
- Induce mutations on different positions and observe their effect on phosphorylation. The mutated position(s) can be determined by DNA sequencing and the effect of phosphorylation can be determined by isoelectric focusing (phosphorylated protein has a more negative charge).
- Fragment the protein and test each piece for phosphorylation.
- These phosphorylation sites are all located on the MT binding domain (235-368) and thus phosphorylation can directly (at least sterically) hinder binding to MT. In addition, MT binding domain contains many postively charged lysine (K) residues and few negatively charged (D and E) residues. This suggest that the binding between tau and MT is electrostatic (+ve on tau, -ve on MT). Phosphorylation adds -ve charge on tau and thus hinders electrostatic binding.
Notch Receptor
The primer sequences are:
forward primer
5' GGATCC CAGGACGTGGATGAGTGCTCGCTGGG 3' # 33 nt
reverse primer
5' GGATCC TCA CTGGCACAGATGCCCAGTGAAGCCC 3' # 34 nt
To produce a standalone peptide, a start codon (ATG) and a stop codon (TGG) is needed. The stop codon is included in the reverse primer (
5'TCA3'which correspond to5'TGA3'in the forward direction). The start codon is defined in the plasmid and sets the reading frame. The restriction site chosen must ensure correct reading frame alignment of the gene of interest, and Bam HI does this job (while some others, such as Sal I, does not), so I chose it, and its sequence,GGATCC, is included at the 5’ end of both primers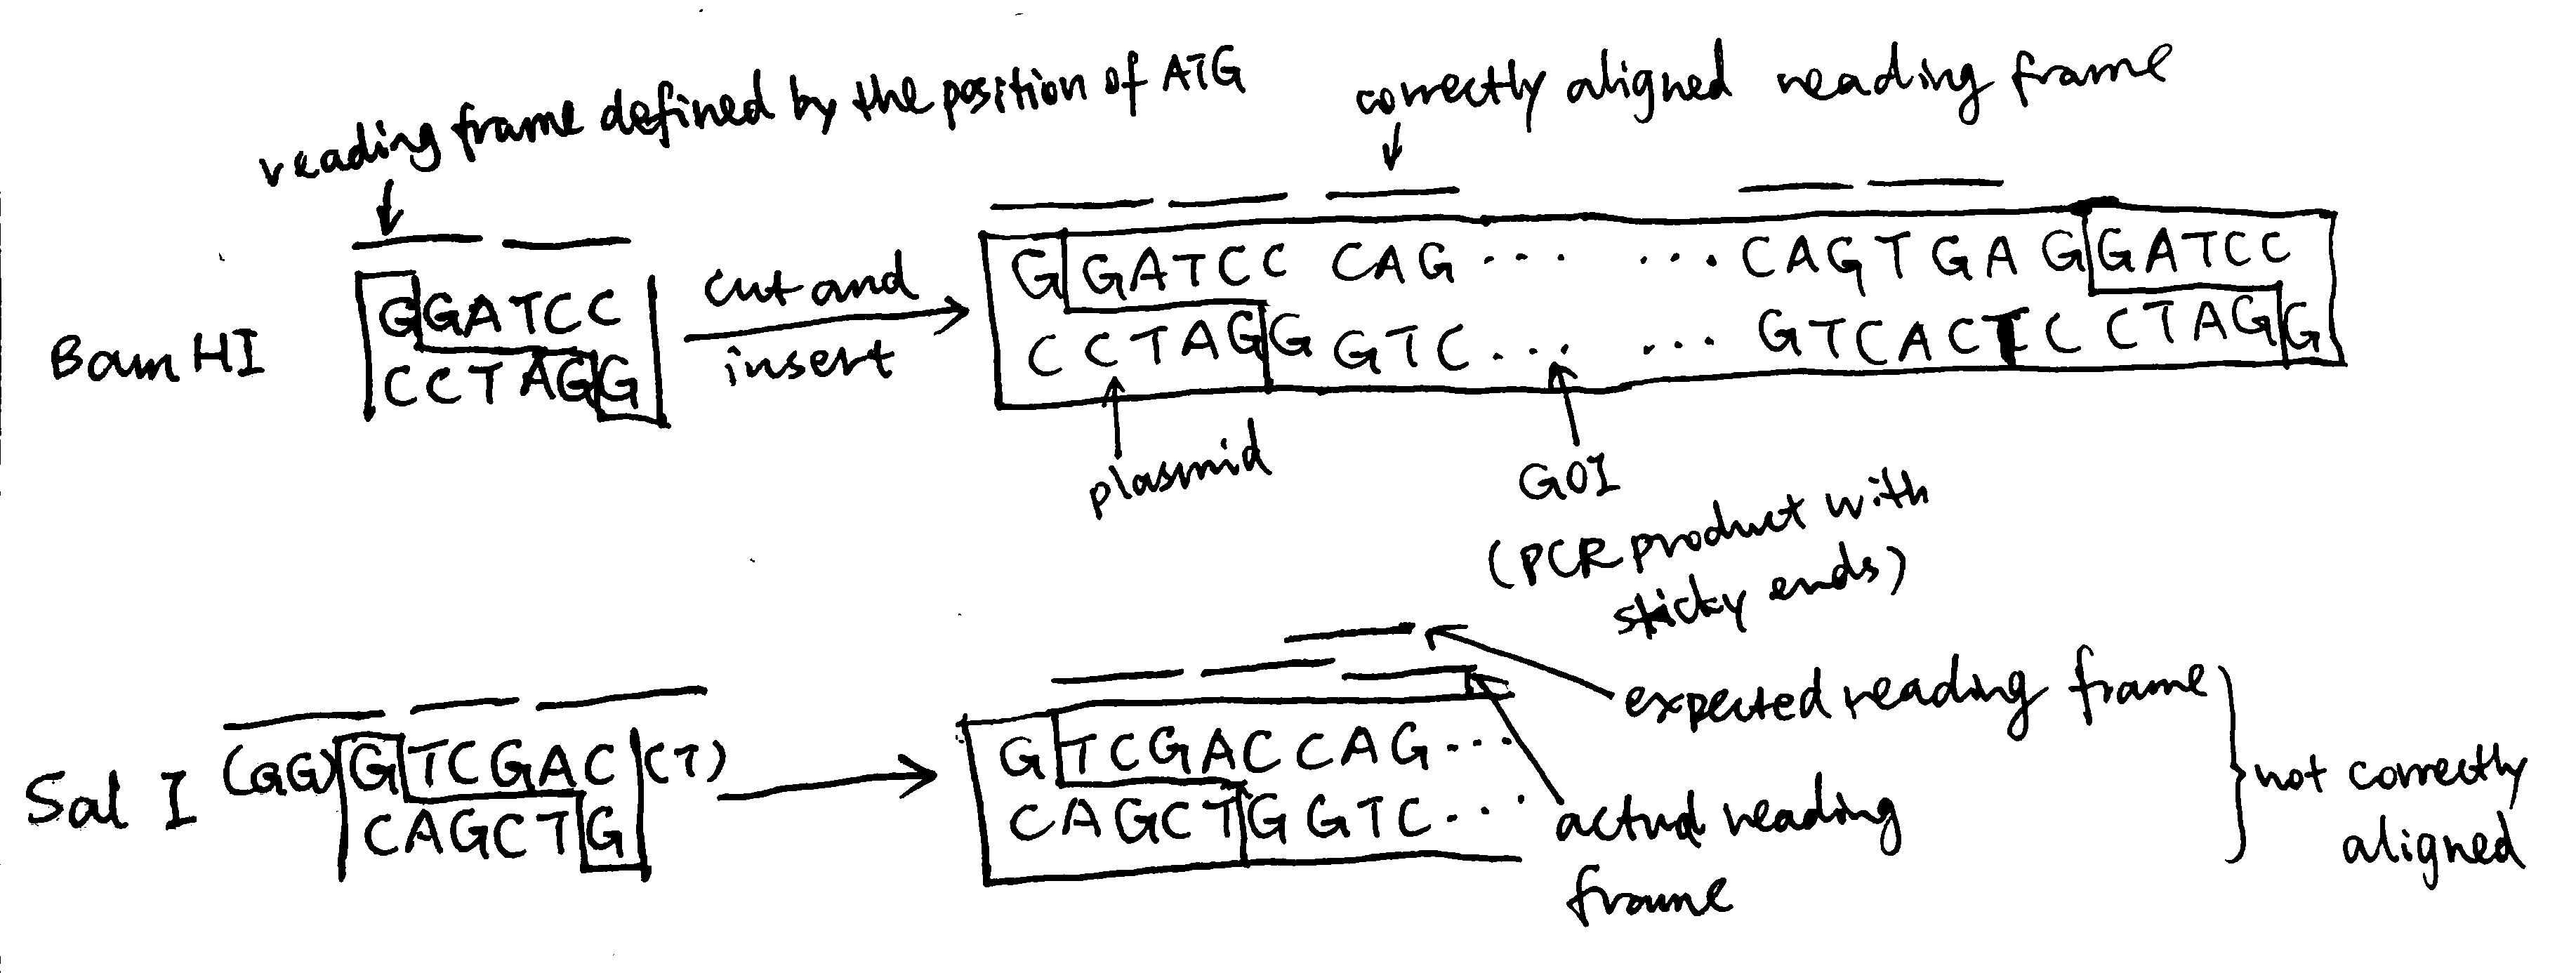 Regarding restriction sites, Pst I and Sph I must not be chosen because they are contained within the gene of interest and applying these restriction enzymes will break the gene. The remaining part of the primer corresponds to the gene of interest, and the 3’ ends are chosen to include 3-4 consecutive G/C to ensure high annealing stability, facilitating DNA polymerase binding.
Bam HI is applied both to the plasmid and the PCR product, creating sticky ends and allowing them to join. The resulting set of plasmids (some are recombinant and some are not) are transformed into bacteria by heat shock (by disrupting the cell membrane using CaCl2 and exposing cells to thermal imbalance) or electroporation (by using short pulses of high-voltage electric currents). Ampicilin is added to kill cells without gaining the plasmid, and after that, usually (when a lacZ\(\alpha\) gene is incorporated into the cloning site in the reverse direction) X-gal is used to test whether the cells with plasmids contains the gene of interest (blue-white screening).
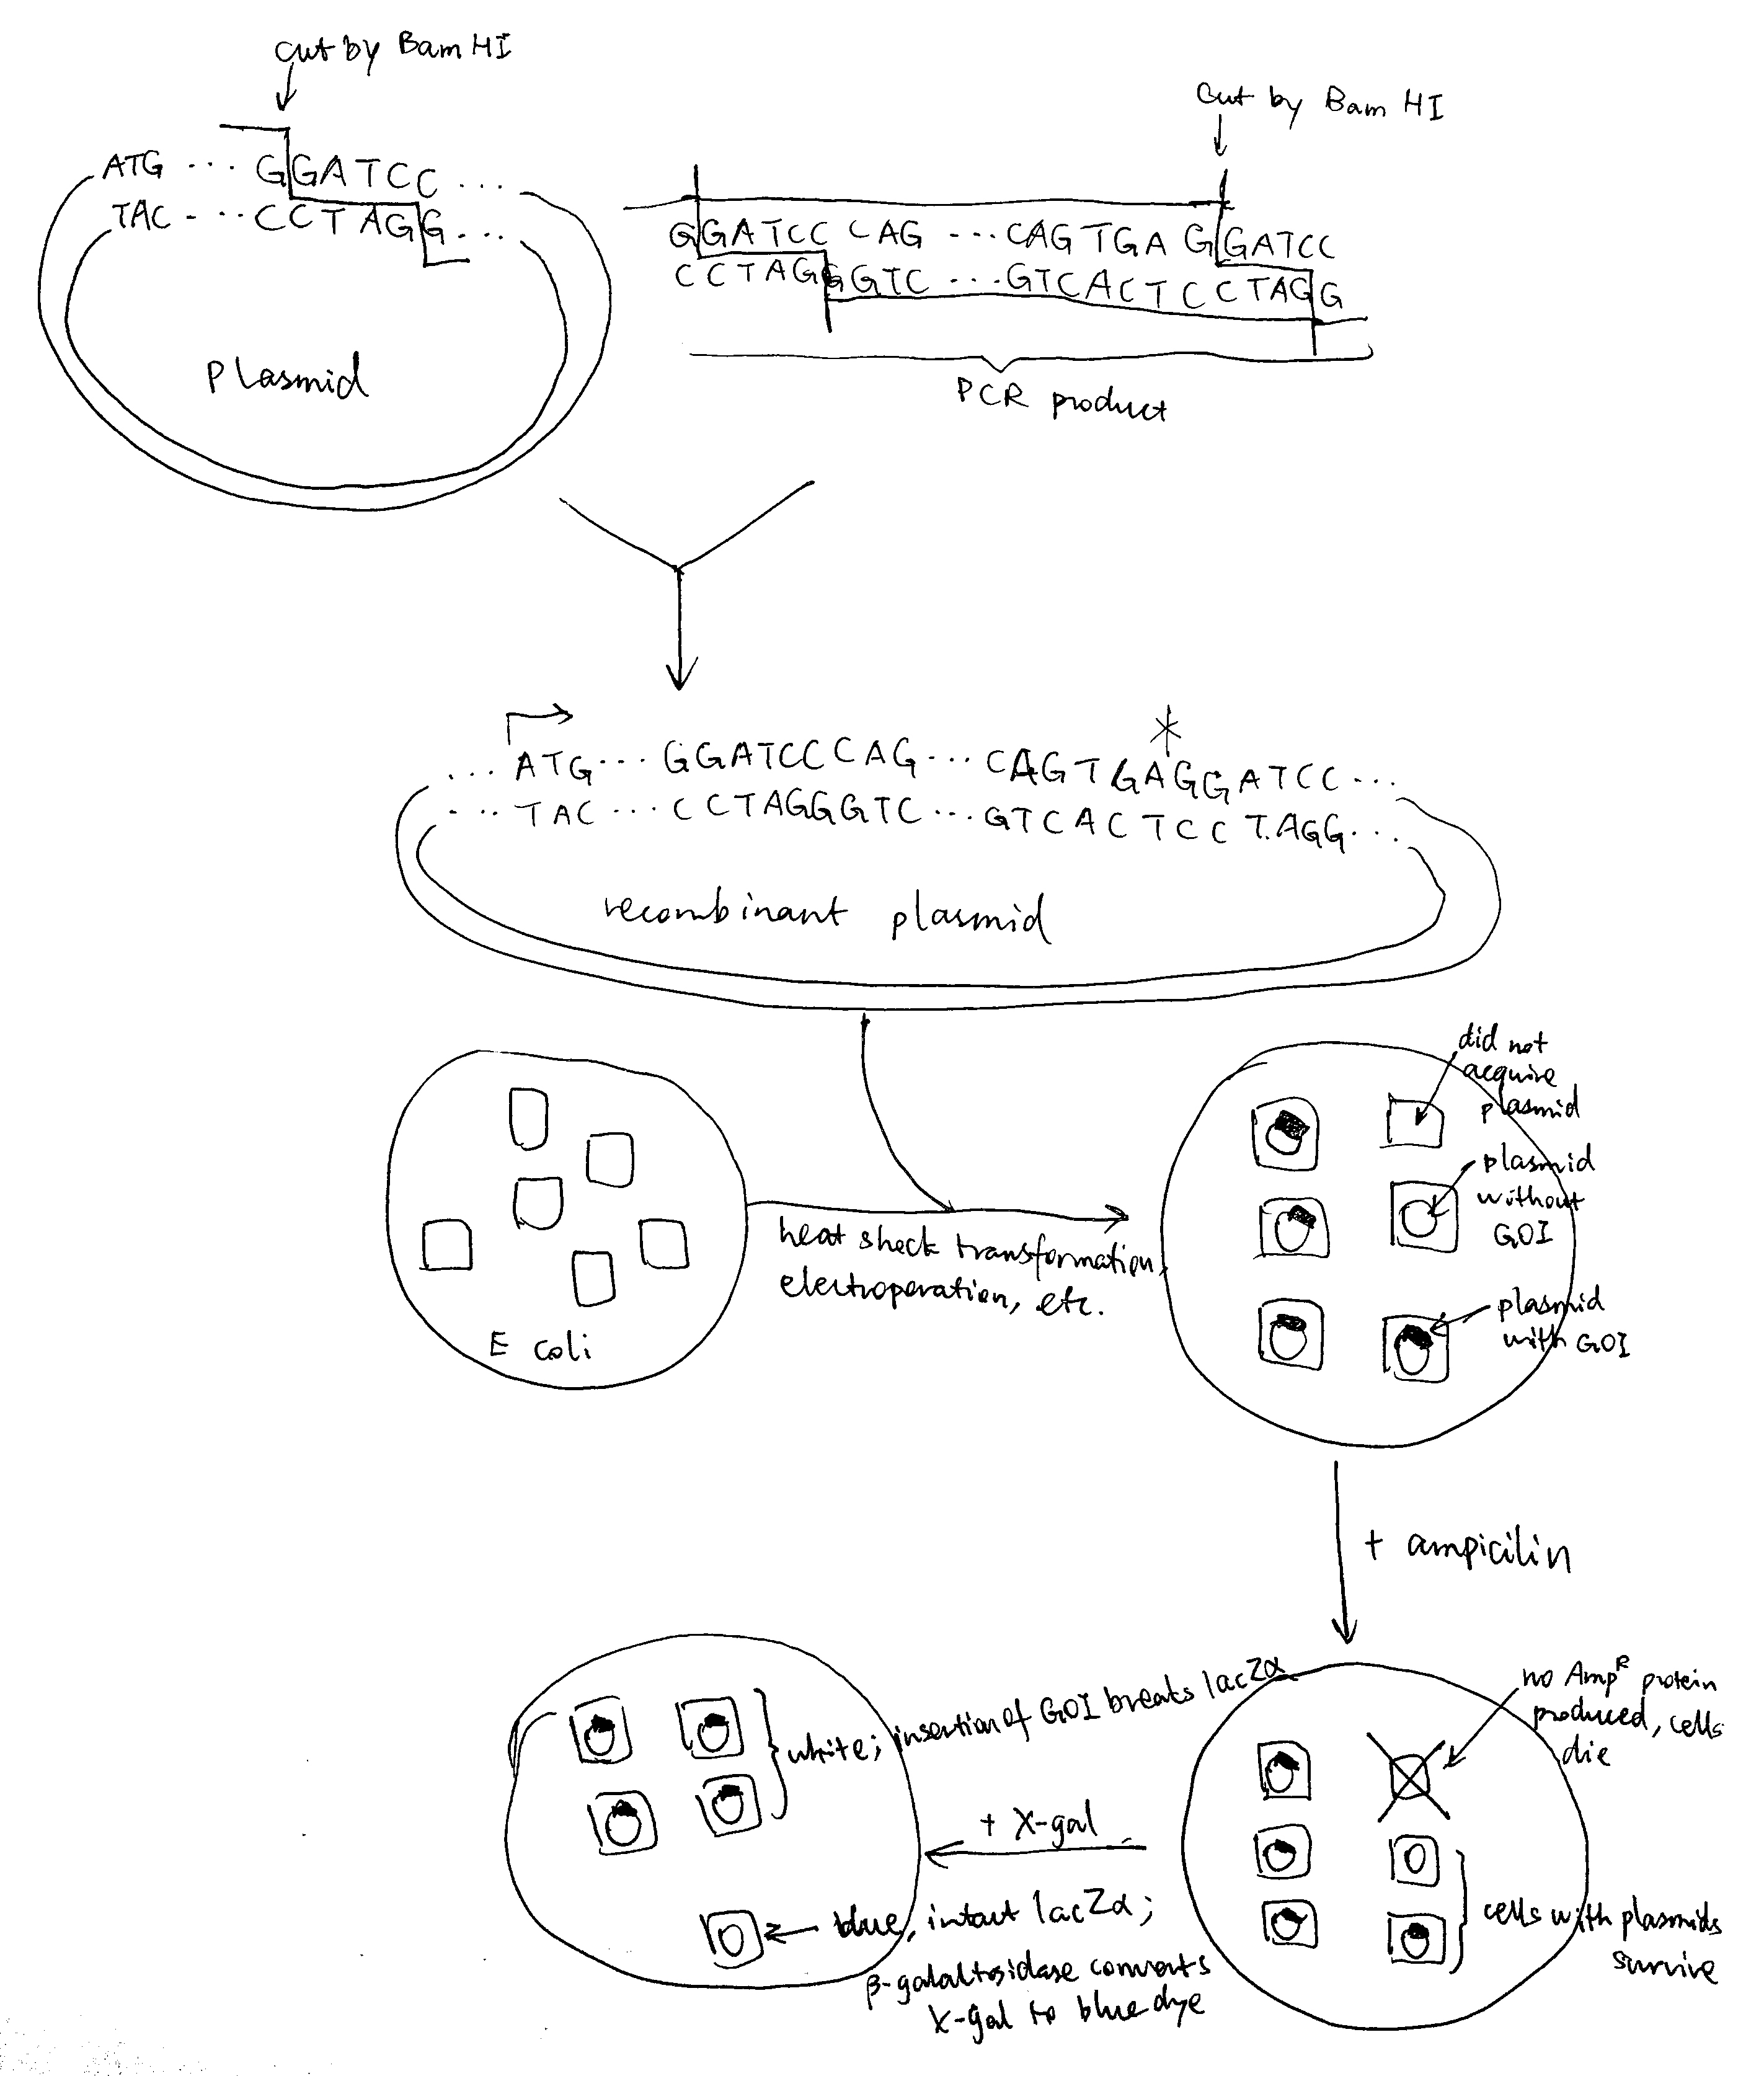
As illustrated in the plasmid map, the expression of inserted gene is controlled by the Lac operator. When uninduced, lac repressor protein due to LacI expression binds to Lac operator, preventing expression of inserted gene. IPTG can be used to induce expression. IPTG is an analogue of lactose, which activates Lac inducible operon by deactivating the lac repressor. IPTG is not metabolised by E. coli so it can be maintained at a constant concentration.
The protein product contains N-terminal hexahistidine tag which binds to Nickle ions with high affinity. Affinity chromatography using nickle-bound resin can be used to purify the protein. After that, size-exclusion chromatography may also be done to remove any possible aggregates of this peptide or complexes of this peptide with other species.
Run a SDS-PAGE, stain with Commassie blue and there should be only one band.
This extracellular protein is likely to contain disulfide bridges, which would not form in the normal reducing intracellular environment of bacteria. Some strains of E. coli, such as Origami, have mutant thioredoxin reductase and/or glutathione reductase an thus have a oxidising cytoplasm, and they can be used to express proteins with disulfide bridges.
- From the blot developed with biotin binding protein, A alone produce a band while B or C alone does not. This indicates that A must be a potential ligand (because it, being alone and biotin-tagged, is pulled down by biotin-binding Streptavidin).
- From the blot developed with His tag binding antibody, only A+B produces a band. As A is the potential ligand, B must be Notch that is pulled down along with A. C must not be Notch because A+C does not produce a band, so C is another potential ligand.
- C alone does not produce a band in the biotin-specific blot possibly because the biotin tag possibly because C’s tertiary structure prevents biotin binding
The potential ligand A binds to Notch (B), so A+B produces a band on the His-specific blot. It is uncertain whether A interacts with C. A and C are both potential ligands and will not produce a band on the His-specific blot. A+C produces a band on the biotin-specific blot and this may be solely due to A (which itself alone produces the band). A might bind to C without making C’s biotin available for binding, or A might not bind to C, or A might bind to C, making its own biotin unavailable and C’s biotin available, so that a band with equal thickness is produced.
- Fluoresence resonance energy transfer (FRET), in which the potential ligand and Notch are each tagged with a fluorophore, where one type of fluorophore, when excited, can transfer energy to the other type of fluorophore through nonradiative dipole-dipole coupling and hence induce fluorescence of the acceptor fluorophore. The energy transfer is only possible when two fluorophores are very close to each other (when their associated proteins are bound to each other). If excitation of the donor fluorophore results in emission from the acceptor fluorophore, it indicates complex formation.
- As shown in Figure 1, surface plasmon resonance can also be used to monitor complex formation.
- MST (Microscale Thermophoresis) allows detection of complex formation in complex bioliquids such as blood serum or cell lysate.

Figure 1: Principles of SPR
Compound A
Toa1 decreases generation time and decreases lifespan.
No effect on both.
As a control group.
DMSO reduces lifespan.
Regarding lifespan in DMSO, when either Toa1 or Abp1 (or both) is absent, lifespan is unresponsive to compound A. Among these three conditions, when Toa1 is present and Abp1 is absent, lifespan is constantly short; when Toa is absent, lifespan is constantly long. This suggest that Toa1 reduces lifespan, and Abp1 itself has no effect on the lifespan when Toa1 is absent. When both proteins are present, lifespan increases with concentration of A and then decreases. This suggest that, at low concentrations of A, Abp1 binds to A, and the binding of Toa1 to Abp1-A complex reduces Toa1’s ability to shorten lifespan. At high concentrations of A, Abp1 becomes less effective in deactivating Toa1, possibly because Abp1 forms aggregates.
Mutation of ATG8 always leads to short lifespan and generation time, and mutation of SCH9 always leads to increased lifespan and generation time, regardless of the conditions of ABP1 and TOA1, and they all made the lifespan insensitive to the concentration of compound A. When mutations of ATG8 and SCH9 occur simutaneously, the effect of ATG8 loss dominates and results in short lifespan & generation time. Therefore, SCH9 may reduce lifespan and generation time and ATG8 opposes SCH9’s activity. This explains \(sch9\Delta\), \(atg8\Delta\) and \(sch9\Delta atg8\Delta\). In addition, Toa1’s ability to reduce lifespan is dependent on SCH9. In \(sch9\Delta abp1\Delta\) and \(sch9\Delta toa1\Delta\), the life-span reduction cannot be done without SCH9. In \(abp1\Delta atg8\Delta\), lifespan reduction is caused by Toa1+SCH9 and in \(toa1\Delta atg8\Delta\) caused by SCH9, and no ATG8 was present to oppose this effect.
In the western blot data, for Sch9 5SA, the purpose of changing serine to alanine is usually to test for phosphorylation, and in this case the band is shorter than WT, indicating there is phosphorylation on Sch9. Also Sch9 5SA band is similar in length to \(toa1\Delta\), which implies that toa1 loss has an similar effect to making Sch9 unavailable for phosphorylation. Thus Toa1 may phosphorylate Sch9, and this is in accordance with an observation in (f): ‘toa1’s ability to reduce lifespan is dependent on sch9’. Sch9 5SA with phosphatase further reduces the signal, and this indicates that Sch9 has other phosphorylation sites (apart from the site where 5 S was changed to A i.e. target of toa1) being phosphorylated.
WT + compound A produced a low signal comparable to the WT + phosphate band. Thus compound A may hamper phosphorylation of Sch9 (by directly hindering phosphorylation, or acting as a phosphatase). As toa1 is ‘target of A’ and toa1 is the kinase that phosphorylates Sch9, compound A is very likely to inhibit toa1.
see Figure (g)
- Purify the proteins and study their interactions in vitro.
- to confirm phosphorylation of Sch9 by Toa1: mix Sch9, Toa1 and ATP (control group: Sch9 and ATP only) and run isoelectric focusing (phosphorylated Sch9 has a more negative charge)
- to confirm the role of compound A: mix compound A, Sch9, Toa1 and ATP (control group: buffer+Sch9+Toa1+ATP) and run isoelectric focusing.
In strains with Sch92D3E but not WT Sch9, the lifespan is constantly reduced and this effect is unaffected by compound A.
See Figure 2.
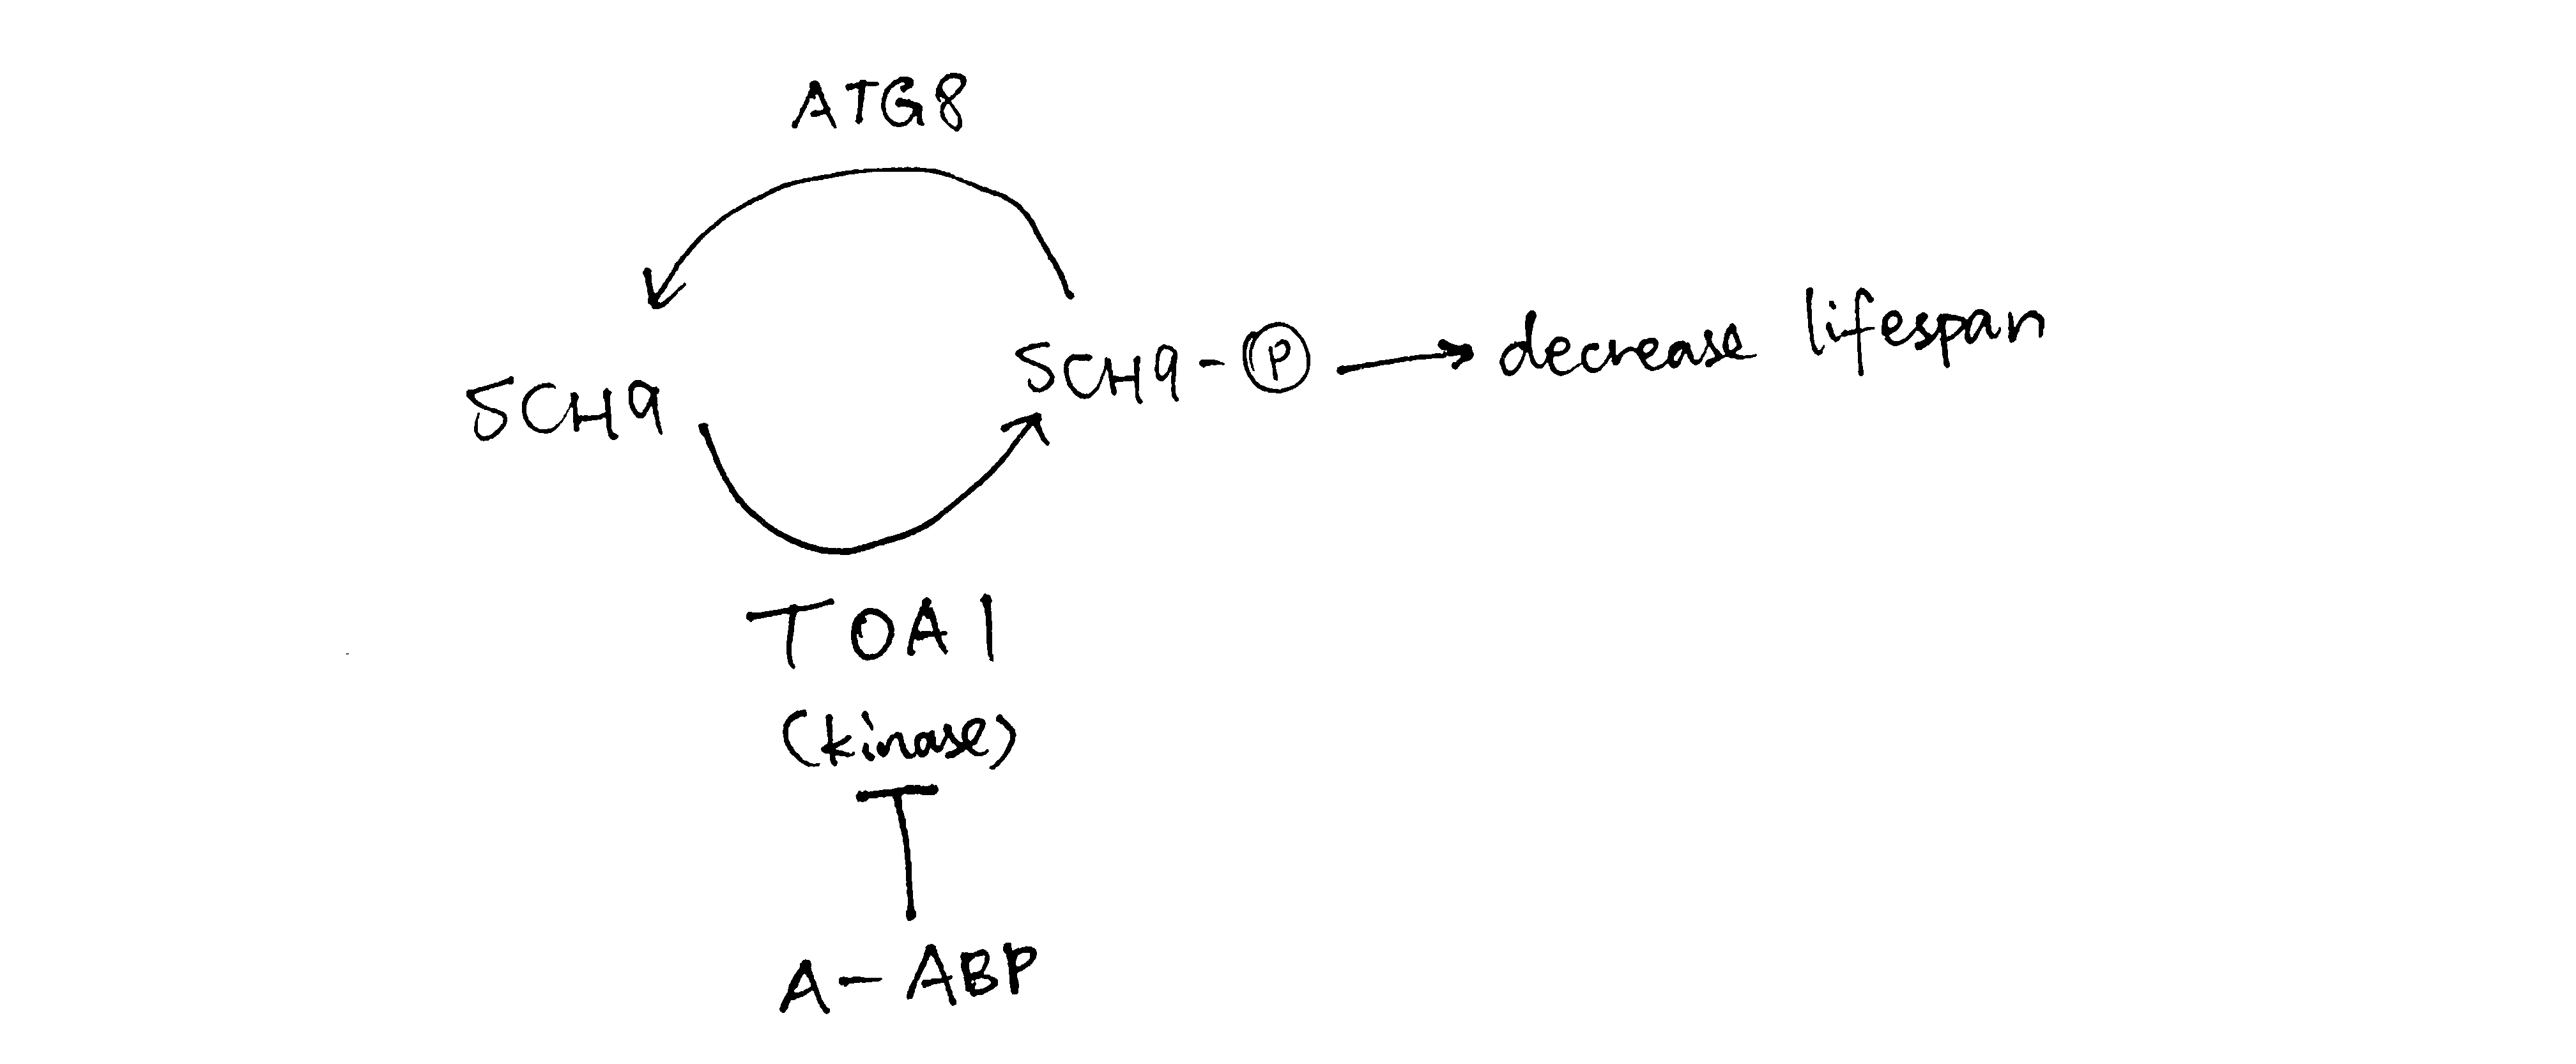
Figure 2: When compound A concentration increases, TOA is is inhibited and less Sch9 is phosphorylated, so there is less lifespan-reduction effect due to phosphorylated Sch9, and hence the lifespan increases. When the concentration of A gets too high, however, ATG8 phosphatase is expressed to dephosphorylate Sch9 and thus decrease lifespan.
Title
You want to over-express a protein secreted by the malarial parasite. It is cysteine-rich and has no known structure. Outline an expression and purification strategy, using both traditional and high-throughput methods, to produce a sample suitable for protein crystallography. Include a description of how you would assess the quality of the purified protein.
1 Overview
The general workflow for obtaining a sample of (malarial) protein is summarised as follows:
- Identifying and amplifying the gene of interest (GOI)
- Constructing the vector
- Transformation/transfection of host cells
- Screening for the most viable (high yield and solubility) transformants
- Extracting and purifying proteins
For crystallography studies, a protein sample with high purity, solubility and yield must be obtained. The expression and purification strategies depend on the characteristics of the protein of interest, such as size, shape, intrinsic solubility, requirement of post-translational modifications and/or cofactors, presence of disulfide bridges, in vitro stability.
2 Protein Expression
2.1 Identifying and amplifying the gene
If the coding sequence of the protein is unknown but the protein is purified, mass spectrometry (or chemical methods such as Edman degradation) can be used to determine the amino acid sequence of the protein, which can then be used to search for the the corresponding DNA sequence.
Usually, instead of using the full DNA sequence, cDNA is used in cloning because it does not contain introns. cDNA is made by:
- extracting total RNA from cells by TRIzol and then isolate the mature mRNA by affinity chromatography (with poly-T coated resins which binds to poly-A tails of mature mRNA)
- reverse transcription of the template DNA strand by viral reverse transcriptase (RT) followed by RNA degradation (often by the RNAse H activity of RT)
- synthesis of the coding strand by DNA polymerase
Often, the latter two steps are done repeatedly in RT-PCR to amplify the DNA fragment, if the sequence of the GOI is known and specific1 primers are designed. The primers include additional restriction enzyme cleavage sites for the convinience of traditional ligation-dependent cloning, or other sequences for ligation-independent cloning (see Section 2.3).
If the protein is already known to have a match in malarial cDNA library, we can skip most of the above steps and PCR-amplify the cDNA of interest from the library directly.
When we know the sequence of GOI, we can do a BLAST to find possible homologous proteins, and study any relavant scientific literature. The structure of some homologous proteins might have been solved previously and we can refer to their expression and purification strategies, which might prevent some waste of time on trial-and-errors. Bioinformatic analyses, such as disorder prediction using the RONN algorithm and generation of 3D homology models using the Phyre2 server, might also be helpful.
Codon optimisation might also be needed. Codon usage can vary significantly between species as well as between genome types such as nuclear DNA and mitochondrial DNA. For example, the frequencies of codons AGG, AGA, and CGA (which code for arginine) in H. sapiens are 11.4, 11.5 and 6.3, respectively, while the corresponding frequencies in E. coli are 1.2, 2.1 and 3.6. Codons that occur in high frequency in Plasmodium but in low frequencies in E. coli would result in a condition where the pool of tRNA for that codon will be so low as to become depleted. When the rare tRNAs are depleted to produce the recombinant protein, proliferation of the host cells is restricted, leading to low yield. This problem may be partially solved by the use of an inducible expression vector (e.g. IPTG), but when the foreign gene contains a large number of rare codons, this is not enough. There are two further approaches to improve the yield. First, the rare codons in the foreign genes can be substituted with prevalent codons, but this is not always reliable. Second, host cells can be transformed with the genes that code for the rare tRNAs. This approach is reliable and several such cell lines are commercially available. Custom host cells can also be made using plasmids.
We might fail in crystallising the single full-length protein (often because of low solubility). In that case, we can try co-expressing another protein or add an appropriate cofactor and crystallising the resulting complex. If this still fails, we might consider truncating the GOI, e.g. removing a very hydrophobic region that results in low solubility. In high-throughput approaches, such as the pipeline adopted by Oxford Protein Production Facility (OPPF), many variants are constructed in parallel to maximise output.
2.2 Choosing the host organism and the vector
2.2.1 Bacteria and plasmid vectors
Typically and traditionally, the gene of interest (GOI) is incorporated into a plasmid vector via a ligation-dependent mechanism, then the plasmid is introduced into bacterial (E. coli) cells for expression. There are also ligation-independent methods for making vectors, which is more robust and easy to use (only need to design one ‘adaptor’ parts of the primers once), making it suitable for high-throughput methods.
Bacteria-based protein expression is time- and cost-efficient, but it has two major limitations:
- the insertion size of a plasmid is small, typically 2-10 kb (bacterial artificial chromosomes (BAC) with greater insertion sizes can be used, but the procedures are more complex)
- Bacteria might be unable provide the appropriate protein folding environment (including chaperones) and/or post-translational modifications that can be crucial to protein’s functions.
Given the protein of interest is cysteine-rich, it is susceptible that disulfide bridges are present if this protein is also extracellular. The normal intracellular reducing environment disfavours disulfide bridge formation, but Origami and related strains have an oxidising intracellular environment due to mutant thioredoxin reductase and glutathione reductase, and they are used to express proteins that require disulfide bonds to achieve their correctly-folded conformation.
The plasmid should contain selectable markers for easy identification of successful transformants. The combination of AmpR and lacZ\(\alpha\) is a common choice, as explained in Figure 2.1.
In addition, the promoter should be strong and tightly regulated with minimum or complete lack of basal level transcription under uninduced conditions. The IPTG inducible T7 promoter system (as in pET plasmid) is one of the common choices. IPTG is an analog of allolactose, which can bind to and silence lac inhibitor, de-inhibiting the lac operator. IPTG is not digested by the bacteria, and thus its constant concentration continuously induces protein expression. The lac operator may be also made symmetric, strictly preventing transcription when uninduced.
Some commerially available plamids also include tags added to the N- or C-terminus of the insertion site (multiple cloning site), which aids protein purification. This can be a polyhistidine tag, a fusion protein (e.g. GST) or a short recognisable peptide, and often a cleavage sequence is also introduced for removal of the tags.

Figure 2.1: The pETBlue-2 plasmid vector
Plasmid-based bacterial transformation is usually permanent because plasmids can replicate themselves and be distributed into daughter cells after cell division.
2.2.2 Eukaryotic hosts
If the protein is incompatible for expression in bacteria, an eukaryotic host is chosen. This is typically yeast, insect, or human cells.
Transfection of eukaryotic cells can be transient or permanent. Eukaryotic cells do not transcribe plasmids, and the DNA fragment of interest must integrates into the host cell’s genome to produce a stable cell line–which is a rare event and takes more time to achieve. If we had to use a eukaryotic host, transient transfection may be used first to screen for the most viable construct, then a stable cell line is made with this construct for higher yield and convience for later use.
2.2.3 High-throughput strategy
High-throughput protein production aims to use robots to automate the steps in making expression constructs and screening them.
Take the OPPF pipeline for example, when the GOI is an eukaryotic protein, they test expressions with different vector constructs (with varying amino acid start and end points, fusion partners, and plasmids) in both E. coli and insect cells in parallel (Figure 2.2). The expresison screening is automated and performed in 96-well format.
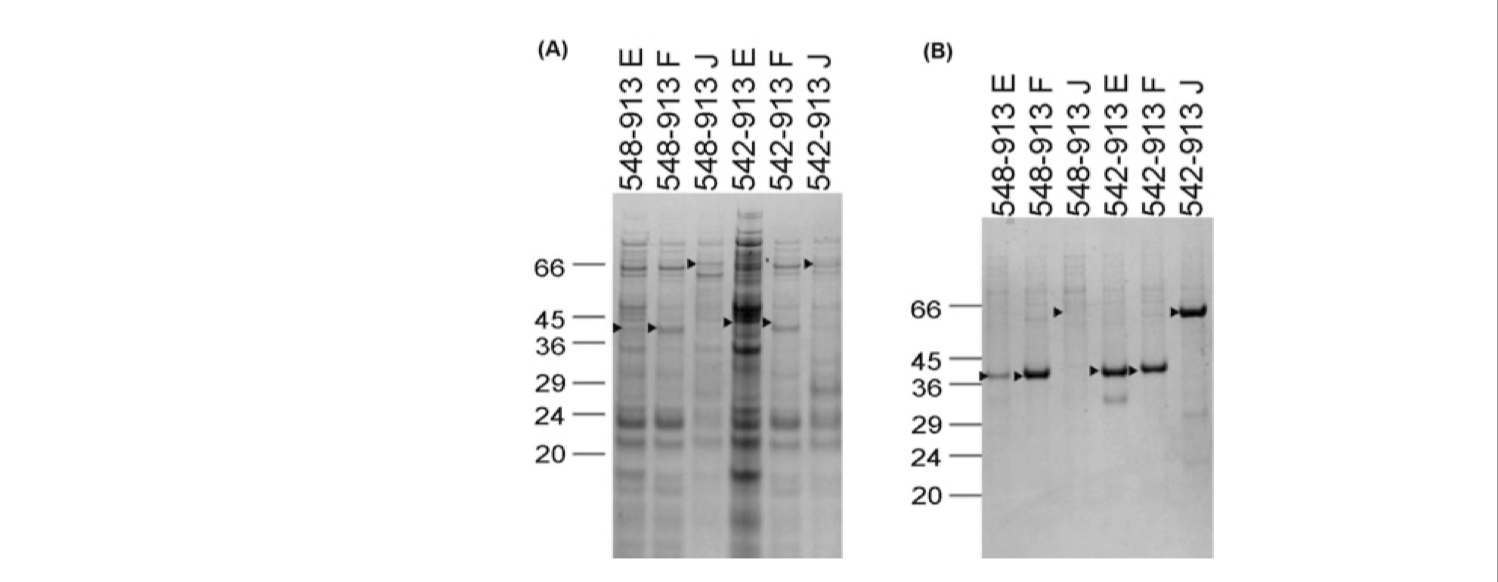
Figure 2.2: SDS-PAGE gel after NiNTA magnetic bead purification showing expression of constructs for DDR1 in (A) E. coli and (B) insect cells via the baculovirus system. The names of constructs correspond to amino acid start and end points and the vector being used (pOPINE, pOPINF or pOPINJ, which confers a C-terminal His-tag, an N-terminal His-tag, or an N-terminal His-GST tag, respectively)
they also used ligation-independent cloning methods (Section 2.3) to reduce variability and thus simplify the workflow.
2.3 Constructing the vector
The DNA fragment we obtained should be incorporated into a vector before they can be introduced into the host cell. Usually, a recombinant plasmid is made first and amplified in bacteria. Then, if necessary, it can be transferred into other vectors such as viruses and liposomes, depending on the strategies. Here I describe two ways of making recombinant plasmids: traditional restriction enzyme and ligation-based plasmid cloning, and T4 polymerase-based ligation-independent cloning (LIC).

Figure 2.3: Left, traditional cloning based on restriction enzyme and ligase; right, ligase-independent cloning based on T4 polymerase
As shown in Figure 2.3, in the ligation-dependent method, the PCR product contains flanking restriction sites (came from the designed primers) to be recognised by a restriction enzyme (e.g. EcoRI). The plasmid also contain the restriction site for EcoRI (located in the multiple cloning site, see Figure 2.1). Cleavage by EcoRI results in complementary ‘sticky ends’, which facilitate annealing of GOI to the plasmid. The sticky sequences are shart (usually 3-5 bp), thus, to overcome low stability, ligation must be done immediately.
The ligation-based cloning are not proper for high throughput protein production (HTPP) projects due to several disadvantages:
- incomplete DNA digestion and poor ligation yields
- each GOI has to be inspected for any internal restriction sites (for exclusion from the choices of the ligation sequence)
- unwanted amino acids can be introduced to the expressed protein
- the GOI can only be cloned in the vector position where the selected restriction site is present
Ligation-independent cloning (LIC) overcomes many of the problems described above. In a T4 DNA polymerase-dependent approach, the sticky sequences are made by the 3’-to-5’ exonuclease activity of T4 polymerase. These sequences are long, allowing formation of stable recombinant plasmid without in vitro ligase treatment. The nicks in sugar-phosphate backbone are later fixed by host ligase.
The obvious elegance of T4-LIC is that once the sticky sequence is designed and constructed, it can be used for any GOI. As T4 polymerase (exonuclease activity) always proceeds from 3’ ends, any internal sticky sequences will not be disrupting.
2.4 Transformation/Transfection
Transformation is the process of delivering GOI-containing foreign DNA into host cells. For eukaryotic cells, this is more often known as transfection (because ‘transformtion’ has other meanings). Many chemical/physical transformation/transfection methods are generally done by making transient holes on host cell plasma membrane (technically, ‘inducing competence’ in host cells). Here are two examples.
Heat-shock transformation is used for small vectors such as plasmids. The general procedures are:
- Host cells are incubated in a solution containing divalent cations (typically CaCl2) on ice.
- CaCl2 partially disrupts the cell membrane, which allows the recombinant DNA enter the host cell. Such cells are called competent cells.
- Cells are exposed to a heat pulse (heat shock), and the thermal imbalance causes the entry of DNA through disrupted plasma membrane.
Electroporation can be used for larger vectors such as BAC and PAC2. The general procedures are:
- Host cells are placed into a cuvette, together with the vector. The cuvette is connect to electrodes.
- The cuvette containing the mixture is subjected to intense electric pulses (2500 V/cm for bacteria, lower for animal and plant cells) each lasting for only a few milliseconds
- Most cells would die under such treatment, but for those survived, their membranes are polarised by the electric field and are disrupted, and DNA enters through the pores. Finally, the membrane reseals after the treatment.
Depending on the identity of the host cell and the vector, other methods are also available. These are not directly relevant with our goal of expressing a malarial protein, so here is a simple listing:
- cosmid and fosmid vectors are introduced into bacterial cells via bacteriophages
- calcium phosphate co-precipitation for mammalian cells
- microinjection for animal cells
- microprojectile bombardment for plant cells
- adenovirus and lentivirus vectors for mammalian cells
- Agrobacterium-mediated transformation for plant cells
- genome editing techniques based on ‘designer nucleases’ such as ZFN, TALEN and CRISPR-Cas9 with homology directed repair
3 Protein Extraction and Purification
After proliferation of transformed/transfected cells, we can extract and purify the protein fo interest.
3.1 Extraction
3.1.1 Cell lysis
The first step is to lyse, or homogenise the cells to release the protein. To do this, cells can be subjected to osmotic shock or ultrasonic vibration, forced through a small orifice, or ground up in a blender. (if a membrane protein is to be extracted, detergents are normally used, although detergent-free methods have been developed recently)
3.1.2 Removing cellular components and debris
Repeated centrifugation, each time with a higher speed (i.e. differential centrifugation), removes many impurities with large sizes. Organelles (and small vesicles and microsomes) sediment (forming pallets) while proteins remain in the solution (as supernatant).
A finer degree of separation can be achieved by layering the homogenate in a thin band on top of a salt solution that fills a centrifuge tube. When centrifuged, the various components in the mixture move as a series of distinct bands through the solution, each at a different rate, in a process called velocity sedimentation. A glucose gradient is established to protect the bands from convective mixing.
3.2 Purification
Classical methods for separating proteins depend on variable protein properties, including solubility, size, charge, and binding affinity. In most cases, protein mixtures are sequentially subjected to different separation methods, each based on a different property. After each step of purification, the fractions are assayed (see Section 3.2.3).
3.2.1 Salting out and dialysis
The addition of certain salts in the right amount can selectively precipitate the protein of interest, while others remaining in solution. The precipitation is removed by centrifugation.
Dialysis is then used to remove the salt from the solution containing the protein of interest. The protein mixture is place inside a dialysis bag (i.e. made of size-selective permeable membrane) and placed in a buffer solution with low salt concentration. Salt in the protein-containing solution then diffuse out, leaving proteins inside the bag.
3.2.2 Chromatography
In column chromatography, the solution containing proteins is passed through a column containing a solid matrix (resin). Different proteins are retarded to different extents by their interaction with the matrix, and they can be collected separately as they flow out of the bottom of the column. Depending on the choice of matrix, proteins can be separated according to their charge (ion-exchange chromatography),nhydrophobicity (hydrophobic chromatography), size (gel-filtration/size-exclusion chromatography), or ability to bind to particular small molecules or to other macromolecules (affinity chromatography). The last two are the most important for high throughput protein purification are affinity chromatography and size-exclusion chromatography.
Affinity chromatography extract protein according to the tags we attached to target proteins. For example, His-tagged proteins bind to Nickle-coated resin and HSV epitope tagged proteins bind to resin coated with corresponding antibodies (polyHis-Ni interactions often have lower specificity compared to enzyme-substrate and epitope-antibody interactions)
Size exclusion chromatography cleans abnormal protein aggregates based on their large size.
A problem experienced by column chromatographic methods is diffusional spreading (i.e. proteins that are going down faster also diffuse upwards, mixing with proteins going slower), which reduces the resolution. The degree of diffusional spreading increases with time during which proteins stay in the column. HPLC (high-performance liquid chromatography) solves this problem. It makes use of high-pressure pumps that speed the movement down the column, so that the time of travelling, and hence the diffusional spreading, is greatly reduced, leading to higher resolution.
3.2.3 Monitoring the progress of purification
As purification progresses:
- the total amount of protein should decrease as unwanted proteins are removed and some target proteins are lost
- amount of target proteins should also decrease because they are unavoidably lost e.g. by nonspecific attachment to the purification apparatus or washed away
- the proportion of the target protein (i.e. purity) should increase as unwanted proteins are removed
The simplest way to monitor these changes is running a SDS-PAGE gel electrophoresis after each purification step. The bands should progressively decrease to one (which correspond to the target protein), and the thickness of this band should increase because the concentration of target protein increases (its absolute amount decreases, but as we removed the fractions without the target protein in chromatography, its concentration should increase).
To assess whether the protein is correctly folded and functional, specific assays are used For example, if the target protein is an enzyme, it can be assayed using its substrate; if it is a protein which binds to another molecule, their interaction can be probed by surface plasmon resonance. Circular dichroism also helps to assess the foldedness of the target protein.
3.3 Preparation for crystallography
For crystallisation, the protein sample must be homogenous and correctly folded. They can be checked by the methods descibed in Section 3.2.3.
If the affinity tag needs to be removed (which is often required for structual studies), a protease cleavage site is often incorporated before or after the fusion tag and the cleavage can be conducted either in solution following purification (the protease themselves are tagged) or immediately after enzyme capture in situ on the chromatography resin itself. AKTA Express (GE Healthcare) is an elegant procedure for on-column cleavage coupled to multidimensional chromatography that is highly amenable to high throughput protein purification.
There are three methods to grow protein crystalls, namely ‘hanging drop’, ‘sitting drop’, and microdialysis, but the underlying principles are similar. The protein is first dissolved in a ‘crystallisation cocktail’ droplet and concentrated to 2-50 mg/ml, then it is allowed to equilibrate with a more concentrated reservoir solution of the cocktail with a volume ratio of 1:1. As the protein droplet becomes supersaturated, it may start to crystalise. Robots are commonly used for automatic screeening and optimisation of crystallisation conditions. If crystallisation fails under all conditions, we can try co-crystalising with a ligand. If this still fails, we might consider using a truncated protein, as described in Section 2.1.
References
Doyle, Sharon A. 2008. HIgh Throughput Protein Expression and Purification: Methods and Protocols. Edited by John W. Walker. Methods in Molecular Biology 498. Humana Press.
ThermoFisher. 2019. https://www.thermofisher.com/uk/en/home/references/gibco-cell-culture-basics/transfection-basics/gene-delivery-technologies.html.
Vicentelli, Renaud. 2019. HIgh-Throughput Protein Production and Purification: Methods and Protocols. Edited by John M. Walker. Vol. 2025. Methods in Molecular Biology. New York, NY: Humana Press.
Principles of X-ray crystallography
Scattering
- When light hits matter…
- Vibration\(\rightarrow\)scattering (all directions)
- Energy level transitions\(\rightarrow\)absorption and emission (fluorescence)
- Photochemical reactions (e.g. photosynthesis)
- scattering can give rise to refraction and diffraction
- experiments on scattering
- turbidity (reduction in intensity)
- angular dependence
- changes in \(\lambda\)
Wnt3-Fz8 Complex (Hirai et al. 2019)
- crystals of lysine-methylated and deglycosylated human Wnt3 (hWnt3)-mFz8 CRD complex were obtained by X-ray crystal structure was solved by molecular replacement and refined to a resolution of 2.8Å.
Difficulties in crystallisation and their solutions
- Strong hydrophobic property of Wnt proteins caused by a covalent lipid modification
Optimisation and chemical modifications conducted to ensure high expression yields, enhanced solubility and sample homogeneity
Solubility
- Failed attempts on making crystallization constructs
- afamin can solubilize Wnt proteins; when coexpressed and complexed, Wnt3 and 3a can be purified to homogeneity. However, diffraction-quality crystals could not be obtained after repeated trials.
- coexpression with mFz8 CRD after Janda’s success; but found purified Wnt3a-Fz8 CRD complex still remained hydrophobic and required detergents during concentration, which hampered crystallisation
- Successful: N-terminal truncation of Wnts to mimic the cleavage of the N-terminal peptide by a metalloprotease Tiki, which has been reported to reduce the overall hydrophobicity
- N-terminal 20 residues were removed from hWnt3/mWnt3a constructs
- PA-hWnt3(\(\Delta\)N)/PA-mWnt3a(\(\Delta\)N) coexpressed with mFz8 CRD C-terminally fused with modified human Fc.
- confirmed that complexes were fully soluble in aqueous buffer and could be concentrated to > 5 mg/ml without detergents
Optimisation
- Initially (following Janda) attached normal (with hinge region) human IgG1 Fc to the C-terminal of mFz8 CRD, intervened by a TEV protease cleavage sequence for the later Fc removal
- although complex formed with high yield, it could not be cleaved at all; different linker lengths showed no improvements
- decided to use IdeS protease to remove Fc.
Hirai, Hidenori, Kyoko Matoba, Emiko Mihara, Takao Arimori, and Junichi Takagi. 2019. “Crystal Structure of a Mammalian Wnt–Frizzled Complex.” Nature Structural & Molecular Biology 26 (5): 372–79. https://doi.org/10.1038/s41594-019-0216-z.
SAQ
Using the physical chemistry principles, discuss factors which are contributed in the favourability of an electron transfer reactions between cofactors.
The reduction potential, \(E\), is used to quantify favourability of gaining electrons (getting reduced). \(E^{\circ\prime}\) is the reduction potential measured under biological standard conditions (i.e. pH = 7, oxidised and reduced species are 1M, 298K and 1 atm). When concentrations of the oxidised and reduced species differ:
\[E=E^{\circ\prime} + \dfrac{RT}{zF}\ln\left(\dfrac{\text{[reduced]}}{\text{[oxidised]}}\right)\]
For two half equations, A+ + \(e^-\rightarrow\) A and \(\text{B} + e^- \rightarrow\) B- with \(E\) of \(x\) and \(y\) respectively, a full reaction equation can be constructed, which can be A+ + B- \(\rightarrow\) A + B (with \(E_\text{r}\) = x - y) or the reverse (with \(E_\text{r}\) = y - x); the one with positive \(E_\text{r}\) (reaction potential) will actually occur.
Electron transfers occur because electrons are moving down to a lower energy level. In simple cases, atoms with greater electronegativity have greater affinity for electrons and thus a more positive reduction potential, and vice versa. This is the case for strong oxidants F2 and Cl2 (electronegative; highly positive \(E\)) and strong reductants Li and Na (electropositive, highly negative \(E\)). In most cases, however, other factors, such as change in state, conformation, or interactions with water, will significantly affect the reduction potential. For example, Cu and Ag is less electronegative than hydrogen, but their monovalent ions are more easily reduced than H+. That is mainly because the formation of metallic solid upon reduction is highly exergonic. Similarly, although the atoms involved in the redox reactions in the repiratory chain are not variable (Cu and Fe), they have different \(E\) due to the enviornment (e.g. proximity to the P/N face, identity of ligands).
The series of cofactors along the electron transport chain have a generally steadily increasing \(E^{\circ\prime}\), so electrons are moved toward increasingly lower energy levels. There are some exceptions to this trend, but \(E_\text{r}\) would be made positive in these cases by making a concentration difference (usually by means of ‘pulling’ from the next redox centre with favourable \(E\)).
While the thermodynamic feasibility of the redox reactions is solely determined by the difference in the reduction potentials (which is proportional to Gibbs free energy), the kinetics (rates) are affected by more factors.
Electrons are passed from one centre to another by tunnelling. Specifically, the wave function for an electron in the donor shows there is a probability that the electron will be found at an acceptor some distance away. Tunnelling is independent of temperature and orientation of chemical groups, but is instead influenced by 1) the distance between the electron donor and acceptor, 2) the redox potential difference, \(E\), and 3) the ‘reorganisation energy’, \(\lambda\).
Within each respiratory complex, the redox centres are close to each other—no more than 14Å apart (the maxium 14Å is found between N5 and N6a Fe-S clusters in complex I). Ubiquinone has binding sites in complex I (II) and III in close proximity to the redox centres from which it receives and to which it delivers electrons, and the same is true for cyt c (which binds to complex III and IV). This arrangement makes the numerous electron transfer steps not the limiting factor in the respiratory chain.
Essay
What mechanisms are employed by mitochondrial electron transfer proteins to generate a proton-motive force (pmf)? Using the concept of membrane capacitance, explain why the dominant component of the pmf in mitochondria is an electrical potential rather than a pH gradient.
Two Proton Translocation Models: Loop and Pump
Mechanisms of coupling redox reactions to proton translocation can be classified into two models: the chemical loop, and the conformational pump.
In the loop model shown in Figure 1, the hydrogens (protons plus electrons) from the substrate (AH2) first reduce an mediator molecule (B) on the N side, and this mediator is reoxidised, forcing protons to be released to the P side via one pathway and electrons to flow back to the N side via another pathway. The electrons then reduce another species (C) using protons from the N side. This mechanism is employed in the respiratory chain, where ubiquinone serves as the ‘mediator’ molecule and ETC components from Rieske Fe-S protein in complex III to CuB centre in complex IV as the electron pathway. The number of protons translocated in this way has to follow a fixed stoichiometry (i.e. 1 proton per electron). (Not shown in this diagram, the reduction of Q near the N face driven by QH2 oxidation near the P face in the Q cycle is also an example of this mechanism.)
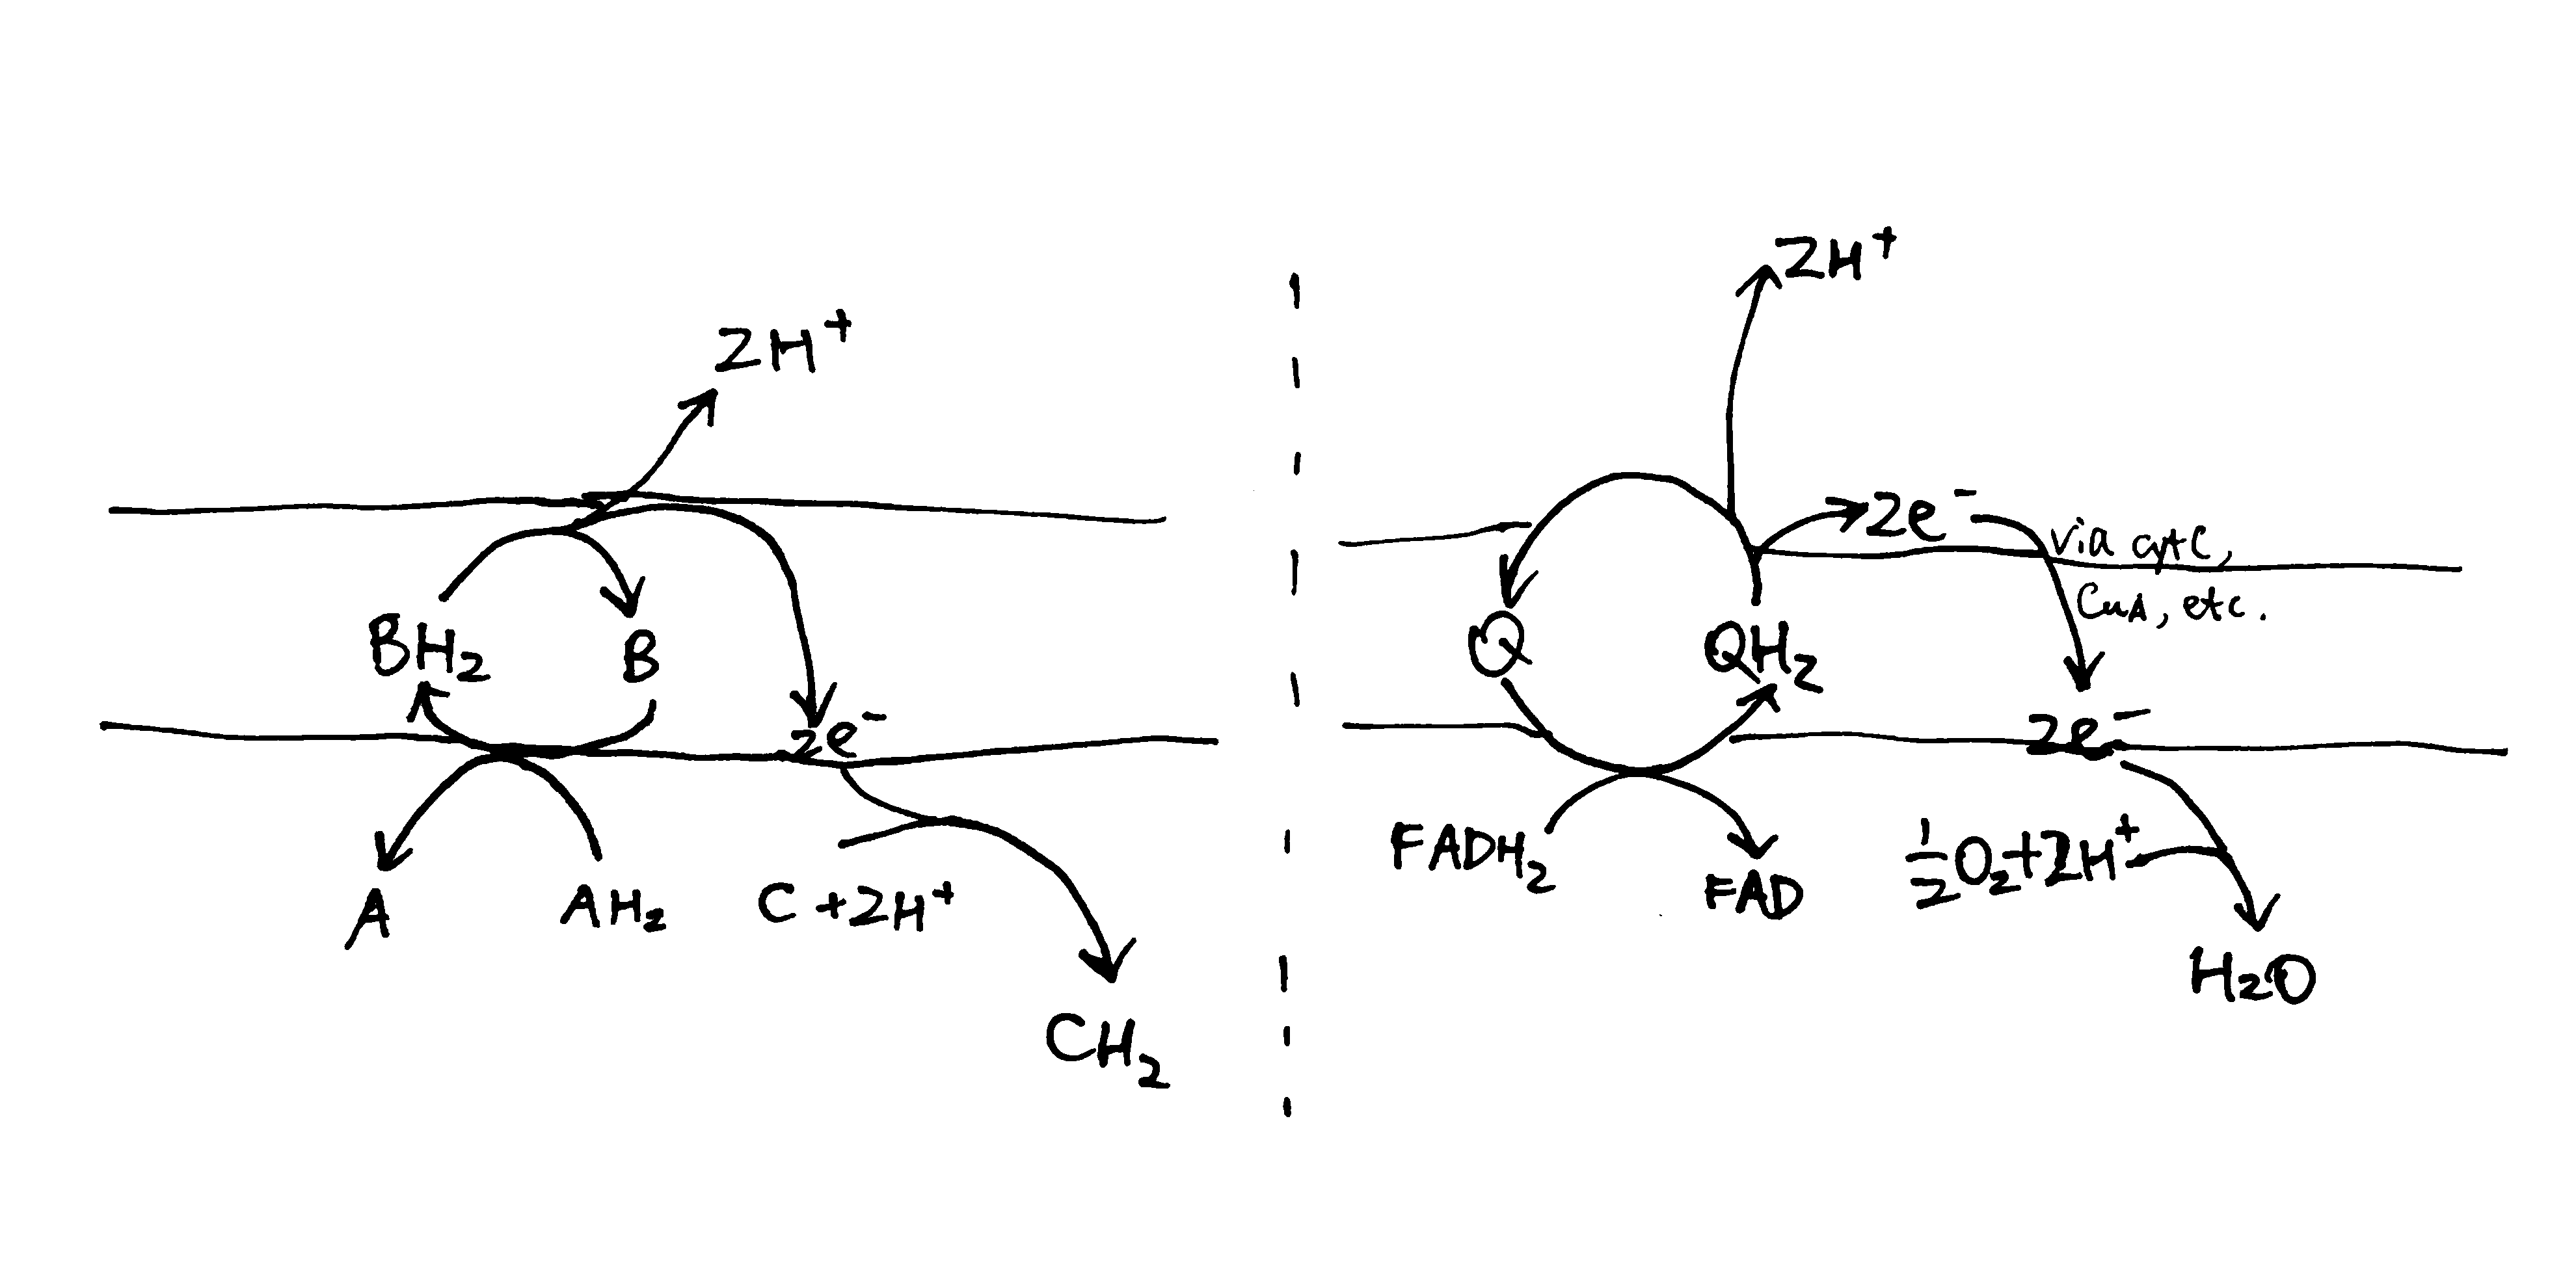
Figure 1: The loop model. Left, generic form; right, simplified example found in the respiratory chain.
The key idea of the pump mechanism is the conformational change driven by redox reactions. Conformational change can lead to alternating proton accessibility from the two faces and differential pKa values of proton binding sites, resulting in proton translocation (explained in Figure 2). The number of protons pumped in this way does not have to follow a fixed stoichiometry within the thermodynamic constraints (i.e. Er/n must be greater than ∆p). This mechanism is thought to be employed in complex I and IV of the respiratory chain. However, recent studies have shown that complex IV may adopt a unique mechanism, as explained later in this essay.
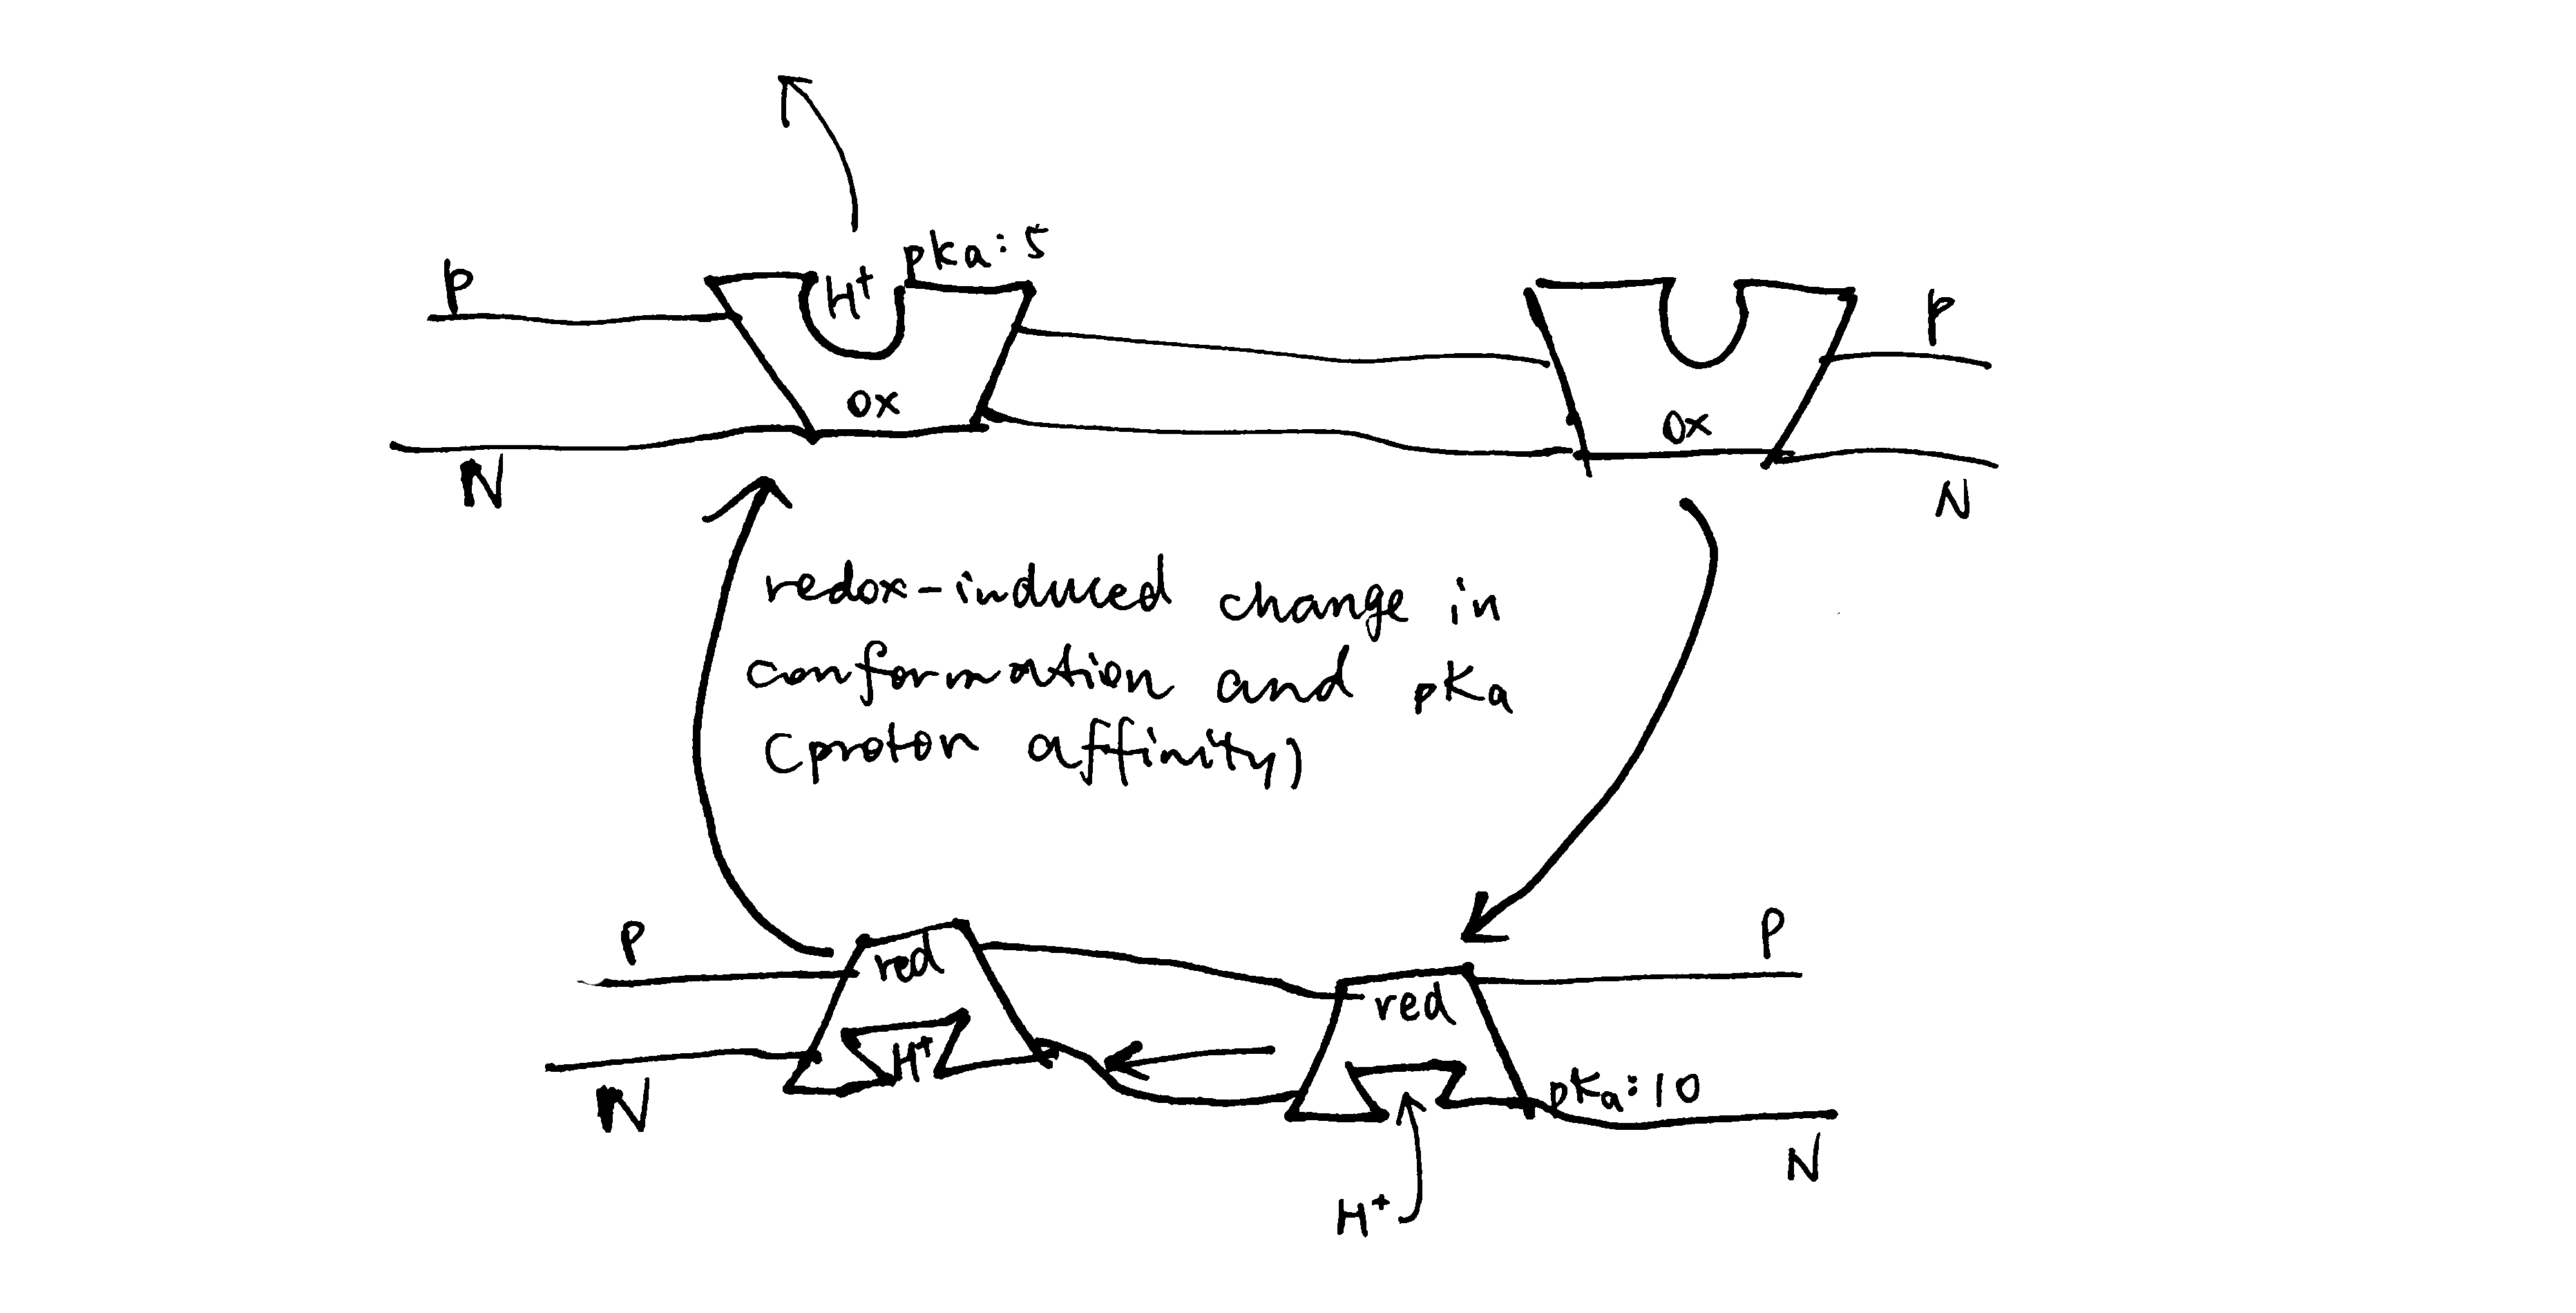
Figure 2: The conformational pump mechanism. When the “pump” protein is reduced, the proton binding site is exposed to the N face and with high pKa, promoting proton binding; upon oxidation, the proton binding site is open to the P face, and pKa drops, promoting proton dissociation.
Complex I
As shown in Figure 3, bacterial complex I (from Thermus thermophilus) comprises two domains. The hydrophobic, transmembrane domain (a.k.a. membrane arm) has a proton-translocating P-module and subunit NuoH. The hydrophilic domain (a.k.a. peripheral domain) has an NADH-oxidising dehydrogenase module (N-module) which feeds electrons to the electron-transferring chain of Fe-S clusters, and the connecting Q-module, which reduces ubiquinone. Mammalian mitochondrial complex I is similar in gross organisation and function, although it possesses more subunits.
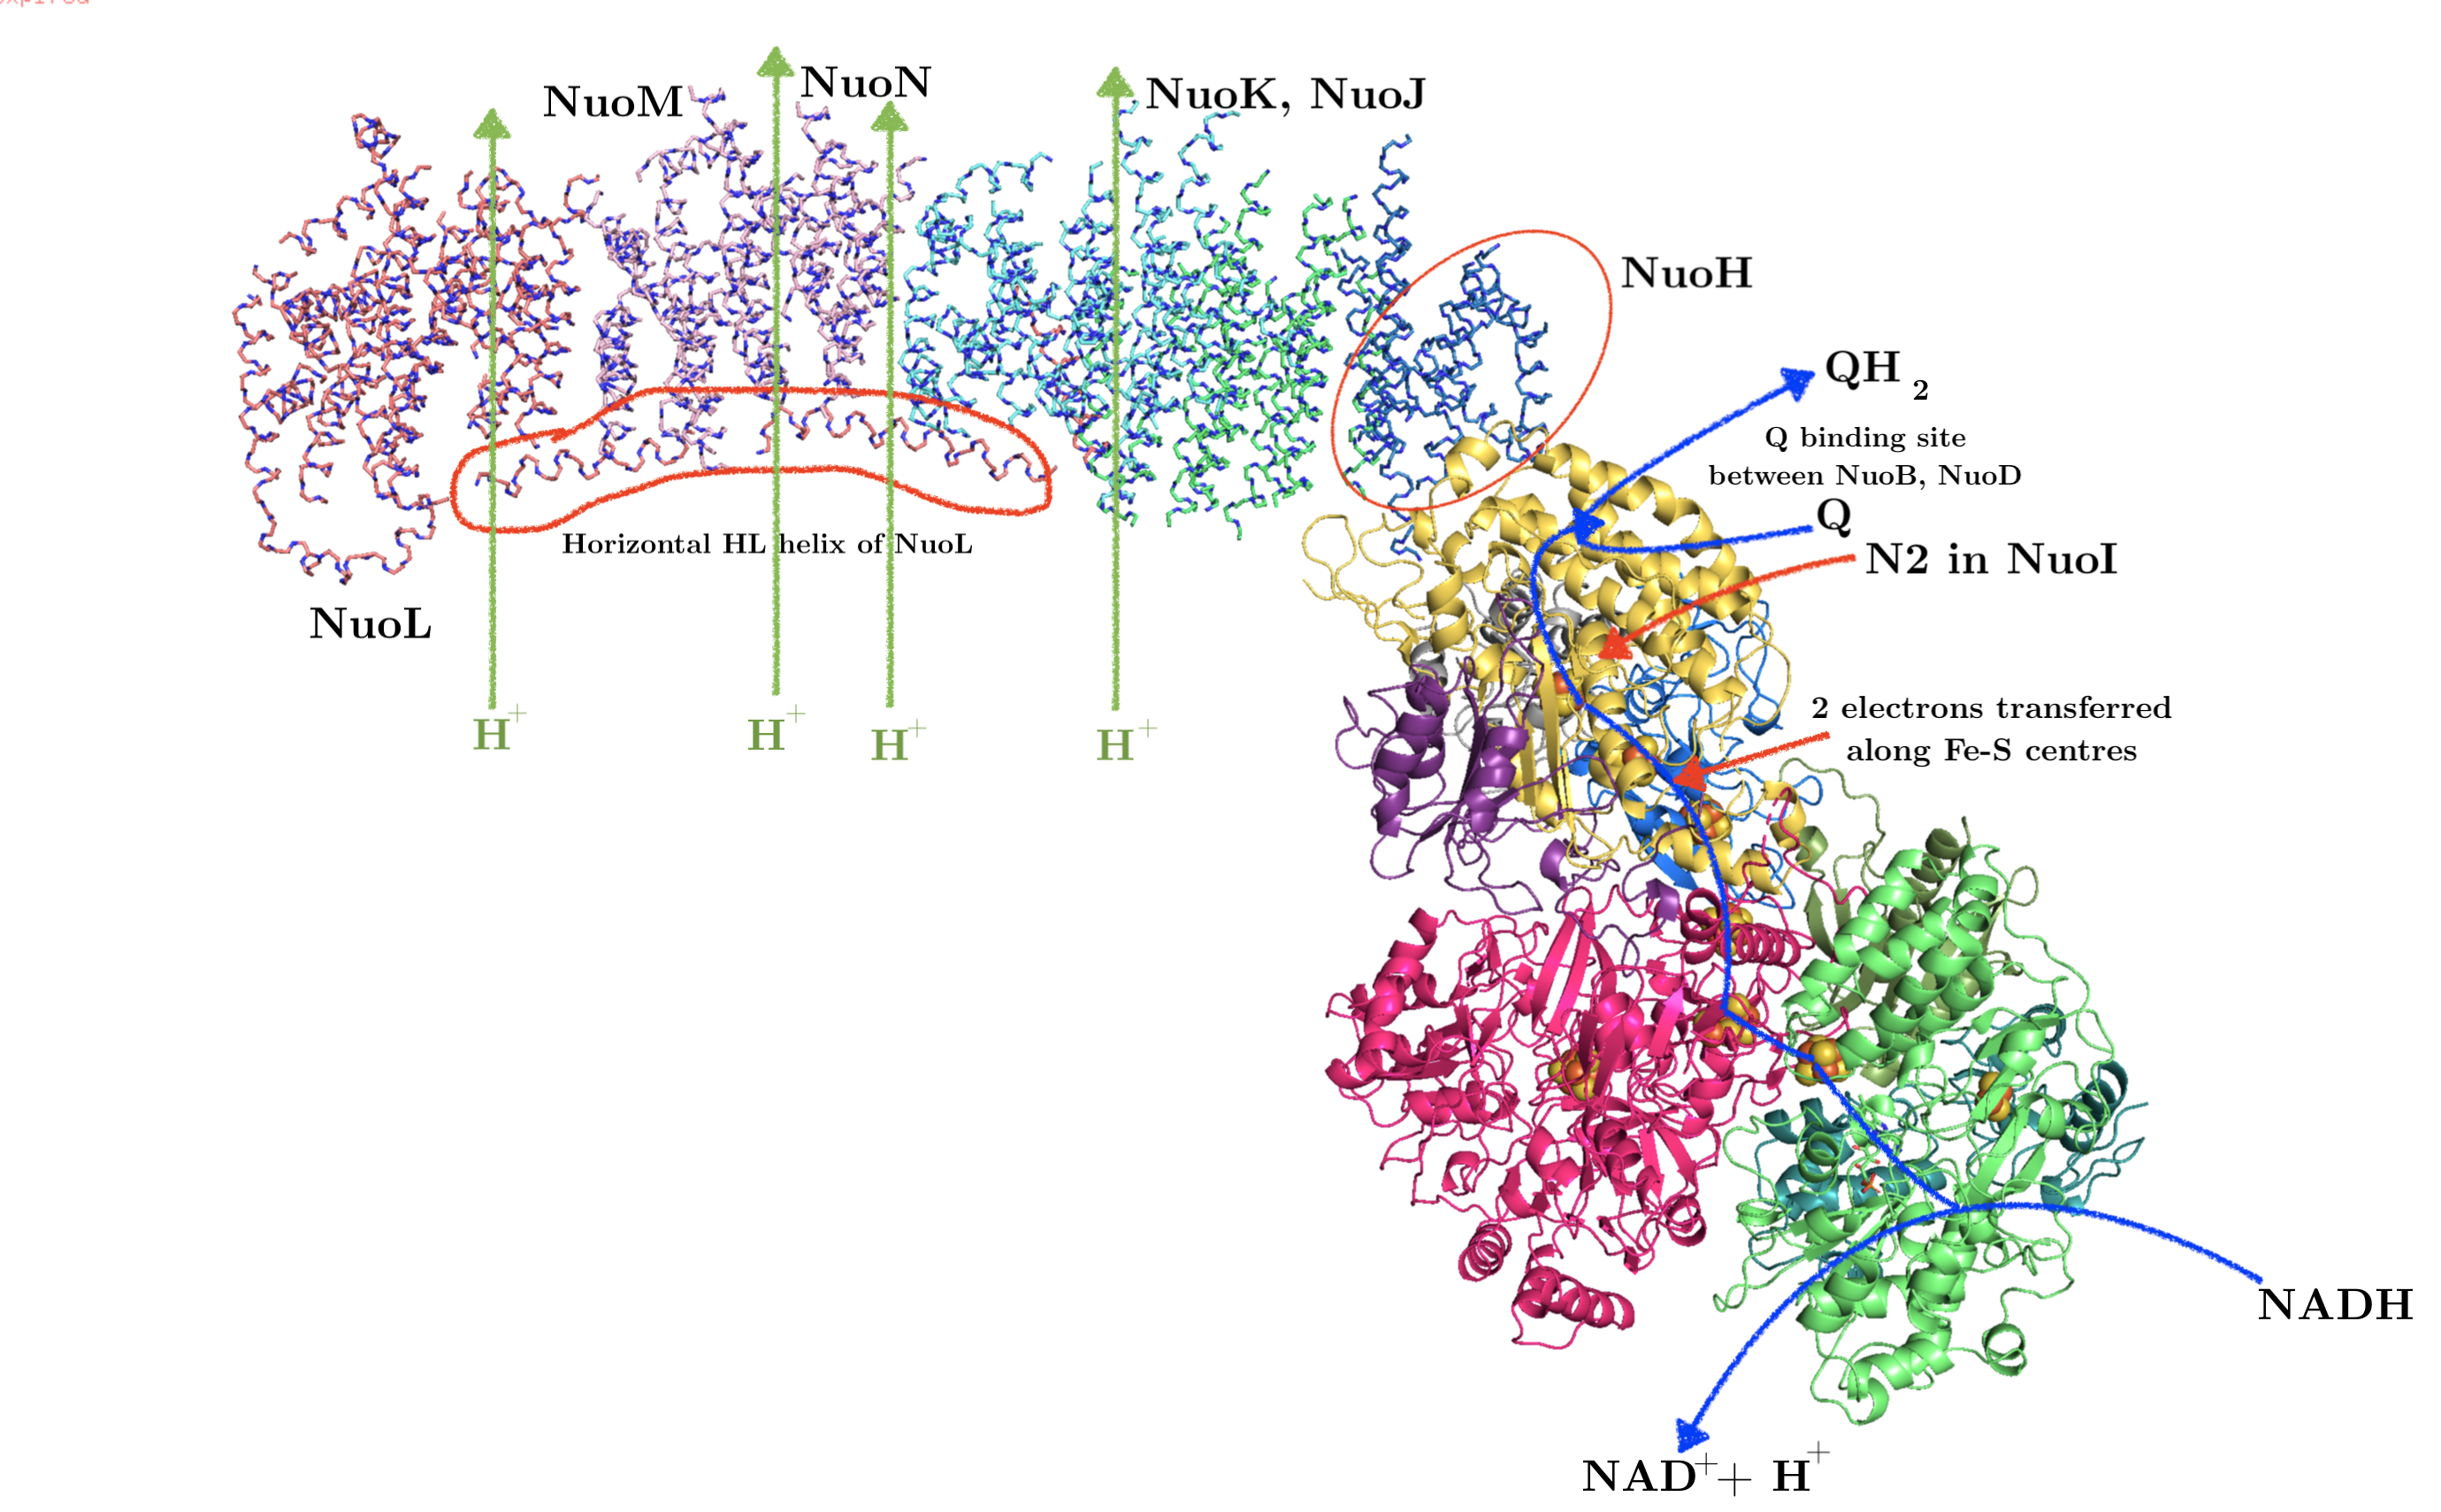
Figure 3: Annotated structure of bacterial complex I. PDB accession code: 3M9S
Hydrophilic domain (peripheral arm)
All FMN and the seven (bacteria have additional two redundant ones) Fe-S centres reside in the hydrophilic domain. FMN, which is located at the extremity of the hydrophilic arm, accepts two electrons from NADH2 and transfers them one by one to the nearest Fe-S centre (N3). Electrons then flow from N3 through a series of isopotential Fe-S centres and finally to N2, whose \(E^\circ\) is significantly less negative (-100 mV) (Sazanov and Hinchliffe 2006). The ubiquinone is then reduced by two one-electron gaining from N2; the existence of at least two forms of semiquinone is identified by electron paramagnetic resonance.
Hydrophobic domain (membrane arm)
The hydrophobic domain comprises subunits NuoAHJKLMN, of which NuoLMN are homologous to bacterial Mrp Na+/H+ antiporters (characterised by the conserved 14 transmembrane helices).
At the centre of each antiporter-like subunit (NuoLMN), two transmembrane helices are ‘broken’ and each have a kink known as a ‘π-bulge’, and there is a lysine residue in this region (Glu407 for NuoM) critical to proton pumping, confirmed by mutagenesis studies. There are two symmetry-related plausible proton channels lined by hydrophilic/charged residues, one connecting the central lysine on one broken TM to the P face and the other connecting lysine of the other TM to the N face.
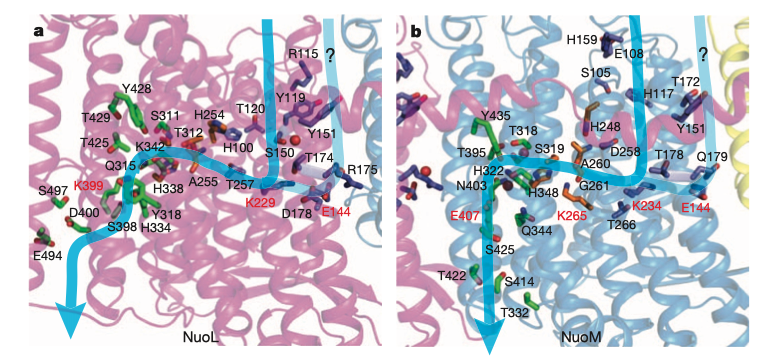
Figure 4: Plausible proton paths
As shown in Figure 5, NuoL/M/N may work by using conformational changes (induced from the hydrophilic domain) to transfer a proton from the lysines on the helix with N half channel to the other lysine (or Glu in NuoM) on the helix with P half channel, and if the pKas of the two lysines differ, this leads to unidirectional proton transport. This mechanism is in accordance with the general scheme shown in Figure 2.
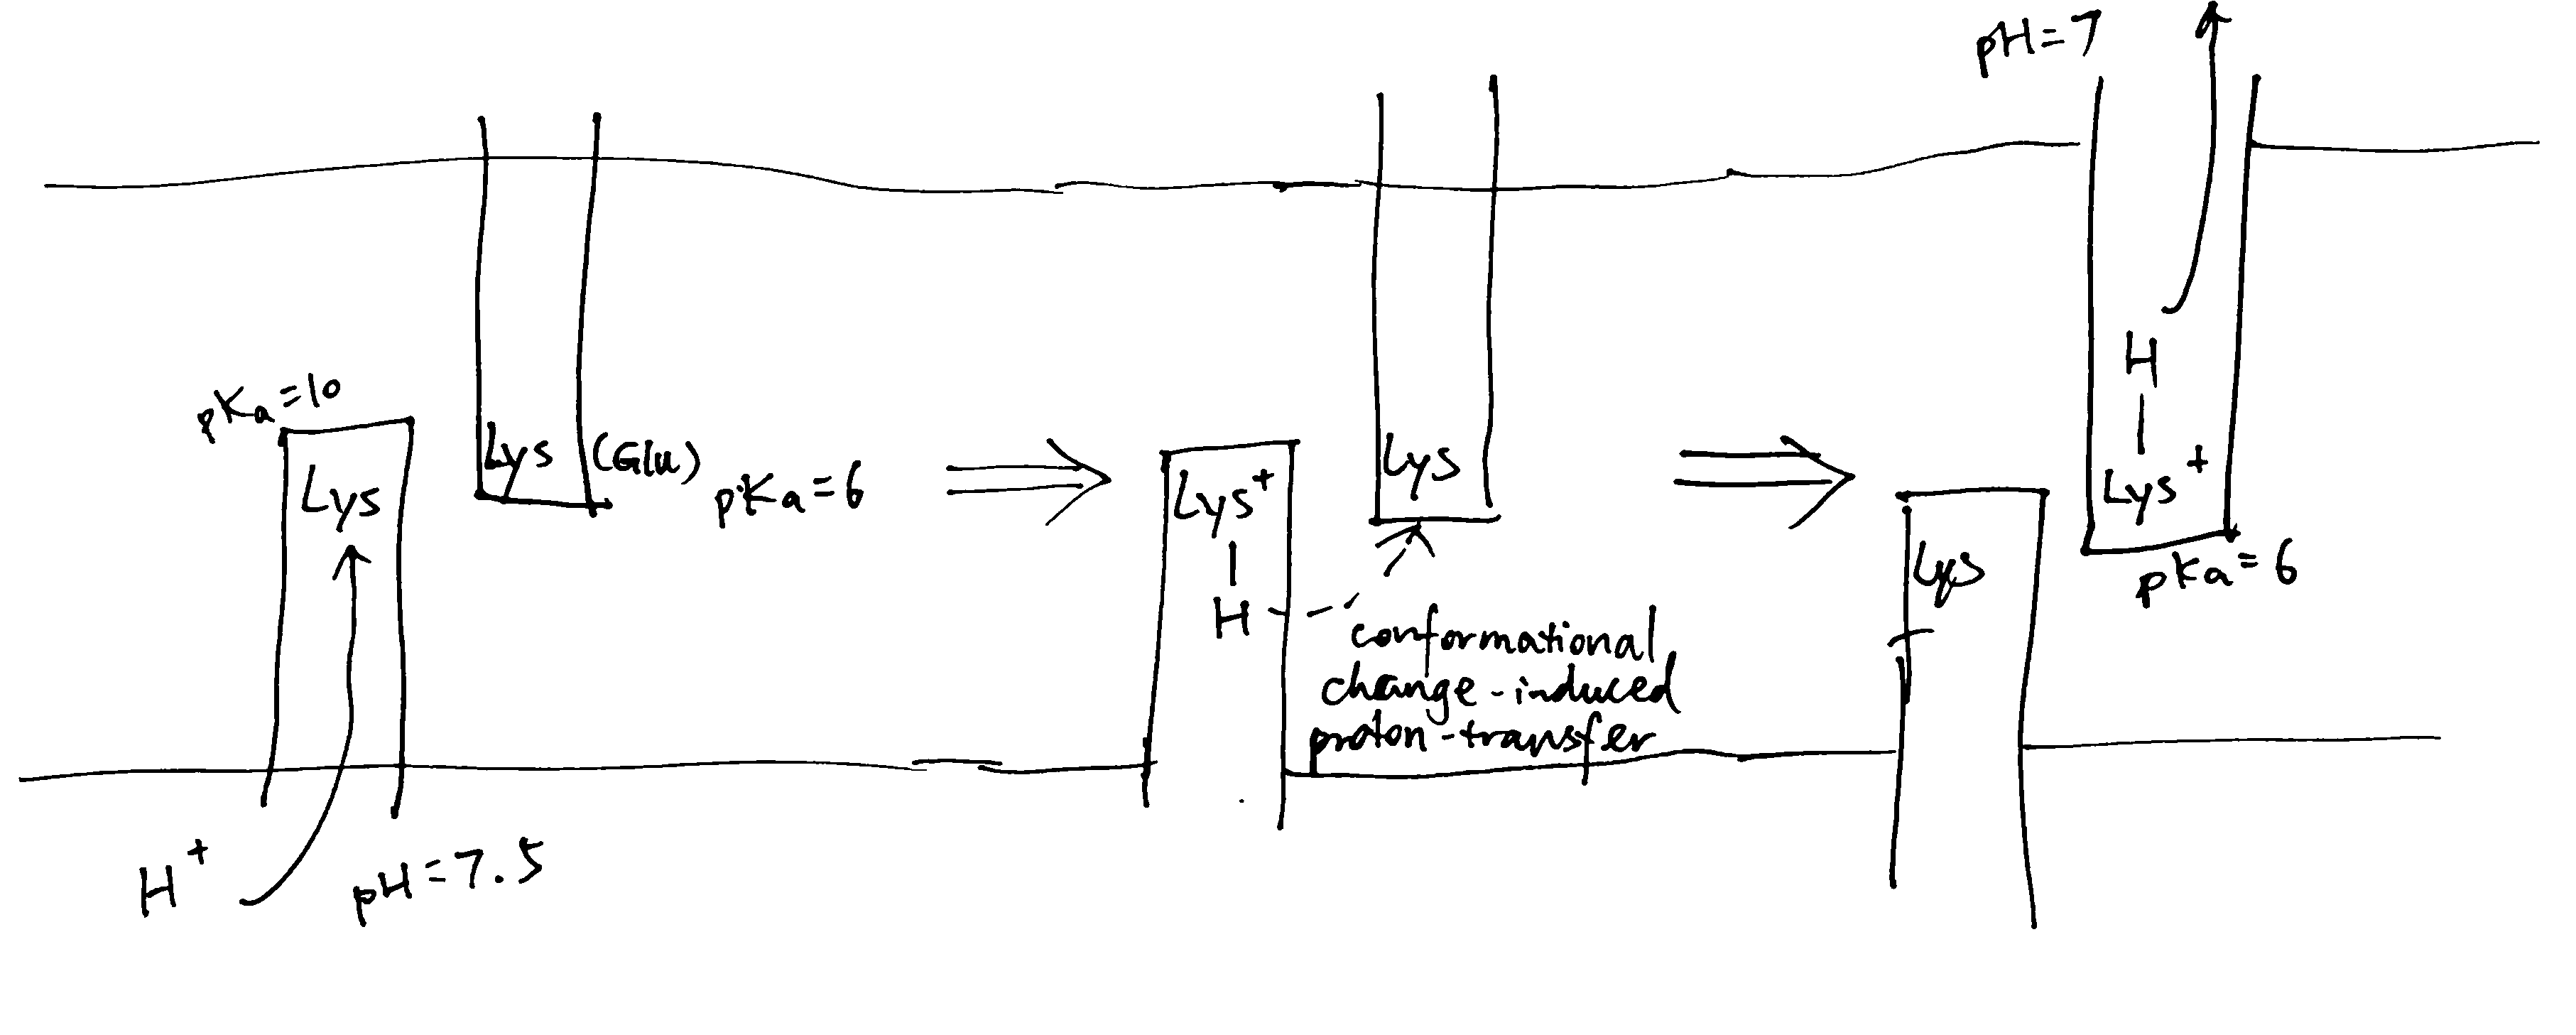
Figure 5: Schematic diagram of proton translocation in complex I
The three antiporter-related subunits are thought to be responsible for the translocation of 3 protons per 2 \(e^-\). An additional channel is found at the interface of subunits NuoN,K,J,A (according to Efremov and Sazanov (2011) and Sazanov (2015) or NuoH,J,K according to Hirst (2013) and Nicholls and Ferguson (2013)) and they are thought to act together to pump another proton with a similar mechanism involving protonation/deprotonation of lysine.
Coupling
It is debated how the redox reactions in the hydrophilic domain triggers conformational change, and how this conformational change is transmitted along the hydrophobic domain.
Some features of the Fe-S centre N2 (the last Fe-S centre in complex I) led to hypotheses in which N2 plays a major role in pumping protons1,2, but currently, the mainstream idea is that the initial conformational change in the hydrophilic domain is contributed mostly by the reduction of ubiquinone.
As claimed by Wirth et al. (2016), reduction of ubiquinone is a two-step process, where the Q binding site cycles between a conformation that permits electron transfer (E-state), and a conformation that permits proton transfer (P-state) onto intermediates of ubiquinone. The conformational change associated with this controlled process is assumed to initiate proton translocation.
It was originally suggested that the horizontal HL helix (see Figure 3) in NuoL could move horizontally like a piston to transmit conformational change along the hydrophobic domain3, but now, after realising the similarity between NuoH and NuoL/M/N, it is thought that conformational changes associated with π-bulges in the mid-membrane parts are transmitted laterally to NuoN/M/L (Nicholls and Ferguson 2013), and, as suggested by Wirth et al. (2016), this is achieved by electrostatic coupling in the central hydrophilic axis.
As I mentioned last week (Shi 2019), as there is no complete evidence demonstrating how complex I proton pump works, other hypotheses exists, including a radical one recently proposed by Morelli et al. (2019), which emphasises the elusiveness of the ‘proton entrance half channel’ (from the middle Lys to the N face) contrasted by the clarity of the ‘proton exit half channel’ (to the P face). Together with another piece of evidence that an obvious proton tunnelling is found at the centre of complex I, Morelli drafted an lateral mechanism of proton circuiting, as shown in Figure 6

Figure 6: A possible lateral proton circuit suggested by Morelli (2019). Protons are only pumped from the middle to the P side, then trasferred through the hydrophilic heads of phospholipids to ATP synthase. After a complete turn in ATP synthase, protons move back through channelling in the middle of the membrane to complex I, but not to the N side
Complex III (cyt bc1 complex)
Complex III is a homodimer, with each monomer consisting of three subunits: cytochrome b, the Rieske iron-sulfur protein, and cytochrome c1. Each monomer has two binding sites for ubiquinone, called QN and QP, indicating their proximities to two opposite faces.
Uniquinone oxidation and proton translocation is coupled in the Q cycle, as illustrated in Figure 7.
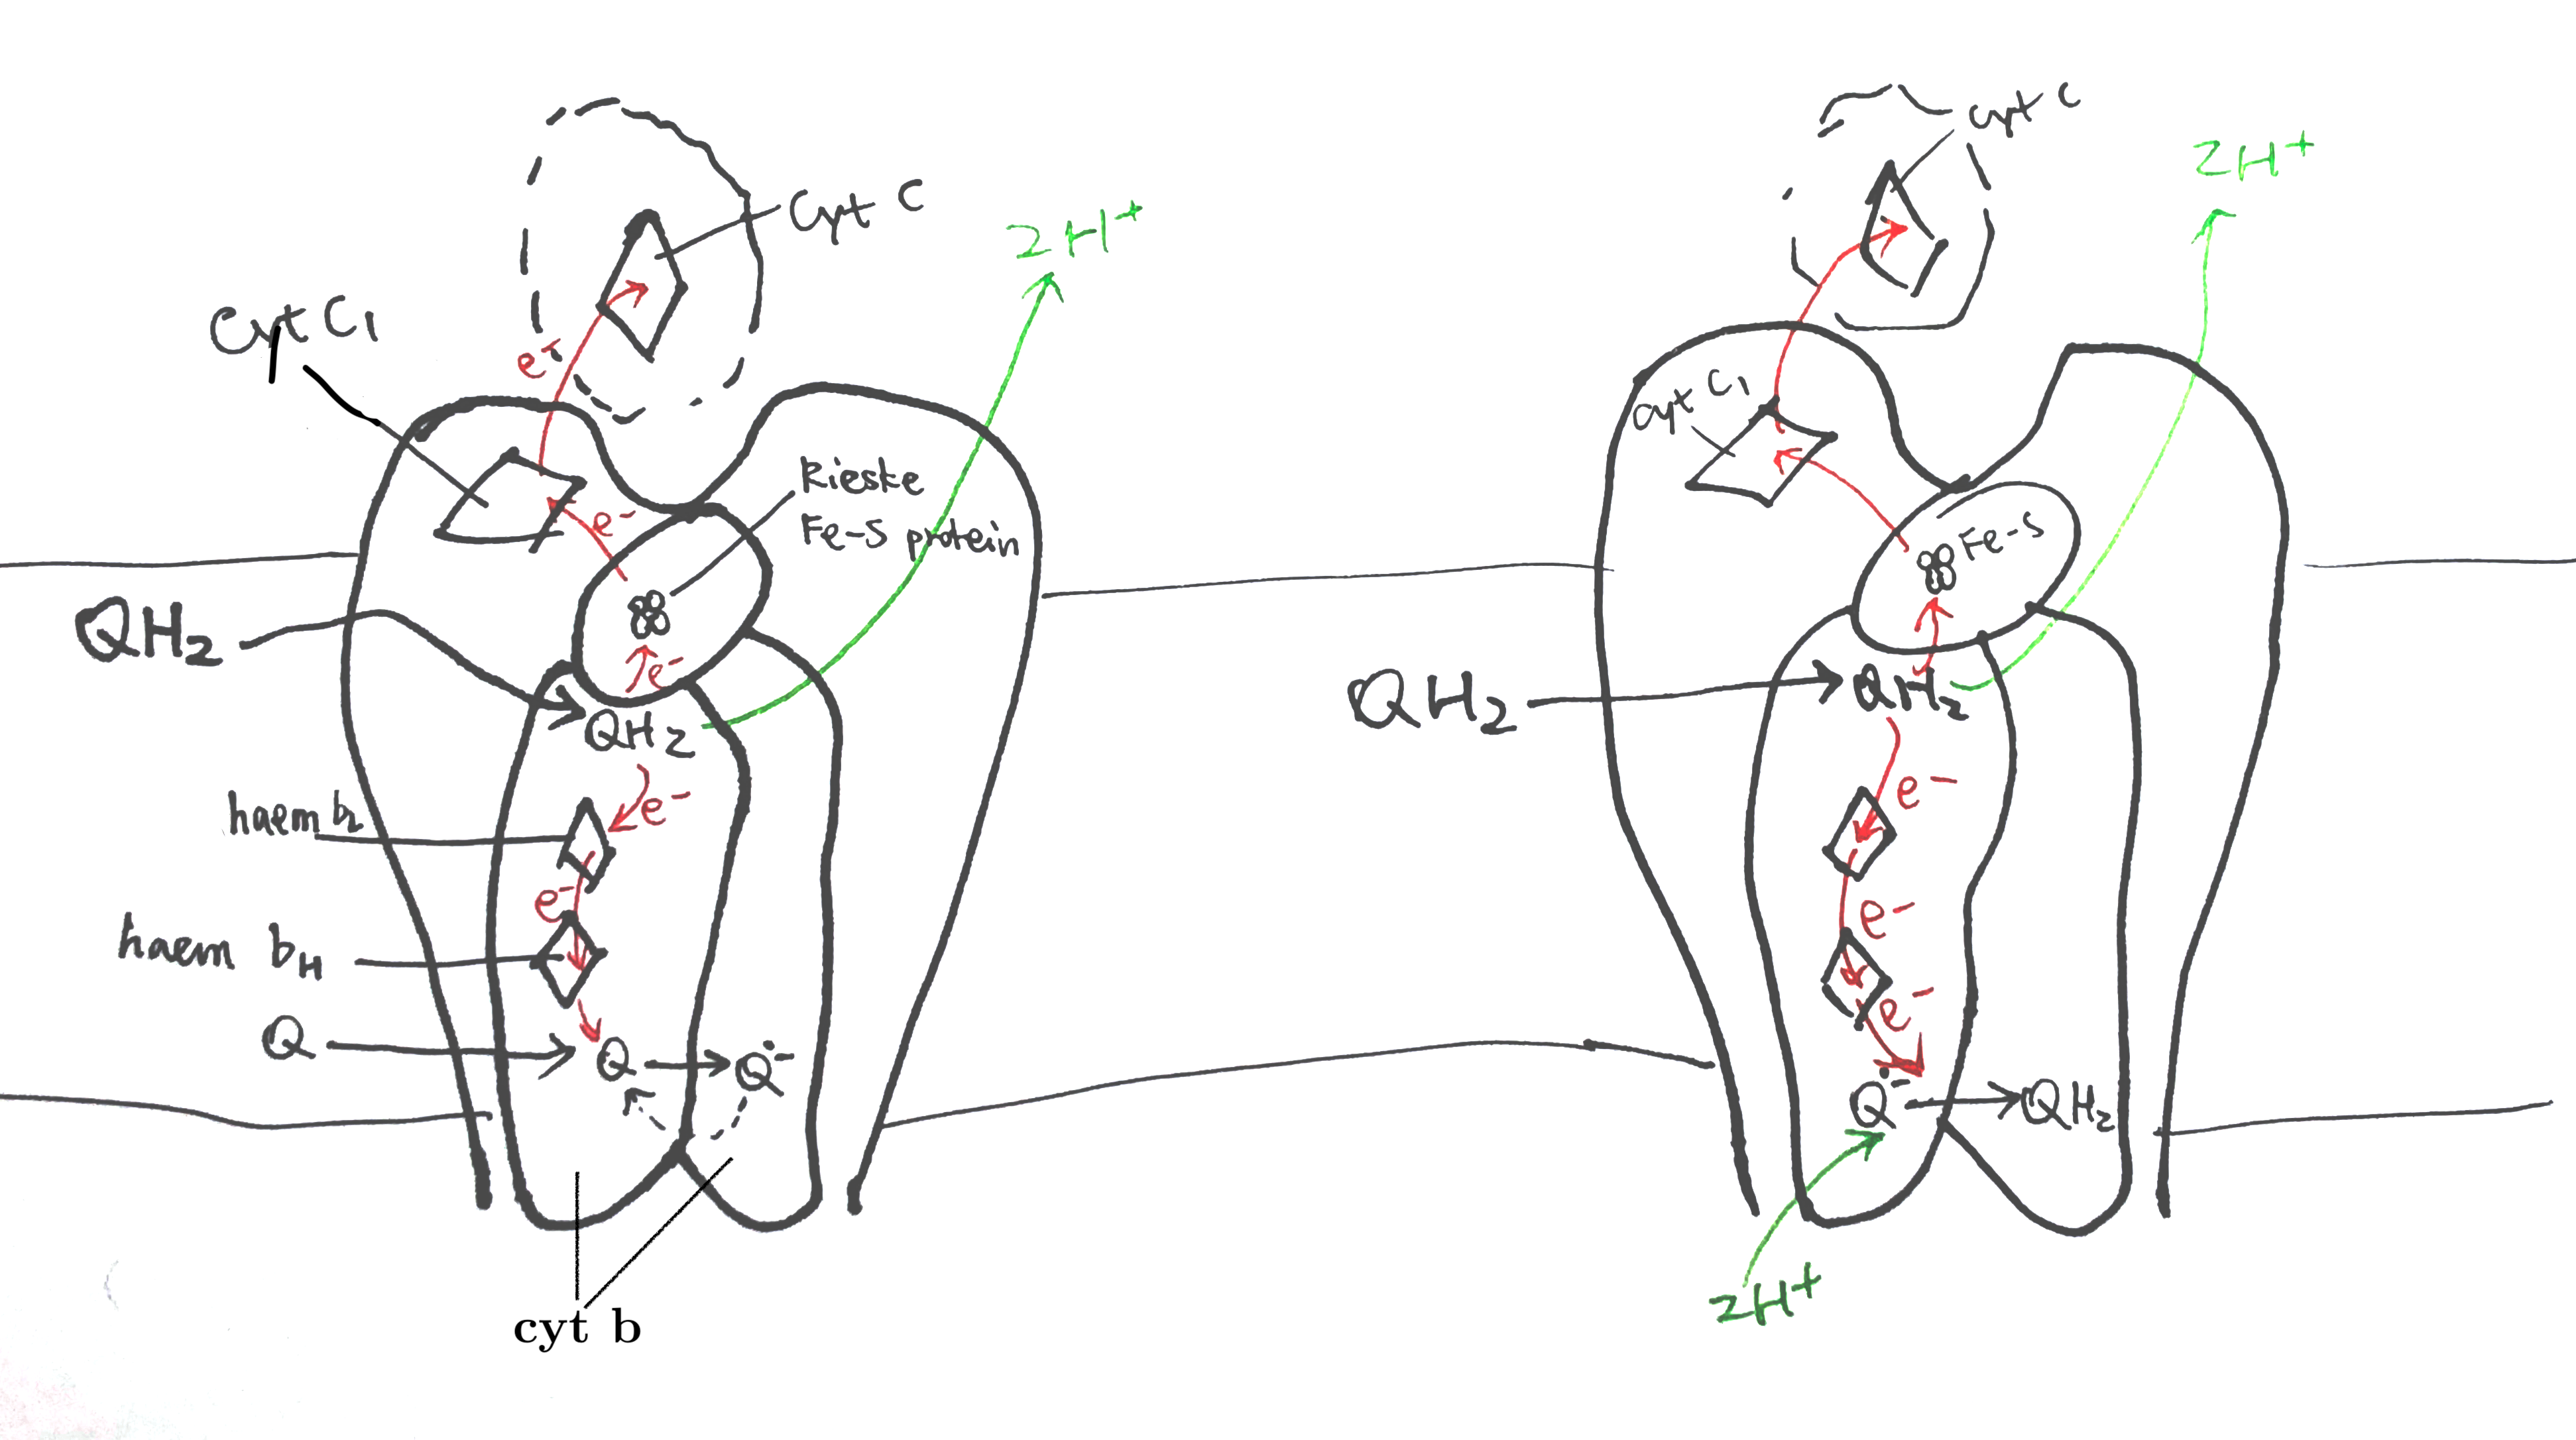
Figure 7: The Q cycle. Left, stage 1; right, stage 2.
In stage 1, QH2 binds to QN of one dimer and a Q binds to the QP of another dimer. The QH2 at QN is oxidised by two electron acceptors in two steps: the first electron is accepted by the Rieske iron-sulfur protein and passed though cytochrome c1 and finally to cytochrome c, and second other electron is accepted by cytochrome b, passed through its two hemes (bH and bL) and finally to the Q at QP on the other monomer, forming semiquinone. The two protons of QH2 are released into the P face (the molecular details is unclear).
In stage 2, the same process is repeated—one QH2 is oxidised to Q, its protons released and electrons passed 1) onto one cytochrome c and 2) to the other side—but this time the electron acceptor on the other side is semiquinone. Acceptance of an electron by semiquinone, and the addition of two protons from the matrix, produces QH2.
Complex IV
Complex IV (cytochrome oxidase) accepts electrons from cytochrome c to reduce oxygen to water and pumps 2 electrons to the P face.
Previous X-ray studies suggested that complex IV exists as dimers with each monomer comprising 13 subunits (Tsukihara et al. 1996). However, it was recently shown by Zong et al. (2018) that complex IV is actually a 14-subunit monomer, and dimerisation was an artifect due to the dissociation of NDUFA4 subunit during the detergent-based purification steps before crystallisation (NDUFA4 hampers dimerisation).
Reduction of oxygen
The key catalytic activities are found in subunit I and II, as shown in Fig. 8
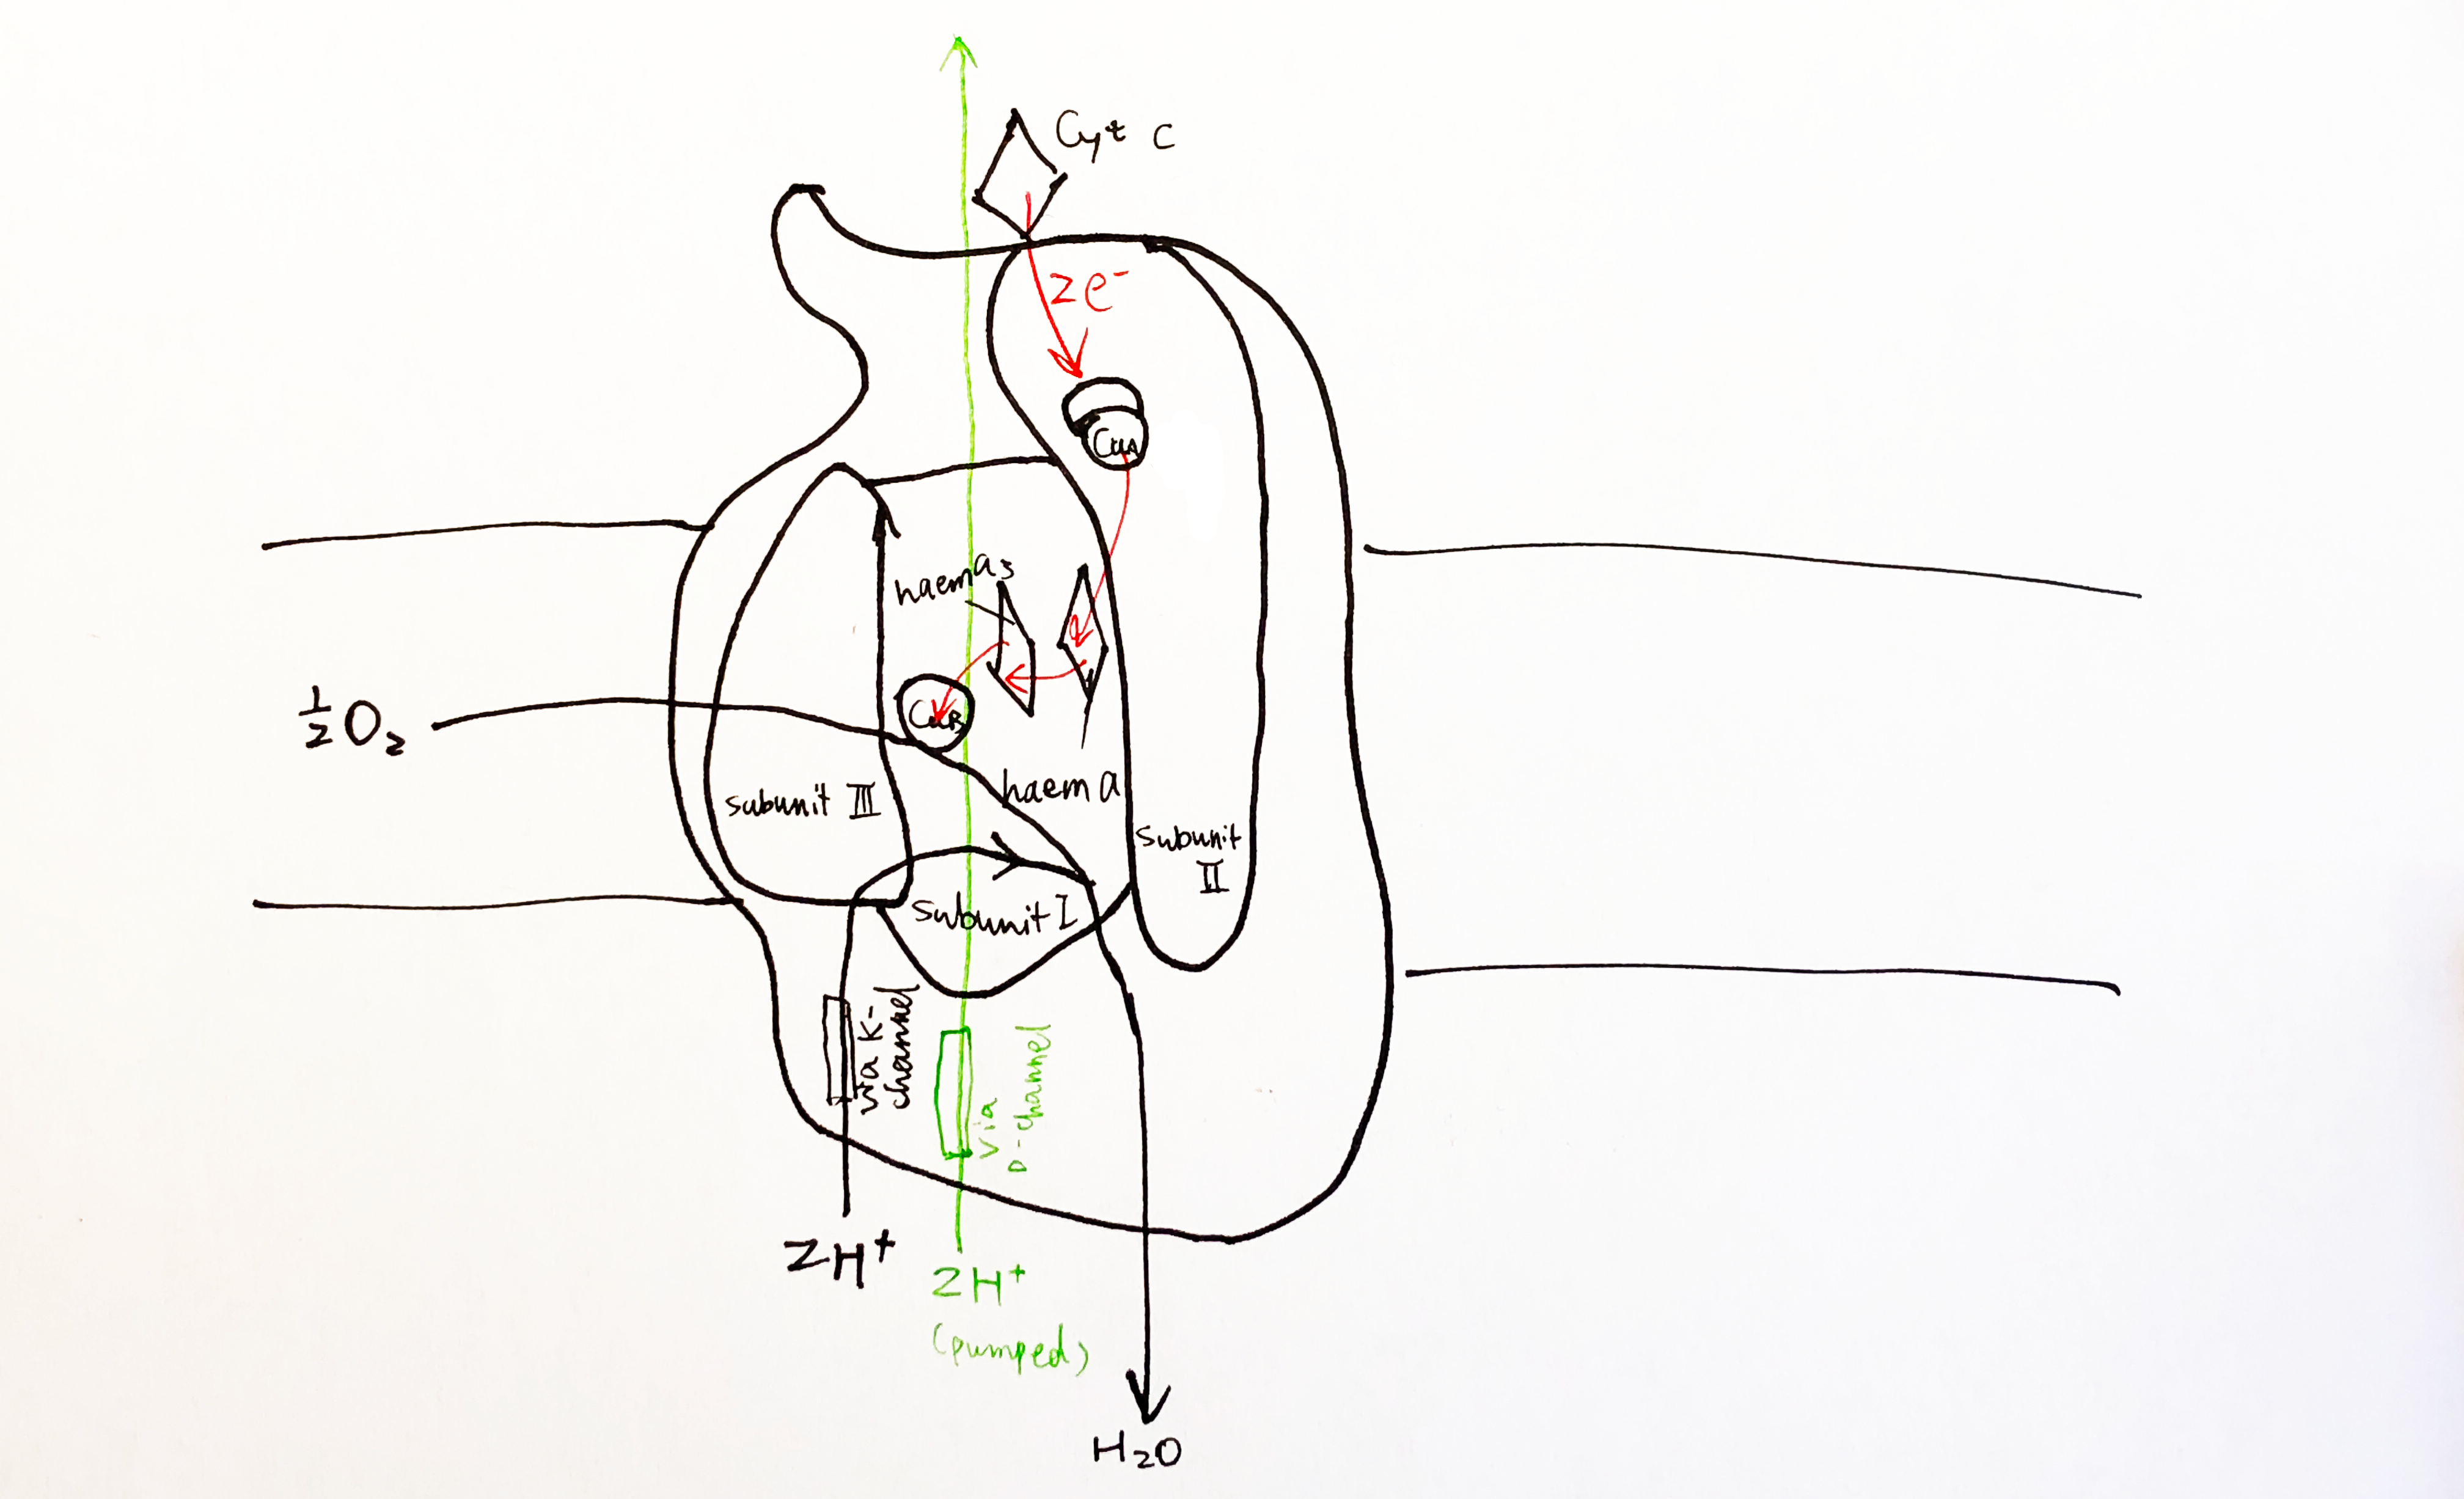
Figure 8: Schematic diagram of complex IV with emphasis on the electron-transport and catalytic activities of subunit I and II.
Each cytochrome c first donates one electron to CuA located in the globular domain of subunit II. CuA is a binulear centre, but it undergoes one-electron redox reactions. The electron is then passed onto haem a, and then to haem a3-CuB binuclear centre, where an oxygen molecule is bound. 4 electrons from cyt c and 4 protons from the N phase are required to reduce one oxygen molecule to two water molecules. CuB has three His ligands, and the forth empty coordination site mediates oxygen reduction by holding the intermediates (its malfunction leads to generation of ROS).
Pump mechanism
For each pair of electrons, 2 H+ from N phase is consumed to make water and another 2 H+ is pumped intot he P phase.
According to a recent review by Wikström and Sharma (2018), the favoured charge-conpensation mechanism is as follows: (see Figure 9)
- when an electron is transferred from haem a to the haem a3-CuB binulear centre (BNC), one proton from Glu242 is loaded onto the ‘proton loading site’ (PLS4). This is a purely electrostatic event (not acid-base, as pKa of PLS is not high enough).
- reprotonated Glu242 transfers another proton to BNC, annihilating the -ve charge in BNC, so H+ on PLS can leave. There must be a barrier preventing H+ flowing back to the N side, which can be achieved by raising the energy of the transition state of proton transfer between the Glu242 and PLS.
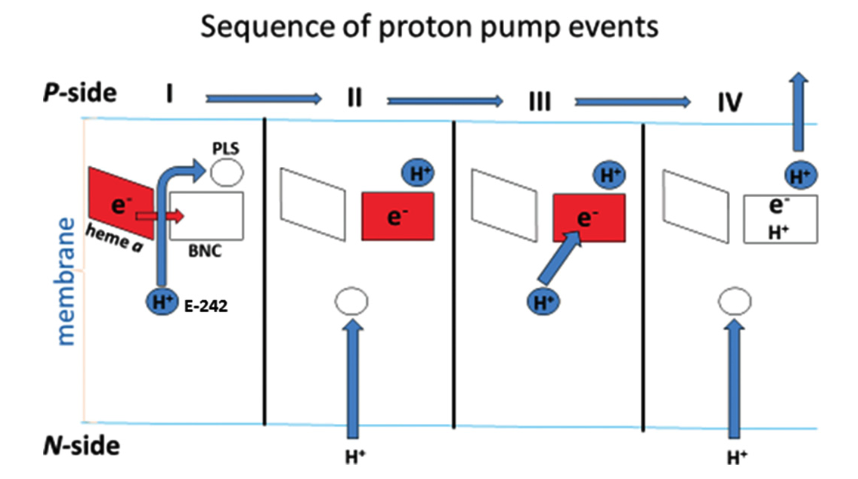
Figure 9: Charge-compensation mechanism of proton pumping in complex IV.
Components of pmf in chloroplasts and mitochondria
In mitochondria, the major component of protomotive force (\(\Delta p\)) is the membrane potential (\(\Delta \Psi\)), while in chloroplasts it is \(\Delta\)pH. This is caused by the physiology of these organelles and the electrical properties of membranes.
In chloroplasts, when protons are being pumped into the thylakoid space, the developed membrane potential is balanced out by efflux of K+ and influx of Cl– through voltage-gated channels, such as KEA3 K+/H+ antiporter and voltage-gated VCCN1 Cl– channel, so it results in a pure pH difference. TPK3 was originally thought to be one of such channels but was recently shown to be not critical (Höhner et al. 2019). There are not many enzymes in the thylakoid lumen, so a low pH is not unsafe. In addition, the high H+ concentration has regulatroy functions. (Höhner et al. 2019)
If mitochondria were allowed to develop such a pH difference (very basic matrix), this would denature the numerous enzymes, such as those involved in \(\beta\)-oxidation and TCA cycle, that operate inside the matrix. In mitochondria, there are not such ion channels to counteract change in \(\Delta \Psi\), so proton translocation results in charge imbalance, leading to \(\Delta \Psi\) change5, and a significant membrane potential can be established with only minuscule amount of charge movement.This can be explained by the low capacitance of the membrane. Capacitance is the amount of charge separation needed to develop unit voltage difference, i.e.
\[C=\dfrac{Q}{V}\]
Given a constant \(V\) (\(\Delta \Psi\)), lower capacitance means smaller charge difference is required to build up that voltage difference.
Figure 10 shows a simple parallel-plate capacitor, which is analogous to mitochondrial inner membrane.

Figure 10: Illustration of a simple parallel-plate capacitor
The electrical capacitance of such a plate can be calculated as:
\[C = \dfrac{\epsilon A}{d}\]
where \(\epsilon\) is the permittivity of the plate, \(A\) is the surface area and \(d\) is the distance separating charges. For mitochondrial inner membrane, although \(\dfrac{A}{d}\) is large, \(\epsilon\) is very small, so the overall capacitance is small.
A failed quantitative analysis
According to Liang et al. (2017), the cell membrane capacitance is aroud 10 mF/m2, and in the Bioenergetics book (Nicholls and Ferguson 2013), the capacitance of the mitochondrial inner membrane takes the same valu. According to a model built by Mannella, Lederer, and Jafri (2013), one mitochondria with matrix volume of \(9.6\times10^4\) nm^3 would have a inner membrane (cristae) surface area of \(5.76\times10^6\) nm2.
With these values, to build up a \(\Delta \Psi\) of -140 mV, the charge required is:
\[Q=CV=0.01\text{F m}^{-2} \times 5.76 \times 10^{-12}\text{m}^{-2}\times 0.14\text{V}=8.1 \times 10^{-15} \text{ C}\]
which corresponds to \(8.1 \times 10^{-15}/96450=8.4 \times 10^{-20}\) moles of H+, or \(8.4 \times 10^{-20}/(9.6\times 10^{-20})=0.875\) M (concentration), which is not realistic…
References
Efremov, Rouslan G., and Leonid A. Sazanov. 2011. “Structure of the Membrane Domain of Respiratory Complex I.” Nature 476 (7361): 414–20. https://doi.org/10.1038/nature10330.
Hirst, Judy. 2013. “Mitochondrial Complex I.” Annual Review of Biochemistry 82 (1). Annual Reviews: 551–75. https://doi.org/10.1146/annurev-biochem-070511-103700.
Höhner, Ricarda, Viviana Correa Galvis, Deserah D. Strand, Carsten Völkner, Moritz Krämer, Michaela Messer, Firdevs Dinc, et al. 2019. “Photosynthesis in Arabidopsis Is Unaffected by the Function of the Vacuolar K\(<\)sup\(>\)+\(<\)/Sup\(>\) Channel Tpk3.” Plant Physiology 180 (3): 1322. https://doi.org/10.1104/pp.19.00255.
Liang, Wenfeng, Yuliang Zhao, Lianqing Liu, Yuechao Wang, Wen Jung Li, and Gwo-Bin Lee. 2017. “Determination of Cell Membrane Capacitance and Conductance via Optically Induced Electrokinetics.” Biophysical Journal 113 (7): 1531–9. https://doi.org/https://doi.org/10.1016/j.bpj.2017.08.006.
Mannella, Carmen A., W. Jonathan Lederer, and M. Saleet Jafri. 2013. “The Connection Between Inner Membrane Topology and Mitochondrial Function.” Journal of Molecular and Cellular Cardiology 62: 51–57. https://doi.org/https://doi.org/10.1016/j.yjmcc.2013.05.001.
Morelli, Alessandro Maria, Silvia Ravera, Daniela Calzia, and Isabella Panfoli. 2019. “An Update of the Chemiosmotic Theory as Suggested by Possible Proton Currents Inside the Coupling Membrane.” Journal Article. Open Biology 9 (4): 180221. https://doi.org/10.1098/rsob.180221.
Nelson, David L., and Michael M. Cox. 2017. Lehninger Principles of Biochemistry. Book. 7th ed. W. H. Freeman. https://search.library.wisc.edu/catalog/999964334502121.
Nicholls, David G., and Stuart J. Ferguson. 2013. Bioenergetics. Book. 4th ed. Amsterdam: Academic Press, Elsevier.
Roessler, Maxie M., Martin S. King, Alan J. Robinson, Fraser A. Armstrong, Jeffrey Harmer, and Judy Hirst. 2010. “Direct Assignment of Epr Spectra to Structurally Defined Iron-Sulfur Clusters in Complex I by Double Electron–Electron Resonance.” Proceedings of the National Academy of Sciences 107 (5): 1930. https://doi.org/10.1073/pnas.0908050107.
Sazanov, Leonid A. 2015. “A Giant Molecular Proton Pump: Structure and Mechanism of Respiratory Complex I.” Nature Reviews Molecular Cell Biology 16. Nature Publishing Group, a division of Macmillan Publishers Limited. All Rights Reserved. SN -: 375 EP. https://doi.org/10.1038/nrm3997.
Sazanov, Leonid A., and Philip Hinchliffe. 2006. “Structure of the Hydrophilic Domain of Respiratory Complex I from Thermus Thermophilus.” Science 311 (5766): 1430. https://doi.org/10.1126/science.1123809.
Shi, Tianyi. 2019. “Principle of Chemiosmotic Mechanism.” 2019.
Tsukihara, Tomitake, Hiroshi Aoyama, Eiki Yamashita, Takashi Tomizaki, Hiroshi Yamaguchi, Kyoko Shinzawa-Itoh, Ryosuke Nakashima, Rieko Yaono, and Shinya Yoshikawa. 1996. “The Whole Structure of the 13-Subunit Oxidized Cytochrome c Oxidase at 2.8 Å.” Science 272 (5265): 1136. https://doi.org/10.1126/science.272.5265.1136.
Verkhovskaya, Marina, and Dmitry A. Bloch. 2013. “Energy-Converting Respiratory Complex I: On the Way to the Molecular Mechanism of the Proton Pump.” The International Journal of Biochemistry & Cell Biology 45 (2): 491–511. https://doi.org/https://doi.org/10.1016/j.biocel.2012.08.024.
Wikström, Mårten, and Vivek Sharma. 2018. “Proton Pumping by Cytochrome c Oxidase – a 40 year Anniversary.” Biochimica et Biophysica Acta (BBA) - Bioenergetics 1859 (9): 692–98. https://doi.org/https://doi.org/10.1016/j.bbabio.2018.03.009.
Wirth, Christophe, Ulrich Brandt, Carola Hunte, and Volker Zickermann. 2016. “Structure and Function of Mitochondrial Complex I.” Biochimica et Biophysica Acta (BBA) - Bioenergetics 1857 (7): 902–14. https://doi.org/https://doi.org/10.1016/j.bbabio.2016.02.013.
Zong, Shuai, Meng Wu, Jinke Gu, Tianya Liu, Runyu Guo, and Maojun Yang. 2018. “Structure of the Intact 14-Subunit Human Cytochrome c Oxidase.” Cell Research 28 (10): 1026–34. https://doi.org/10.1038/s41422-018-0071-1.
Zwicker, K., A. Galkin, S. Drose, L. Grgic, S. Kerscher, and U. Brandt. 2006. “The Redox-Bohr Group Associated with Iron-Sulfur Cluster N2 of Complex I.” Journal Article. J Biol Chem 281 (32): 23013–7. https://doi.org/10.1074/jbc.M603442200.
In some papers (Hirst 2013; Verkhovskaya and Bloch 2013) it was suggested that coupling of electron transport to movement of protons depends on the significantly exergonic reduction of the N2 centre by the roughly isopotential wire of Fe-S centres that delivers electrons from NADH, and the large Em,7 span from N3 to N2 must provide the majority of the driving force for the proton pumping events associated with reduction and reoxidation of N2. This may be incorrect, as newest measurements (Sazanov 2015) of redox potentials of the full Fe-S series (N3-N1b-N4-N5-N6a-N6b-N2) shows that N3, N4 and N6 are about equipotential at about -250 mV, while N1b, N5 and N6b actually have lower potentials; and such an arrangement is claimed by Roessler et al. (2010) to be energy efficient.↩
The mid-point reduction potential of N2 is shown to be pH-dependent, so that Eacid > Ealkaline, and indeed a proton binding site is present there: His226 in Y. lipolytica, and protons are more likely to bind when N2 is reduced. However, shifting the midpoint potential to a more negative and pH insensitive value by exchanging His226 with a methionine affected the functioning of complex I including proton pumping only marginally. (Zwicker et al. 2006)↩
The alternative role of HL would be to stabilise ends of the helices while permitting movement of the middle hydrophilic axis.↩
Although the identity of PLS is uncertain, many studies indicates that it may be the A-propionate substituent of haem a3.↩
To be precise, when ∆p = 0, there is still (negative) membrane potential (\(\Delta \Psi\)), and H+ equilibrate under this \(\Delta \Psi\), which results in a lower pH inside (more concentrated H+). The \(\Delta \Psi\) that contributes to ∆p is actually the \(change\) in \(\Delta \Psi\) caused by proton translocation.↩
SAQ
Explain the difference between electrochemical gradient, pH gradient and membrane potentials. How can they be measured and how are these related to chemiosmotic mechanism.
The electrochemical gradient describes the difference in chemical stability of ions (typically protons), between two aqueous compartments separated by a non-conducting and non-permeable membrane (typically a energy-transducing membrane such as mitochondrial inner membrane). It is quantified by the difference in Gibbs’ free energy, \(\Delta G\), or its molar equivalent, chemical potential, \(\Delta\mu\), of the ion species (proton) between the two compartments.
Usually, electrochemical gradient is used in studying processes coupled with \(\text{H}^+\) movement across a membrane, where one side is positively charged and has a high \(\left[\text{H}^+\right]\) and the other side with -ve charge and low \(\left[\text{H}^+\right]\). These are denoted by P and N sides, respectively, and the ‘gradients’ are often defined as the value of the corresponding parameter on the N side minus its value on the P side.
The electrochemical gradient is the sum of pH gradient (concentration gradient) and membrane potential (electrical gradient).
pH gradient is the (log-transformed) difference in the concentration of protons, \(\left[\text{H}^+\right]\), across the membrane. Protons tend to move down its concentration gradient to maximise the entropy of the whole system, and this tendency, i.e. potetial energy is the “chemical” part of the electrochemical potential. Intracellular/intra-orgenellar pH can be measured with pH-sensitive microelectrodes, nuclear magnetic resonance, or pH-sensitive fluorescent proteins (Loiselle and Casey 2010). Low-RMM weak acids and bases can equilibrate across the membrane independent of the membrane potential. When there is an pH gradient, however, weak acids accumulate in the basic compartment and bases in the acidic compartment, and this property is used to measure pH gradient.
The membrane potential is the electrical potential difference across the membrane. According to Coulomb’s law, postively charge protons is repelled by the positively charged P side while attracted towards the N side, and this also results in a potential energy, which adds to the electrochemical gradient as the “electro-” part. Membrane potential is measured with microelectrodes.
Considering only the effect of concentration and electrical potential, the electrochemical potential for the proton on either side is defined as follows:
\[\bar{\mu}_{\text{H}^+} = \bar{\mu}_{\text{H}^+}^\circ + RT\ln\left[{\text{H}^+}\right] + z_{\text{H}^+}F\Psi\]
where \(\bar{\mu}_{\text{H}^+}^\circ\) is the chemical potential under standard states, \(RT\ln\left[{\text{H}^+}\right]\) and \(z_{\text{H}^+}F\Psi\) are the additional chemical potential due to concentration and electrical potential, respectively.
The electrochemical gradient is the difference of the electrochemical potential between two compartments:
\[\Delta\bar{\mu} = \bar{\mu}_{\text{N}} - \bar{\mu}_{\text{P}} = \left(RT\ln\left[{\text{H}^+}\right]_{\text{N}} + z_{\text{H}^+}F\Psi_{\text{N}}\right) - \left(RT\ln\left[{\text{H}^+}\right]_{\text{P}} + z_{\text{H}^+}F\Psi_{\text{P}}\right)\]
\[ = -\ln{10}RT\left(\text{pH}_\text{N}-\text{pH}_\text{P}\right) + F(\Psi_{\text{N}}-\Psi_{\text{P}})=F\Delta\Psi- 2.3RT\Delta\text{pH} \text{ (J mol}^{-1}\text{)}\]
or it can be expressed as ‘protomotive force’ in (milli)volts:
\[\Delta\text{p}=\Delta\Psi-\dfrac{2.3RT}{F}\Delta\text{pH}\]
Essay
What is the evidence that the chemiosmotic mechanism applies to oxidative phosphorylation and photophosphorylation?
The essay MUST be equipped with at least 3 annotated diagrams and the length should be 1500-1750 words. Remember to include at least one KEY experimental evidence in the essay.
Clues leading to the original chemiosmosis hypothesis
The mechanism of oxidative phosphorylation were initially thought to be analogous to substrate-level phosphotylation, that the redox reactions create ‘high-energy’ intermediates, which in turn adds Pi to ADP. In 1961, Peter Mitchell listed 6 facts to question this chemical mechanism hypothesis:
- The ‘high-energy’ intermediate is not found.
- The close association between phosphorylation and membranous structrures is not explained.
- P/O ratio varies–it does not follow a fixed stoichiometry.
- ATP hydrolysis outside mitochondria promotes NAD reduction inside, accentuated by succinate oxidation. (this observation is probably irrelevant or wrong?)
- Uncoupling can be caused by reagents with distinct chemical properties–so they are unlikely to act on a single ‘intermediate’.
- Unexplained swelling and shrinkage accompany phosphorylation.
Trying to explain these phenomena, he proposed his initial chemiosmosis mechanism, with following 3 features:
- A membrane located, reversible and anisotropic ‘ATPase’
- An electron and hydrogen translocation system
- A charge impermeable membrane
According to this model, oxidation of substrates does not occur in a single compartment, but it instead allow protons and electrons to go in different directions, which in turn creates a concentration gradient of H+ and OH-, as well as a membrane potential. ATP synthesis is driven by the one-way movement of OH- down its electrochemical gradient.
Mitchell’s origin model was rather different from the current model, as depicted in figure 1, but it provided decent explanations for the phenomena listed above. (In his later review (Mitchell 1966), there were some amendments made on his original model, but I have no time to read it)

Figure 1: Left, Mitchell’s original chemiosmosis model; right, the current model
The principal idea was that, energy released from ‘asymmetric’ redox reactions can be used to establish a rather ‘physical’ form of energy (not the common chemical bond energy), the electrochemical gradient, and this is the first coupling. The second coupling is between the synthesis of ATP and the vectorised diffusion of some species promoted by the electrochemical gradient established by the first coupling.
It should be noted that the conception of first coupling was not new. Before the 1960s, it was known that redox reactions can create a electrical potential between two compartments, and it had been noted that some inhibitors of ion transport also has an effect (either stimulatory or inhibitory) on respiratory rate (Robertson 1960) (Fig. 2).

Figure 2: Correlation between the effect on oxygen uptake and on ion accumulation of some inhibitors
Proving proton pumping by the redox chain and determining H+/O ratio
The ‘first coupling’ of the current chemiosmosis model means the pumping of protons into the P compartment powered by stepwise redox reactions along the ETC, with the overall oxidation of NADH or FADH2 as substrate by molecular oxygen.
In actively respiring mitochondria, the proton concentrations (i.e. pH) on either side of the membrane is constant because the rate at which protons are pumped into the P compartment and that flowing back to the N compartment are equal. This makes it difficult to detect the presence of proton flux.
Mitchell and Moyle (1967) devised the following procedure to solve the problem (Fig. 3):
- mitochondria are incubated in anaerobic conditions, allowing H+ to equilibrate (i.e. making \(\Delta p\) fall back to zero)
- a pH-sensitive glass electrode is used to monitor pH of the suspension (i.e. the environment outside the mitochondria)
- a known quantity of O2 is introduced into the suspension by ‘injecting pulses of air-saturated 150mM KCI solution.’
- by measuring the pH change, the amount of protons pumped out of the mitochondria can be calculated, and with the known amount of O2, the H+/O ratio can be calculated.

Figure 3: Determining H/O ratio (Mitchell 1967a)
Additional procedures are needed to minimise error, and they’re described in Bioenergetics pp59-60
Proving the ATP synthesis is driven by the electrochemical gradient
The electrochemical gradients is the sum of concentration gradient and electrical potential gradient, and each of them are shown to drive ATP synthesis.
Jagendorf and Uribe (1966) showed ATP synthesis can be induced in dark, by artificially creating a pH difference across the thylakoid membrane in chloroplasts (Fig 4). In this experiment, broken chloroplasts (extracted from spinach) are first incubated in an acidic solution, allowing the thylakoid space to achieve the enviornmental pH of 4.0 (different acids are used to verify its non-specificity). Next, chloroplasts are exposed to pH 8.0 to develop the proton gradient across the thylakoid membrane. While moving out from the thylakoid space, protons drive ATP synthase. The amount of ATP produced is then determined by firefly luciferase assay. By repeating with different pHs, the authors concluded that the rate of ATP synthesis is positively correlated with the pH difference between two phases.
Sone et al. (1977) used reconsitituted vesicles, made from purified \(\text{F}_o\text{F}_1\) complex and the membrane of a thermophilic bacterium, to achieve ATP synthesis by induced membrane potential (Fig 4). They first incubated mitochondria with valinomycin at a fixed pH, then exposed the suspension to KCl. Valinomycin-mediated entry of K+ shifts the membrane potential so the vesicle interior becomes more positively charged. Consequently, H+ moves out and drives ATP synthase.

Figure 4: Left, Jagendorf (2016); right, Sone (1977)
Monitoring the protomotive force and proton flux in different conditions
If the chemiosmotic model is corrent, it will have some properties resembling those of an electric circuit–the current (\(I\)) and electromotive force (\(V\)) are mirrored by the proton flux (\(J_{\text{H}^+}\)) and the protomotive force (\(\Delta\text{p}\)), respectively. These two terms can be monitored in different states of the proton circuit, and the results are in accordance with the chemiosmotic model.

Figure 5: Circuit Analogy. Top left, proton gradient; top right, oxygen concentration, whose gradient reflects proton flux; below, illustrations of each numbered state.
The different states shown in Fig 5 are explained below:
- When ETC substrate is absent, there is absolutely no oxygen consumption. No active forces act protons so they are allowed to equilibrate, and therefore the \(\Delta\text{p}\) is zero. This resembles an electrical circuit without a power source.
- When substrate (e.g. succinate) is provided, it is oxidised by ETC and oxygen is consumed. ETC starts to pump H+ into the P face, building up the electrochemical gradient If the membrane was perfectly impermeable to H+, ETC would quickly stop as its provided energy for proton efflux balances the electrochemical gradient which favours protons’ influx, and there would be no oxygen consumption. However, the membrane is ‘leaky’ (and there are other processes causing influx of H+), causing constant influx of H+, which in turn allows H+ to be steadily, but slowly, pumped to the P face, which is accompanied by oxygen usage. This resembles more of a closed circuit where energy is dissipated slowly through a high-resistance resistor than of an ‘open circuit’ as described in some books.
- When ADP is added, ATP synthase can use the proton gradient to synthesise ATP. The proton flux through ATP synthase is huge, so the oxygen concentration (whose gradient parallels proton flux) decreases steeply. (I can’t give an rigorous mathematical explanation on the decrease of \(\Delta\text{p}\))
- ATP is used up, and the condition is identical to state 2.
- FCCP short-circuits the proton circuit by allowing H+ quickly flowing back to the N face without doing ‘useful work’ (driving ATP synthase). The proton influx is so large that it outstrips the maximal efflux powered by ETC, so \(\Delta\text{p}\) quickly falls back to zero.
Lateral proton current?
The widely accepted view that ETC pumps protons transversally from the N to the P face may need updating for the following reasons stated by Morelli et al. (2019):
- H+ almost never exist as isolated protons. Instead, they bind to water to form H3O+. Free protons in a mitochondrial periplasmic space are too few (fewer than 10) to drive ATP synthase.
- Free protons are destructive for biological membranes
- The pH inside mitochondria was shown to be higher by 0.5 units from what was previously believed (Żurawik et al. 2016)
- Phospholipid membranes are intrinsically (significantly) permeable to protons
According to the classic view of proton pumping, complex I should have a continuous channel traversing the membrane. However, based on comprehensive X-ray studies, the ‘proton entrance half channel’ is not identified with certainty, while the ‘proton exit half channel’ is clearly identifiable, and an obvious proton tunnelling is found at the centre of complex I. This leads to an lateral mechanism of proton circuiting, as shown below:

Figure 6: A possible lateral proton circuit suggested by Morelli (2019).
Bibliography
Jagendorf, A T, and E Uribe. 1966. “ATP Formation Caused by Acid-Base Transition of Spinach Chloroplasts.” Proceedings of the National Academy of Sciences 55 (1). National Academy of Sciences: 170–77. https://doi.org/10.1073/pnas.55.1.170.
Loiselle, Frederick B., and Joseph R. Casey. 2010. “Measurement of Intracellular pH.” In Membrane Transporters in Drug Discovery and Development, edited by Qing Yan. Vol. 637. Methods in Molecular Biology. Humana Press.
Mitchell, Peter. 1966. “CHEMIOSMOTIC Coupling in Oxidative and Photosynthetic Phosphorylation.” Journal Article. Biological Reviews 41 (3): 445–501. https://doi.org/10.1111/j.1469-185X.1966.tb01501.x.
Mitchell, Peter, and Jennifer Moyle. 1967. “Respiration-driven proton translocation in rat liver mitochondria.” Biochemical Journal 105 (3): 1147–62. https://doi.org/10.1042/bj1051147.
Morelli, Alessandro Maria, Silvia Ravera, Daniela Calzia, and Isabella Panfoli. 2019. “An Update of the Chemiosmotic Theory as Suggested by Possible Proton Currents Inside the Coupling Membrane.” Journal Article. Open Biology 9 (4): 180221. https://doi.org/10.1098/rsob.180221.
Robertson, R. N. 1960. “ION Transport and Respiration.” Journal Article. Biological Reviews 35 (2): 231–64. https://doi.org/10.1111/j.1469-185X.1960.tb01415.x.
Sone, N, M Yoshida, H Hirata, and Y Kagawa. 1977. “Adenosine Triphosphate Synthesis by Electrochemical Proton Gradient in Vesicles Reconstituted from Purified Adenosine Triphosphatase and Phospholipids of Thermophilic Bacterium.” Journal of Biological Chemistry 252: 2956–60.
Żurawik, Tomasz Michał, Adam Pomorski, Agnieszka Belczyk-Ciesielska, Grażyna Goch, Katarzyna Niedźwiedzka, Róża Kucharczyk, Artur Krężel, and Wojciech Bal. 2016. “Revisiting Mitochondrial pH with an Improved Algorithm for Calibration of the Ratiometric 5(6)-Carboxy-Snarf-1 Probe Reveals Anticooperative Reaction with H+ Ions and Warrants Further Studies of Organellar pH.” PLOS ONE 11 (8). Public Library of Science: 1–17. https://doi.org/10.1371/journal.pone.0161353.