absorbance <-
  c(0.086, 0.142, 0.548, 0.976, 1.419, 1.294,
    1.161, 1.472, 1.800, 2.003, 1.777, 1.463,
    1.430, 1.486, 1.538, 1.254, 0.820, 0.503,
    0.388, 0.235, 0.204, 0.163, 0.148, 0.151,
    0.169, 0.221, 0.381, 0.701, 0.954, 0.917,
    0.651, 0.423, 0.274, 0.191, 0.034, 0.031
  )
volume <- 1:36
plot(volume, absorbance, xlab = 'volume (ml)', type = 'p',
     ylim=c(0, 2.2), yaxs='i')
lines(volume, absorbance)
lines(c(5, 5), c(0.0, 1.419), col='red')
lines(c(10, 10), c(0.0, 2.003), col='red')
lines(c(15, 15), c(0.0, 1.538), col='red')
lines(c(29, 29), c(0.0, 0.954), col='red')
text(4, 1.5, 'ferritin (450 kDa)')
text(10, 2.1, expression(paste(gamma, '-globulin (155 kDa)')))
text(17, 1.6, 'serum albumin (67 kDa)')
text(29, 1.05, 'cytochrome-c (14 kDa)')

volume <- c(5, 10, 15, 29) + 44
log_mw <- log(c(450, 155, 67, 14), 10)
plot(volume, log_mw,
     xlab='elution volume (ml)', ylab='log(molecular weight) (kDa)')
(mod <- lm(log_mw ~ volume))
##
## Call:
## lm(formula = log_mw ~ volume)
##
## Coefficients:
## (Intercept)       volume
##     5.52272     -0.06075
abline(mod, col='red')
(mod1 <- lm(log_mw[-4] ~ volume[-4]))
##
## Call:
## lm(formula = log_mw[-4] ~ volume[-4])
##
## Coefficients:
## (Intercept)   volume[-4]
##     6.68975     -0.08271
abline(mod1, col='blue')
points(c(67, 60), log(c(25.8, 29.1), 10), col='red')

par(mar = c(5,5,2,5))
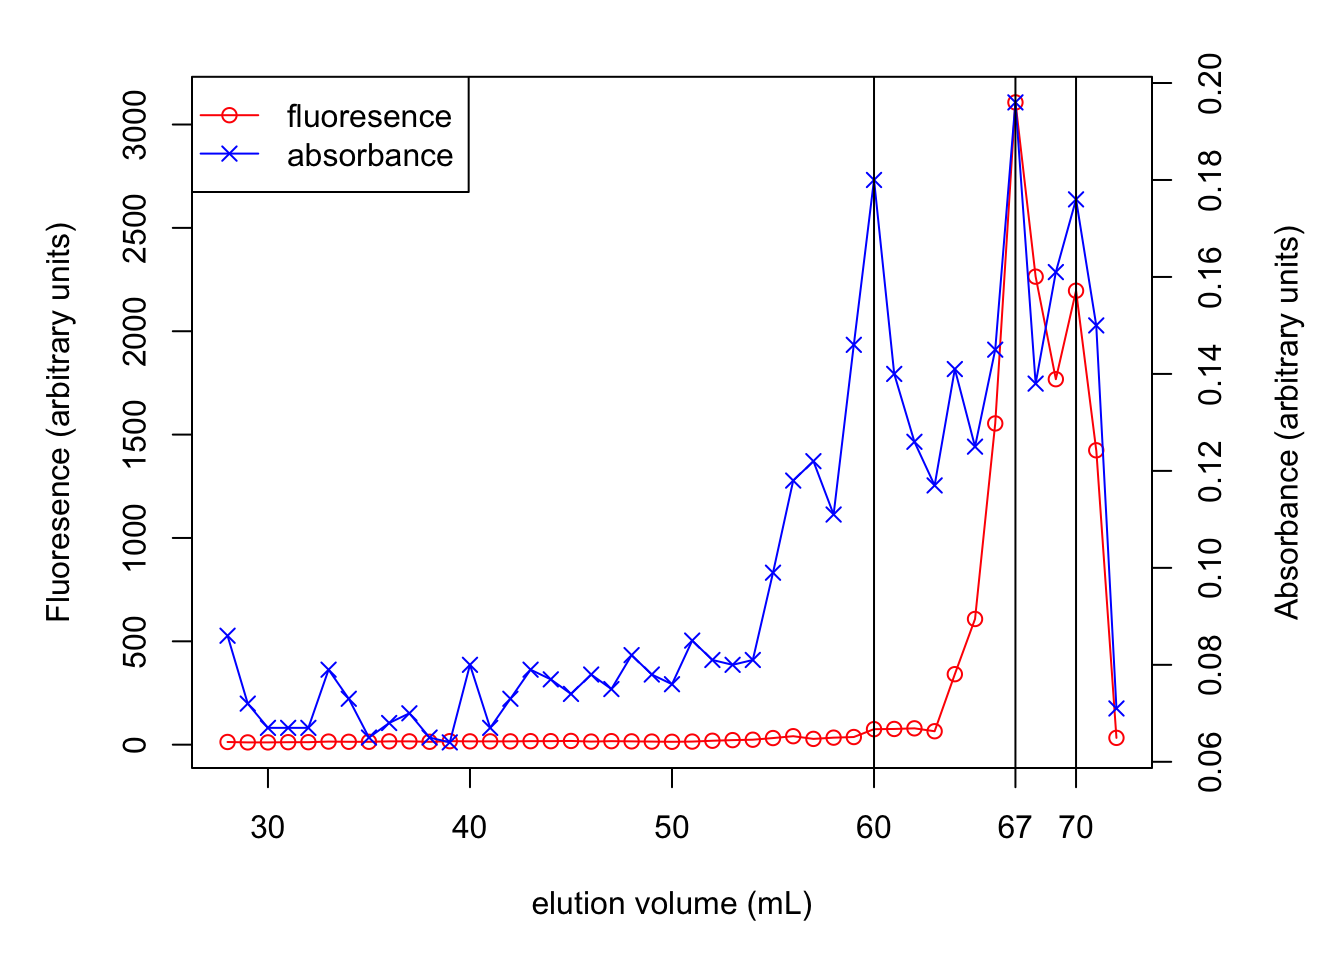
f <- c(13, 11, 11, 12, 12, 15, 14, 14, 16, 16, 14, 17,
       16, 16, 16, 17, 17, 18, 15, 17, 16, 15, 14, 15,
       19, 22, 24, 32, 41, 28, 34, 37, 75, 76, 79, 65,
       341, 608, 1554, 3107, 2264, 1768, 2196, 1424, 33)
v <- 28:72
plot(v, f, type='p', col='red', ylab='Fluoresence (arbitrary units)', xlab='elution volume (mL)')
lines(v, f, col='red')

A <- c(0.086, 0.072, 0.067, 0.067, 0.067, 0.079, 0.073, 0.065, 0.068,
       0.070, 0.065, 0.064, 0.080, 0.067, 0.073, 0.079, 0.077, 0.074,
       0.078, 0.075, 0.082, 0.078, 0.076, 0.085, 0.081, 0.080, 0.081,
       0.099, 0.118, 0.122, 0.111, 0.146, 0.180, 0.140, 0.126, 0.117,
       0.141, 0.125, 0.145, 0.196, 0.138, 0.161, 0.176, 0.150, 0.071)
par(new = T)
plot(v, A, axes=F, xlab=NA, ylab=NA, col='blue', pch=4)
lines(v, A, col='blue')
axis(side = 4)
mtext(side = 4, line = 3, 'Absorbance (arbitrary units)')
legend('topleft',
       legend=c('fluoresence', 'absorbance'),
       lty=c(1, 1), pch=c(1, 4), col=c('red', 'blue'))
abline(v = c(60, 67, 70))
axis(side = 1, at = 67,labels = T)


